Over the last five years, Delhi’s air quality has undergone measurable changes that reflect both environmental interventions and the persistent challenges of urban pollution. Thus, here using historical AQI data from 2020 to 2024, this report presents a comparative analysis focused on the number of days falling into each AQI category, offering insight into progress and setbacks across years. Here is the New Delhi Annual Air Quality data to highlight the ongoing concern.
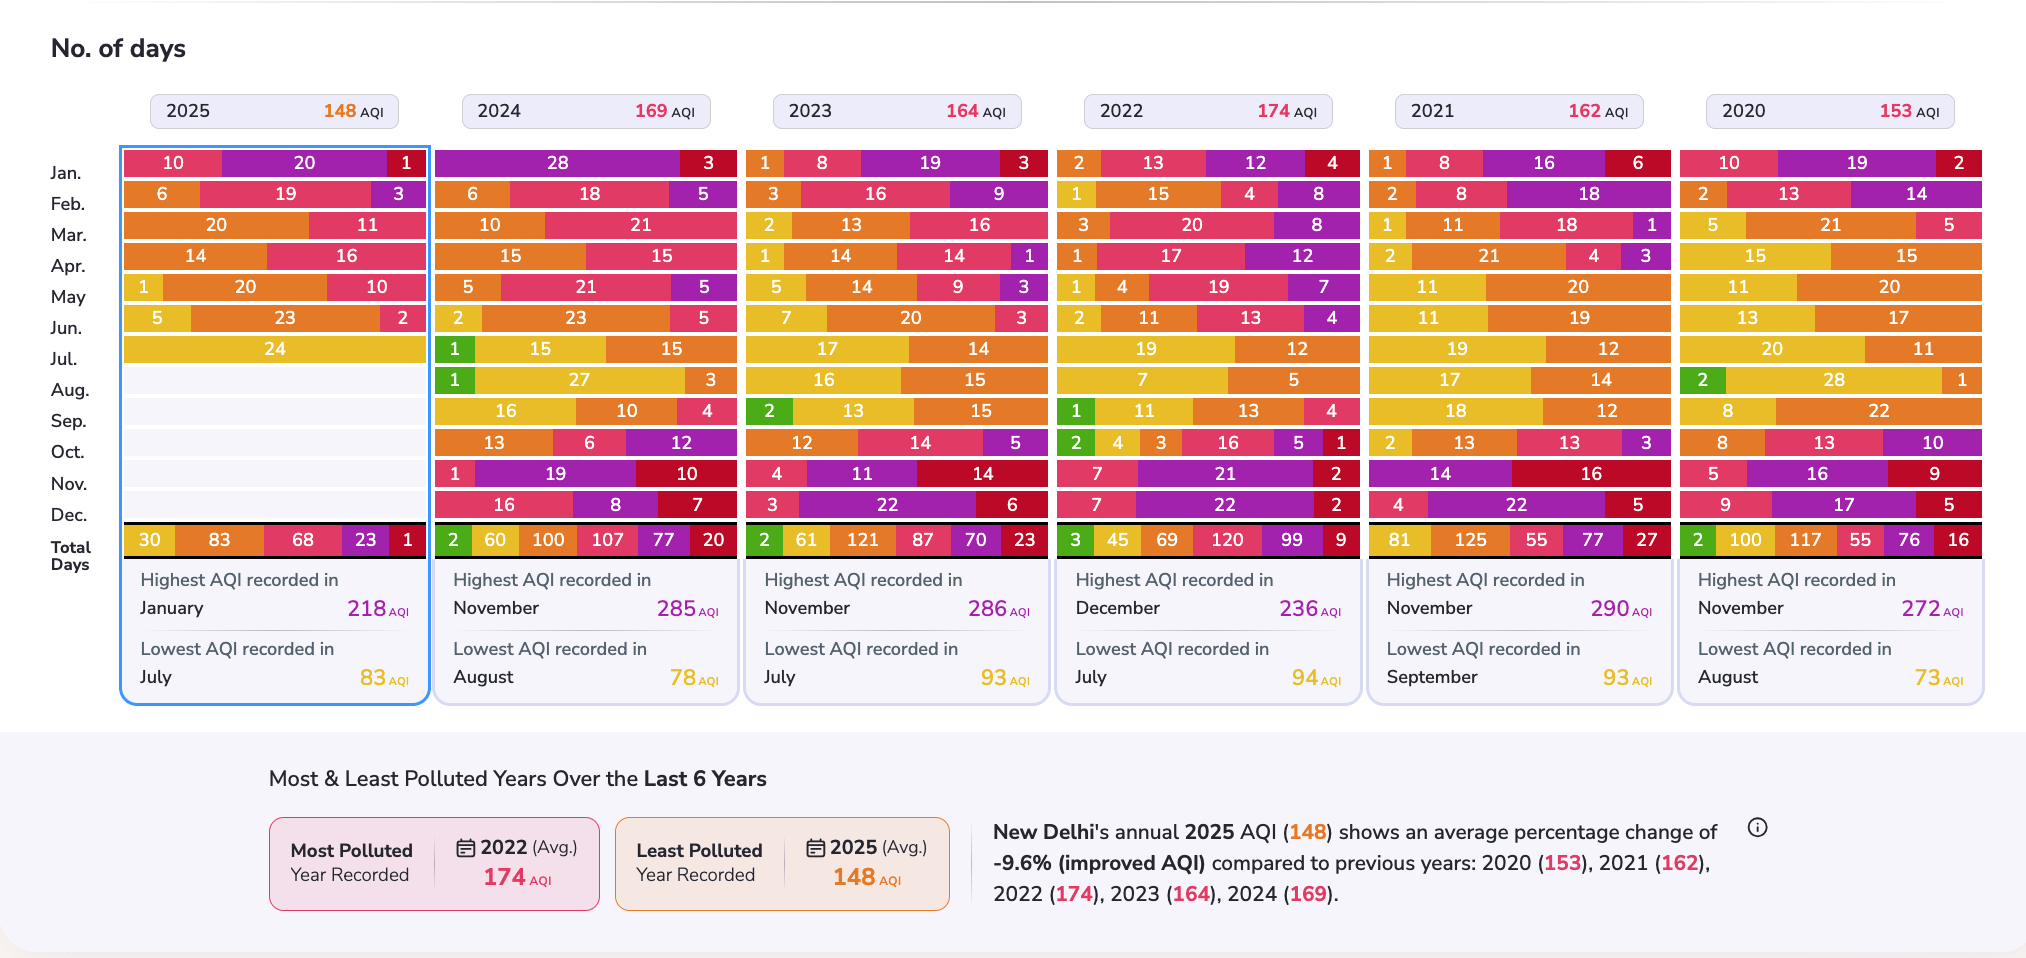
Year Vs Number of Days of AQI Category – New Delhi (2020–2024)
| Year | Good | Moderate | Poor | Unhealthy | Severe | Hazardous |
| 2024 | 2 | 60 | 100 | 107 | 77 | 20 |
| 2023 | 2 | 61 | 121 | 87 | 70 | 23 |
| 2022 | 3 | 45 | 69 | 120 | 99 | 9 |
| 2021 | 2 | 81 | 125 | 55 | 77 | 27 |
| 2020 | 2 | 100 | 117 | 55 | 76 | 16 |
Note: 2025 data is excluded from this comparison as it only covers January to July, and the most polluted season (October to December) is yet to occur.
Deep Dive: New Delhi AQI Trends Across Years
Good Days (AQI 0–50)
Across five years, the number of Good days remained consistently low, ranging between 2 and 3 per year. This indicates how rarely Delhi experiences truly clean air conditions, even during favourable weather periods such as monsoon.
Moderate Days (AQI 51–100)
Moreover, the number of Moderate days varied dramatically, from a low of 45 in 2022 to a high of 100 in 2020. The decline post-2020 could reflect increased post-pandemic urban activity, while a partial recovery was observed in 2021 (81 days).
Poor Days (AQI 101–150)
Poor air quality was the most common category in nearly every year. 2021 peaked at 125 Poor days, indicating persistent urban pollution. Despite some reduction in later years, this category still forms the bulk of Delhi’s air quality profile.
Unhealthy Days (AQI 151–200)
2022 witnessed a spike in unhealthy days with 120 occurrences. Indicating, this may have been driven by weather stagnation, construction activity, and vehicular emissions. Notably, 2021 and 2020 had only 55 Unhealthy days each, hinting at better pollution control during those years.
Severe Days (AQI 201–300)
The frequency of Severe days was alarmingly high in all years, especially in 2022 (99 days) and 2020 (76 days). Winter seasons typically contribute the most to this count due to temperature inversions and external factors like stubble burning in neighbouring states.
Hazardous Days (AQI 301–500)
Hazardous air quality events occurred regularly, with 2021 leading at 27 days, followed closely by 2023 (23 days). These represent days when air becomes hazardous to all population groups. Hence, their consistent presence indicates systemic issues like poor industrial compliance and seasonal firecracker usage.
Seasonal Pollution Patterns
Winter (Nov–Jan):
Consistently, these months witness the worst AQI due to temperature inversions, stubble burning from neighbouring states, vehicle emissions and festive pollution. High numbers of Severe and Unhealthy days cluster here, especially in 2021 and 2022.
Summer and Monsoon (Apr–Aug):
These seasons bring some relief with higher counts of Moderate and Poor days, aided by wind and rainfall. This pattern is noticeable across all years, particularly in 2020 and 2021.
Autumn (Sep–Oct):
A transitional phase where AQI starts to worsen. Moderate and Poor days rise before peaking in winter. The increase in Poor days during this period was notably sharp in 2022 and 2024.
Detailed Insights of Delhi AQI: 2025 (Jan–July Only)
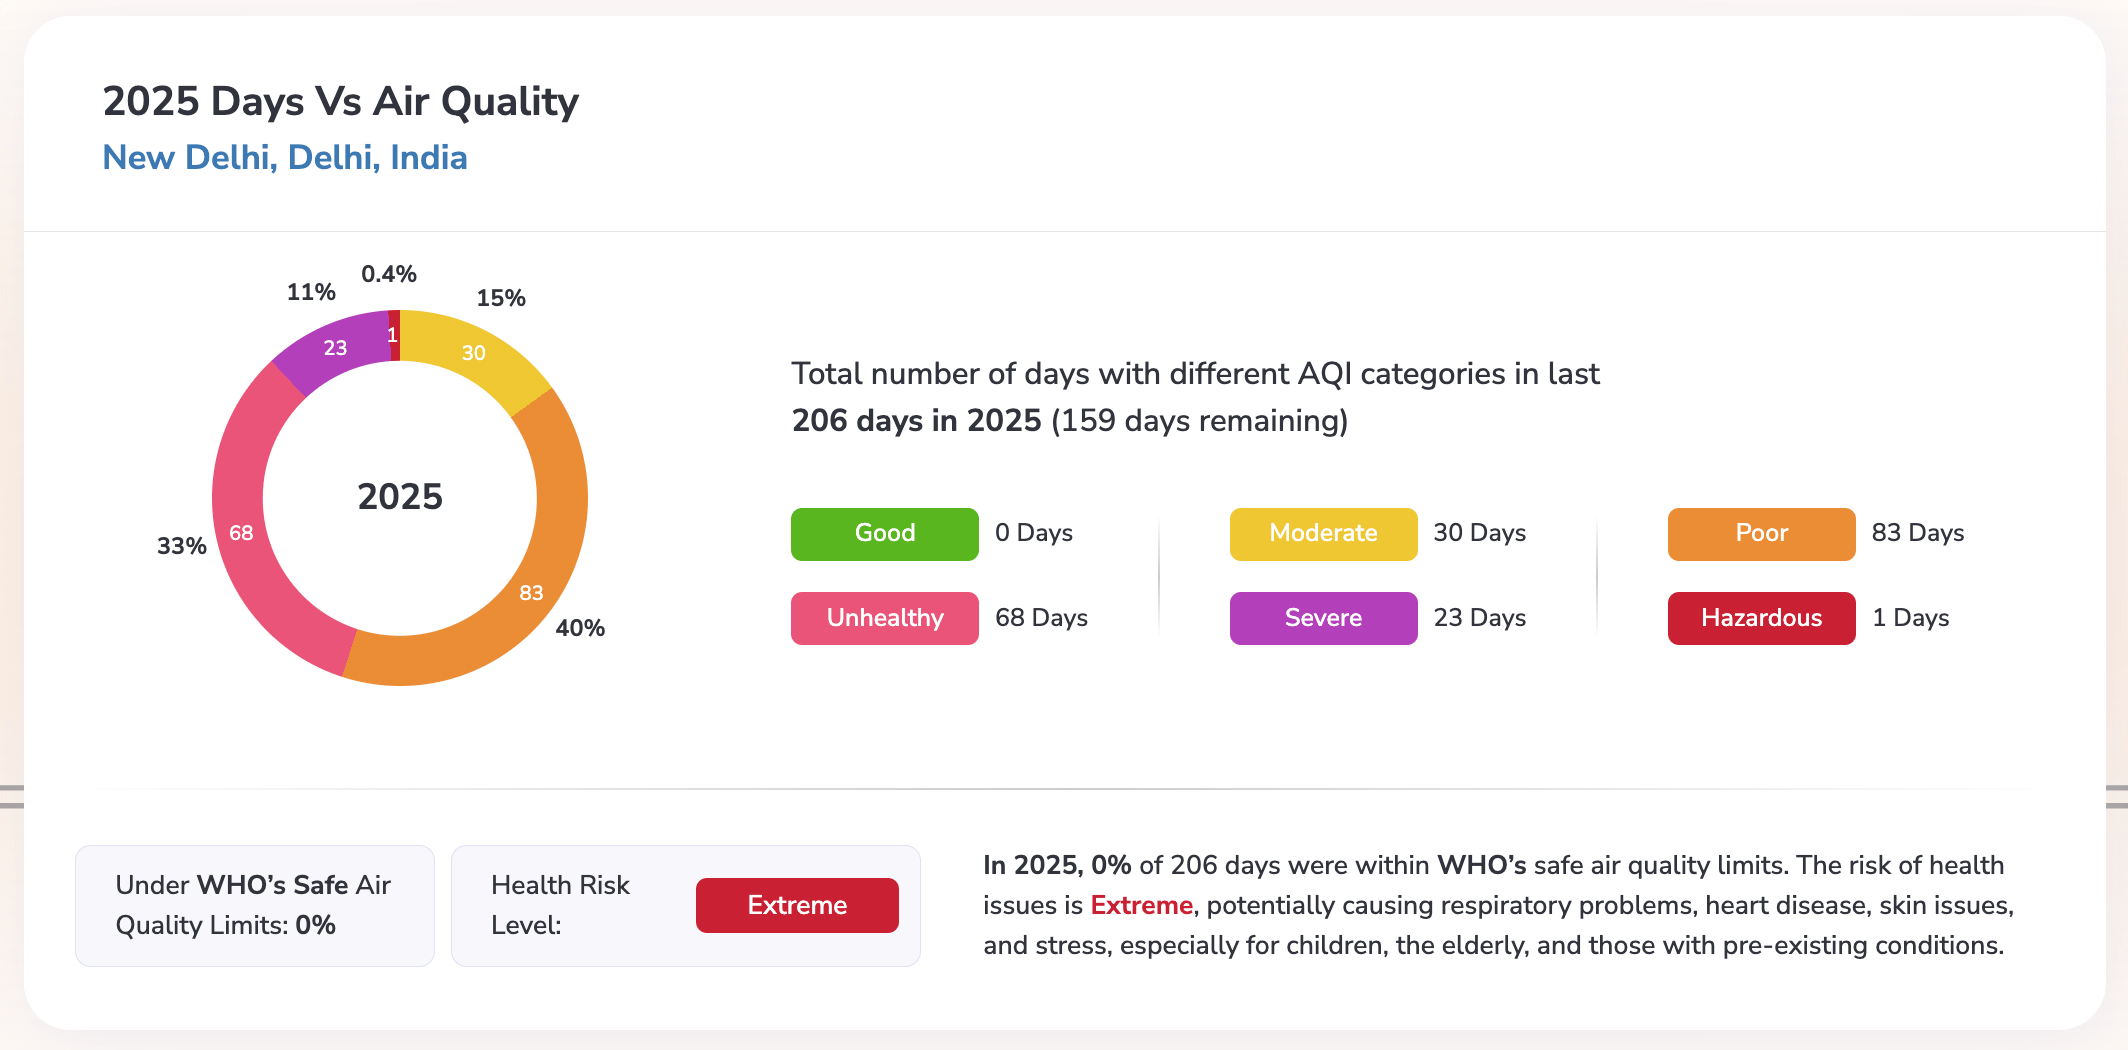
The 2025 data is not fully representative of the annual trend, as it covers only the first seven months. Still, it offers some noteworthy insights:
| Year | Good | Moderate | Poor | Unhealthy | Severe | Hazardous |
| 2025 | 0 | 30 | 83 | 68 | 23 | 1 |
Highlights from Jan–July 2025:
- No Good days were recorded, showing continued struggle with base-level pollution.
- Only 1 Hazardous day, suggesting a much cleaner winter and early year.
Note: Since Delhi’s worst pollution typically occurs from October to December, this incomplete dataset may give an overly optimistic view. A final assessment should wait until the year ends.
Overall Trends and Inferences
- Delhi’s cleanest air (moderate/Good) was seen during early monsoon months.
- Despite some fluctuations, Good air quality days remain almost non-existent.
- Severe pollution episodes continue to occur annually, indicating unresolved structural issues.
- 2025 so far shows promising trends, but a full-year assessment is pending.
Comparative Review (2020–2024)
Here, check the review of New Delhi annual air quality changes from 2020 to 2024:
- 2020 stood out for the highest number of Moderate days (100) — possibly due to reduced activity during COVID-19 lockdowns.
- 2021 showed a return to high Moderate and Severe day counts.
- 2022 was the worst overall year with maximum Unhealthy and Severe days.
- 2023 and 2024 saw some recovery, but Severe pollution levels remained high.
Looking Ahead
The comparative data from 2020 to 2024 reveal a city trapped between occasional progress and recurring setbacks. While temporary improvements occurred in selective years, Delhi still struggles with eliminating its worst air days. As a result, sustained policy measures, community efforts, and regional collaboration remain crucial to make a lasting impact.
Final Thoughts
Delhi’s journey toward cleaner air is far from over. Although the New Delhi annual air quality data indicates a few hopeful spikes in Satisfactory air days, the persistent dominance of Moderate to Severe days shows the long road ahead. Hence, comprehensive action—ranging from public transport reforms and industrial emission control to seasonal crop residue management—is essential for meaningful change.
Future reports will assess if recent measures can finally tip the balance in favour of cleaner air across all months and seasons. Until then, the battle for breathable air in Delhi continues.