24 hrs avg AQI
PM2.5 2.3X
The current PM2.5 concentration in Chandigarh is 2.3 times above the recommended limit given by the WHO 24 hrs air quality guidelines value.
| LOCATIONS | Status | AQI-US | AQI-IN | PM2.5 | PM10 | Temp | Humid |
|---|---|---|---|---|---|---|---|
| Sector 25 | POOR | 152 | 107 | 57 | 111 | 27 | 29 |
| Sector 6 Panchkula | POOR | 129 | 101 | 47 | 102 | 28 | 25 |
| New Dayal Bagh | MODERATE | 61 | 53 | 17 | 53 | 28 | 17 |
| Sector 33 | MODERATE | 63 | 67 | 18 | 67 | 27 | 18 |
| Sector 8C | MODERATE | 84 | 78 | 28 | 78 | 27 | 18 |
| Daria | POOR | 122 | 93 | 44 | 93 | 28 | 19 |
| Sector 21 B | MODERATE | 66 | 68 | 19 | 68 | 27 | 18 |
| Sector 17 | POOR | 134 | 97 | 49 | 97 | 27 | 18 |
| Sector 22 | MODERATE | 64 | 82 | 18 | 82 | 30 | 23 |
| HIMUDA Complex Phase 1 | MODERATE | 90 | 123 | 17 | 134 | 28 | 25 |
| NASA AQCS 176 | POOR | 160 | 140 | 72 | 130 | 29 | 22 |
Local Time
Wind speed
33 km/h
UV Index
16
Pressure
800 mb
Wear Mask
Stay Indoor
Windows
Use Purifier
Family
AQI
AQI
AQI
AQI
AQI
AQI
AQI
Chandigarh
24 hrs avg AQI
Quick answers to some commonly asked questions about the air pollution of Chandigarh.
The real-time air quality in Chandigarh is 92 (POOR) AQI now. This was last updated 59 seconds ago .
The current concentration of PM2.5 in Chandigarh is 35 (µg/m³). The World Health Organisation (WHO) recommends 15 µg/m³ as the threshold concentration of PM2.5 for 24 hrs mean. Currently, the concentration is 1.40 times the recommended limit.
Generally, the air quality at Chandigarh starts deteriorating in late October. The winters are the worst-hit season in terms of air pollution.
You should wear a good N95 mask when you go outdoor in Chandigarh until the AQI is improving upto moderate range.
Office going people should avoid personal vehicles and use public transportations or carpooling.
(i) The primary causes of outdoor air pollution are solid, liquid particles called aerosols & gase from vehicles emissions, construction activities, factories, burning stubble & fossil fuels and wildfire, etc.
(ii) Main causes of indoor air pollution are harmful gases from cooking fuels (such as wood, crop wastes, charcoal, coal and dung), damp, mould smoke, chemicals from cleaning materials, etc.
Indoor air pollution in Chandigarh is as dangerous as outdoor pollution, because the air pollutants come inside the houses or buildings through doors, windows and ventilation.
In Chandigarh , you must use an air purifier or fresh air machine at home or office indoor and close all the doors, windows and ventilations when the outdoor air quality index (aqi) in Chandigarh is very high. Proper ventilation is highly recommended only when outdoor air quality is improving and moderate AQI range.
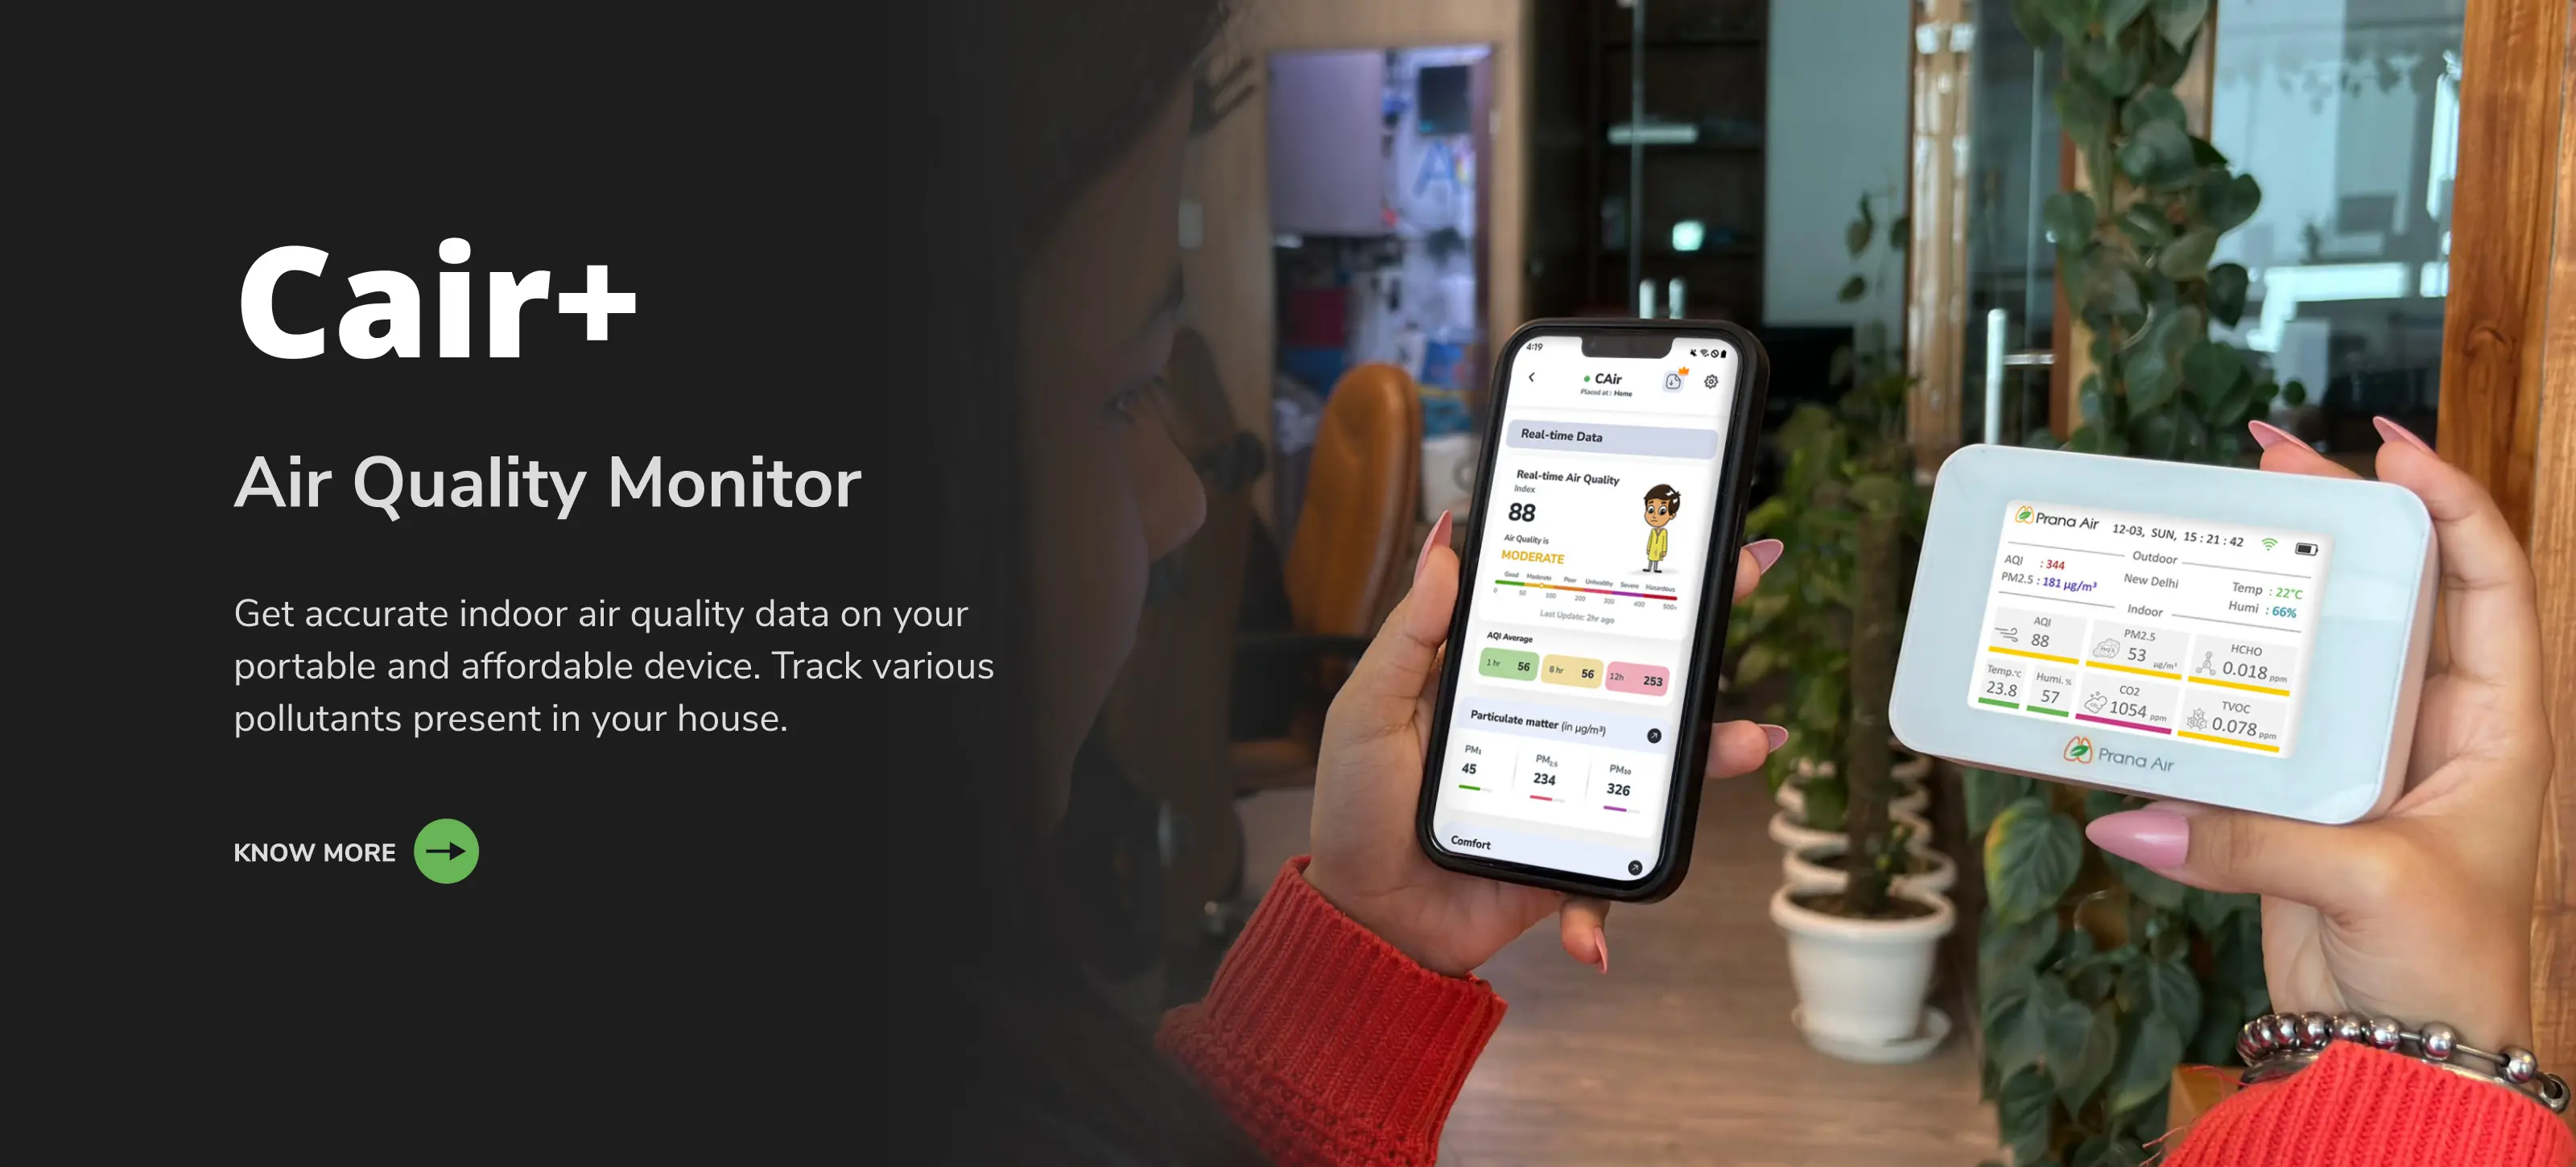
Find out Prana Air's air quality monitors & solutions to fight air pollution in your city.

Know what the quality your are breathing with Prana Air monitors (low-cost & accurate).

Analyze the quality of air anywhere with accurate & compact gas & pm sensors.

Purify your indoor air & make it free from air pollution and toxins with our air purifier.

Make sure you breathe fresh inside your car with a highly efficient car cabin filter.

Breathe pure air with Prana Air motorized masks of multi-layer hepa filter purification.
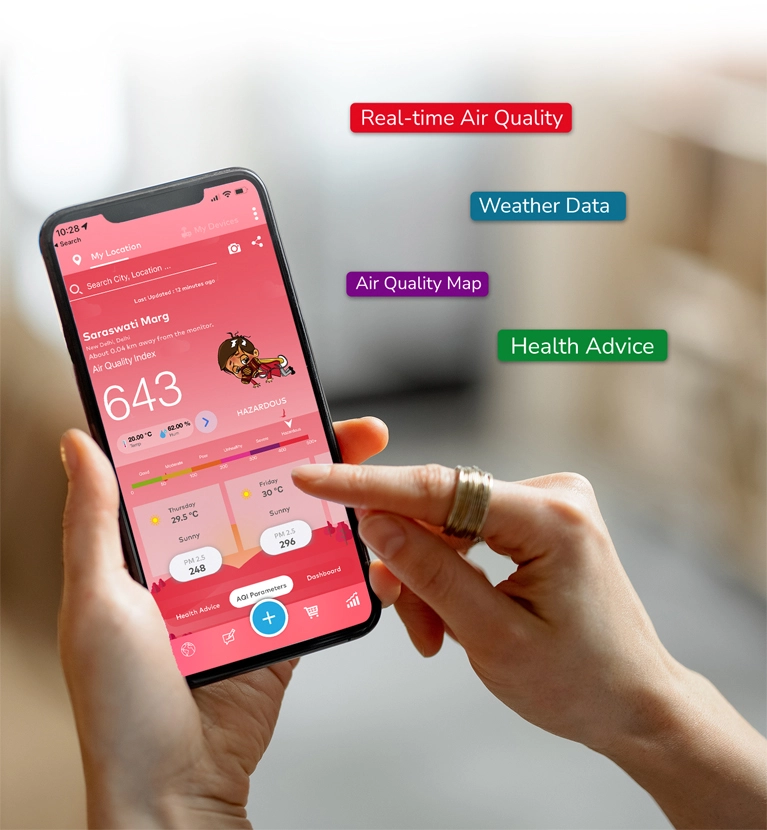
Know what you breathe and the quality of air in your city and nearby locations. Real-time AQI, map, weather & fire data, health advice with insightful & anlytical dasbboards.