ライブ

New Delhi空気質指数 (AQI) | 大気汚染

IndiaのリアルタイムPM2.5、PM10大気汚染レベル

最終更新: 2024-12-03 11:28:59 AM

location image
ライブAQI
293
空気質は
Unhealthy
pm10 :  244 µg/m³
PM2.5 :  125 µg/m³
Good
050
Moderate
100
Poor
200
Unhealthy
300
Severe
400
Hazardous
500+
unhealthy aqi level in New Delhi
overcast

21 °C

Overcast
Humidity
Humidity53 %

Wind Speed
Wind Speed8 km/h

UV Index
UV Index3
最終更新: 2024-12-03 11:28:59 AM


Map

New Delhi

主要な大気汚染物質

New Delhi

AQIグラフ

歴史的空気質データ

New Delhi

New Delhi
+
比較に追加
Live

Winter 2024

Air Pollution RankVisit Winter Pollution Ranking Page

aqi-hazardous.pngaqi-poor.pngaqi-severe.png

New Delhiの場所

リアルタイムの空気汚染レベル

Location
Status
AQI
PM2.5(µg/m³)
PM10(µg/m³)
Temp.(°C)
Humi.(%)
Aerocity
Severe
334
165
255
21
51
Alipur
Severe
329
158
262
21
53
Anand Lok
Unhealthy
288
117
263
21
49
Anand Parbat
Unhealthy
278
113
208
23
42
Anand Vihar
Unhealthy
284
115
247
21
51
Ashok Vihar Phase 1
Unhealthy
300
120
253
21
49
Ashok Vihar Phase 2
Severe
301
121
253
21
49
Ashok Vihar Phase 3
Unhealthy
250
105
241
21
51
Ashok Vihar Phase 4
Unhealthy
276
113
250
21
51
Bali Nagar
Severe
302
122
263
21
53
Bawana Industrial Area
Unhealthy
279
114
204
21
51
Bhalswa Landfill
Unhealthy
291
117
285
21
50
Chanakya Puri
Unhealthy
287
116
242
21
50
Civil Lines
Unhealthy
290
117
253
21
51
Connaught Place
Unhealthy
300
121
240
21
51
Darya Ganj
Severe
302
122
239
21
50
Deepali
Severe
323
150
255
21
51
Defence Colony
Severe
303
123
245
21
51
Delhi Cantt
Severe
322
149
233
21
44
Delhi Gymkhana Club
Unhealthy
290
117
237
21
50
Delhi Institute Of Tool Engineering
Severe
321
147
238
21
50
Diplomatic Enclave
Unhealthy
300
120
240
21
49
Dite Okhla
Unhealthy
255
106
261
21
53
Dwarka
Poor
196
89
175
22
41
Dwarka Sector 10
Severe
321
147
211
21
48
Dwarka Sector 11
Poor
196
89
175
22
41
Dwarka Sector 12
Severe
316
141
195
21
46
Dwarka Sector 18B
Unhealthy
247
104
208
21
48
Dwarka Sector 23
Unhealthy
253
106
204
21
50
Dwarka Sector 3
Unhealthy
299
120
197
21
46
Dwarka Sector 5
Severe
311
134
245
21
46
Dwarka Sector 6
Severe
326
154
244
21
50
Dwarka Sector 7
Severe
315
139
245
21
50
East Patel Nagar
Severe
306
127
249
21
50
Embassy of Belgium
Unhealthy
289
117
243
21
50
Ghazipur
Unhealthy
261
108
240
21
55
Golf Links
Unhealthy
281
114
244
21
50
Govind Puri
Unhealthy
269
111
258
21
50
Greater Kailash
Unhealthy
291
117
258
21
50
Greater Kailash II
Severe
318
143
253
21
51
Green Park
Unhealthy
266
110
265
21
50
GTB Nagar
Unhealthy
272
111
244
21
55
Gulmohar Park Block B
Unhealthy
276
113
265
21
49
Hari Nagar
Severe
302
122
245
21
49
Hastsal
Unhealthy
285
115
243
21
51
Hauz Khas
Unhealthy
281
114
269
21
51
Hazrat Nizamuddin
Unhealthy
284
115
260
21
49
HT House
Unhealthy
300
121
240
21
51
I P Extension
Unhealthy
262
109
235
21
54
Ihbas
Unhealthy
287
116
250
21
56
Inderlok
Severe
302
123
252
21
50
ITI Jahangirpuri
Severe
305
126
245
23
40
ITI Shahdra
Unhealthy
263
109
239
21
56
Janakpuri
Severe
311
134
246
21
50
Jangpura
Unhealthy
277
113
265
21
51
Jawaharlal Nehru Stadium
Unhealthy
269
111
244
21
52
Kalkaji
Unhealthy
293
118
255
21
50
Karol Bagh
Unhealthy
297
119
247
21
50
Kashmiri Gate ISBT
Severe
303
123
274
21
53
Katwaria Sarai
Unhealthy
300
121
262
21
51
Kohat Enclave
Severe
323
150
258
21
50
Lajpat Nagar
Unhealthy
300
120
245
21
50
LIC Colony
Severe
302
122
263
21
50
Loni
Unhealthy
236
101
214
21
57
Major Dhyan Chand National Stadium
Unhealthy
284
115
244
21
53
Malviya Nagar
Unhealthy
299
120
255
21
50
Mandir Marg
Severe
301
121
232
21
50
Mayur Vihar
Unhealthy
213
94
220
21
55
Model Town
Severe
317
142
258
21
52
Mori Gate
Unhealthy
261
108
245
21
51
Mother Dairy Plant
Severe
305
126
229
21
54
Mukherjee Nagar
Severe
319
145
245
21
51
Mundka
Unhealthy
249
105
220
21
51
Mustafabad
Severe
314
139
232
21
52
Najafgarh
Unhealthy
230
99
170
21
51
Naraina Industrial Area
Unhealthy
287
116
232
21
51
Narela
Unhealthy
297
119
286
20
55
National Institute Of Malaria Research
Severe
314
139
247
21
52
New Delhi Us Embassy
Unhealthy
266
110
242
21
53
New Friends Colony
Unhealthy
293
118
242
21
51
New Sarup Nagar
Unhealthy
284
115
273
21
52
Niti Marg
Unhealthy
283
115
239
21
50
Okhla Phase II
Unhealthy
265
110
255
21
51
Panchsheel Vihar
Unhealthy
290
117
267
21
51
Paschim Vihar
Unhealthy
284
115
278
21
51
PGDAV College
Severe
301
121
245
21
51
Pooth Khurd
Unhealthy
283
115
206
21
53
Prashant Vihar
Severe
323
150
254
21
52
Punjabi Bagh
Severe
302
122
263
21
54
Punjabi Bagh Block D
Unhealthy
285
115
268
21
52
Pusa
Severe
305
126
235
23
41
Radhey Mohan Drive
Severe
347
181
244
21
47
Radhey Mohan Drive 2
Severe
355
191
245
21
47
Raghubir Nagar
Severe
302
122
253
21
51
Rajinder Nagar
Unhealthy
292
118
228
23
45
Ramesh Park
Unhealthy
276
113
212
21
52
RK Puram
Severe
301
122
255
21
52
RK Puram North Block
Severe
301
122
254
21
51
Rohini Sector 10
Severe
302
123
267
21
50
Rohini Sector 15
Severe
323
150
254
21
52
Rohini Sector 24
Severe
319
144
222
21
51
Rohini Sector 30
Severe
305
126
223
21
52
Rohini Sector 5
Severe
323
150
254
21
51
Rohini Sector 7
Severe
323
150
255
21
52
Safdarjung Enclave
Unhealthy
278
113
248
21
50
Sainik Farms
Unhealthy
300
121
258
21
51
Saket
Severe
316
140
259
21
51
Saket Block C
Unhealthy
299
120
260
21
50
Saraswati Marg
Severe
323
150
245
21
51
Satyawati College
Unhealthy
273
112
245
21
51
Shahdara
Unhealthy
261
108
257
21
54
Shaheed Sukhdev College Of Business Studies
Severe
302
123
272
21
51
Shalimar Bagh
Severe
317
143
255
21
51
Shastri Nagar
Unhealthy
300
120
243
21
51
Sheikh Sarai
Unhealthy
290
117
267
21
51
Siddhartha Enclave
Severe
301
121
273
21
52
Sir Edmund Hillary Marg
Unhealthy
289
117
243
21
50
Sonia Vihar Water Treatment Plant Djb
Severe
359
197
235
21
55
Sri Auribindo Margta
Severe
318
143
250
21
52
Sukhdev Vihar
Unhealthy
267
110
258
21
52
Sukhdev Vihar DDA Flats
Severe
328
156
247
21
54
Surya Nagar
Unhealthy
243
103
246
21
55
Uttam Nagar
Severe
315
140
240
21
51
Vasant Kunj
Severe
354
190
225
23
43
Vasant Kunj Sector C
Severe
357
195
233
21
45
Vasant Vihar
Unhealthy
299
120
251
21
51
Vasundhara Enclave
Poor
194
88
196
21
56
Wazirpur
Severe
317
143
250
21
52

Indiaのメトロシティ

空気質指数

住んでいる場所の健康アドバイス

New Delhi

4.8Cigarettes per day

Cigarette
Weekly 33.6 タバコ
Monthly 144.0 タバコ

この場所の空気を吸うことは、1日あたり4.8本のタバコを吸うのと同じくらい有害です。

Source:

Berkeley Earth


現在のAQIのためのソリューション

  • 空気清浄機
    空気清浄機オン
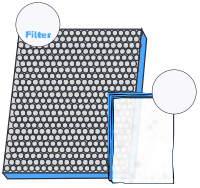
  • 車のフィルター
    車のフィルター必須
  • N95マスク
    N95マスク必須
  • 屋内に留まる
    屋内に留まる必須


新鮮な空気を楽しむためには空気清浄機をオンにする必要があります。

空気清浄機を入手

健康問題を防ぐ:リスクを理解する

New Delhi

  • asthma due to air pollution in New Delhi喘息
  • heart due to air pollution in New Delhi心臓の問題
  • allergy due to air pollution in New Delhiアレルギー
  • sinus due to air pollution in New Delhi副鼻腔
  • flu due to air pollution in New Delhi風邪/インフルエンザ
  • copd due to air pollution in New Delhi慢性(COPD)
asthma due to air pollution in New Delhi

高の喘息の可能性

喘息

AQIがUnhealthy (200-500)のとき、喘息の症状のリスクは高です。

激しい喘鳴、重度の息切れ、顕著な胸の圧迫感、日常生活を妨げる可能性のある持続的な咳を含む重度の症状。

やるべきこと :

  • 外出を避け、汚染物質への曝露を減らすために窓を閉めておく.

  • 医療提供者の指示に従って処方された薬を服用する.

  • 特に寝室やリビングエリアで空気清浄機を使用して室内の空気を清浄に保つ。

やってはいけないこと :

  • 煙草を吸ったり、受動喫煙にさらされたりする.

  • 屋外で肉体的な運動をする。

最も汚染された都市 2024

India

国内のリアルタイムで最も空気が汚染された都市を分析します。

New DelhiのAQIデータ分析ソリューション

空気質データモニタリングプラットフォーム

モバイルアプリモバイルアプリ
スマートTVアプリスマートTVアプリ
ウェブダッシュボードウェブダッシュボード
APIAPI
ウィジェットウィジェット
aqi air quality app for New Delhi
モバイルアプリ

信頼できるデータで意思決定を強化

詳細なパラメータを含む地域のリアルタイムデータ.

詳細なパラメータを含む地域のリアルタイムデータ.


現在のAQIに基づいたパーソナライズされた健康アドバイス.

現在のAQIに基づいたパーソナライズされた健康アドバイス.


トレンドや状態を特定するための分析データ.

トレンドや状態を特定するための分析データ.


空気質デバイスを接続し、制御します。

空気質デバイスを接続し、制御します。


空気質に関するよくある質問

で New Delhi

空気質に関するよくある質問

New Delhi の現在の AQI レベルは何ですか?

New Delhi の現在のリアルタイム AQI レベルは 293 (Unhealthy) です。これは最終更新 3 minutes ago です。

過去24時間で New Delhi の最良の AQI レベルはいつですか?

過去24時間での最良の AQI レベルは 133 (Poor) で、5:13 PM, Dec 2, 2024 の時点です。

過去24時間で New Delhi の最悪の AQI レベルはいつですか?

過去24時間での最悪の AQI レベルは 309 (Severe) で、8:13 AM の時点です。

過去24時間における New Delhi の AQI レベルの現在の傾向は?

New Delhi の AQI レベルは、過去24時間で変動しています。最高 309 は 8:13 AM に、最低 133 は 5:13 PM, Dec 2, 2024 に記録されています。

New Delhiにおける現在のAQIレベルに基づく推奨される行動は何ですか?

現在のAQIレベルは全員にとって不健康です。屋外活動を制限し、室内で空気清浄機を使用することを検討してください。