Vinh Luong Air Quality Index (AQI) | Air Pollution
Real-time PM2.5, PM10 air pollution level in Nha Trang
Last Updated: 24 Sep 2025, 10:26am (Local Time)


26 °C
SunnyVinh Luong
Trending in Vietnam

Air Quality Monitoring for Logistics: Smarter Deliveries with Data
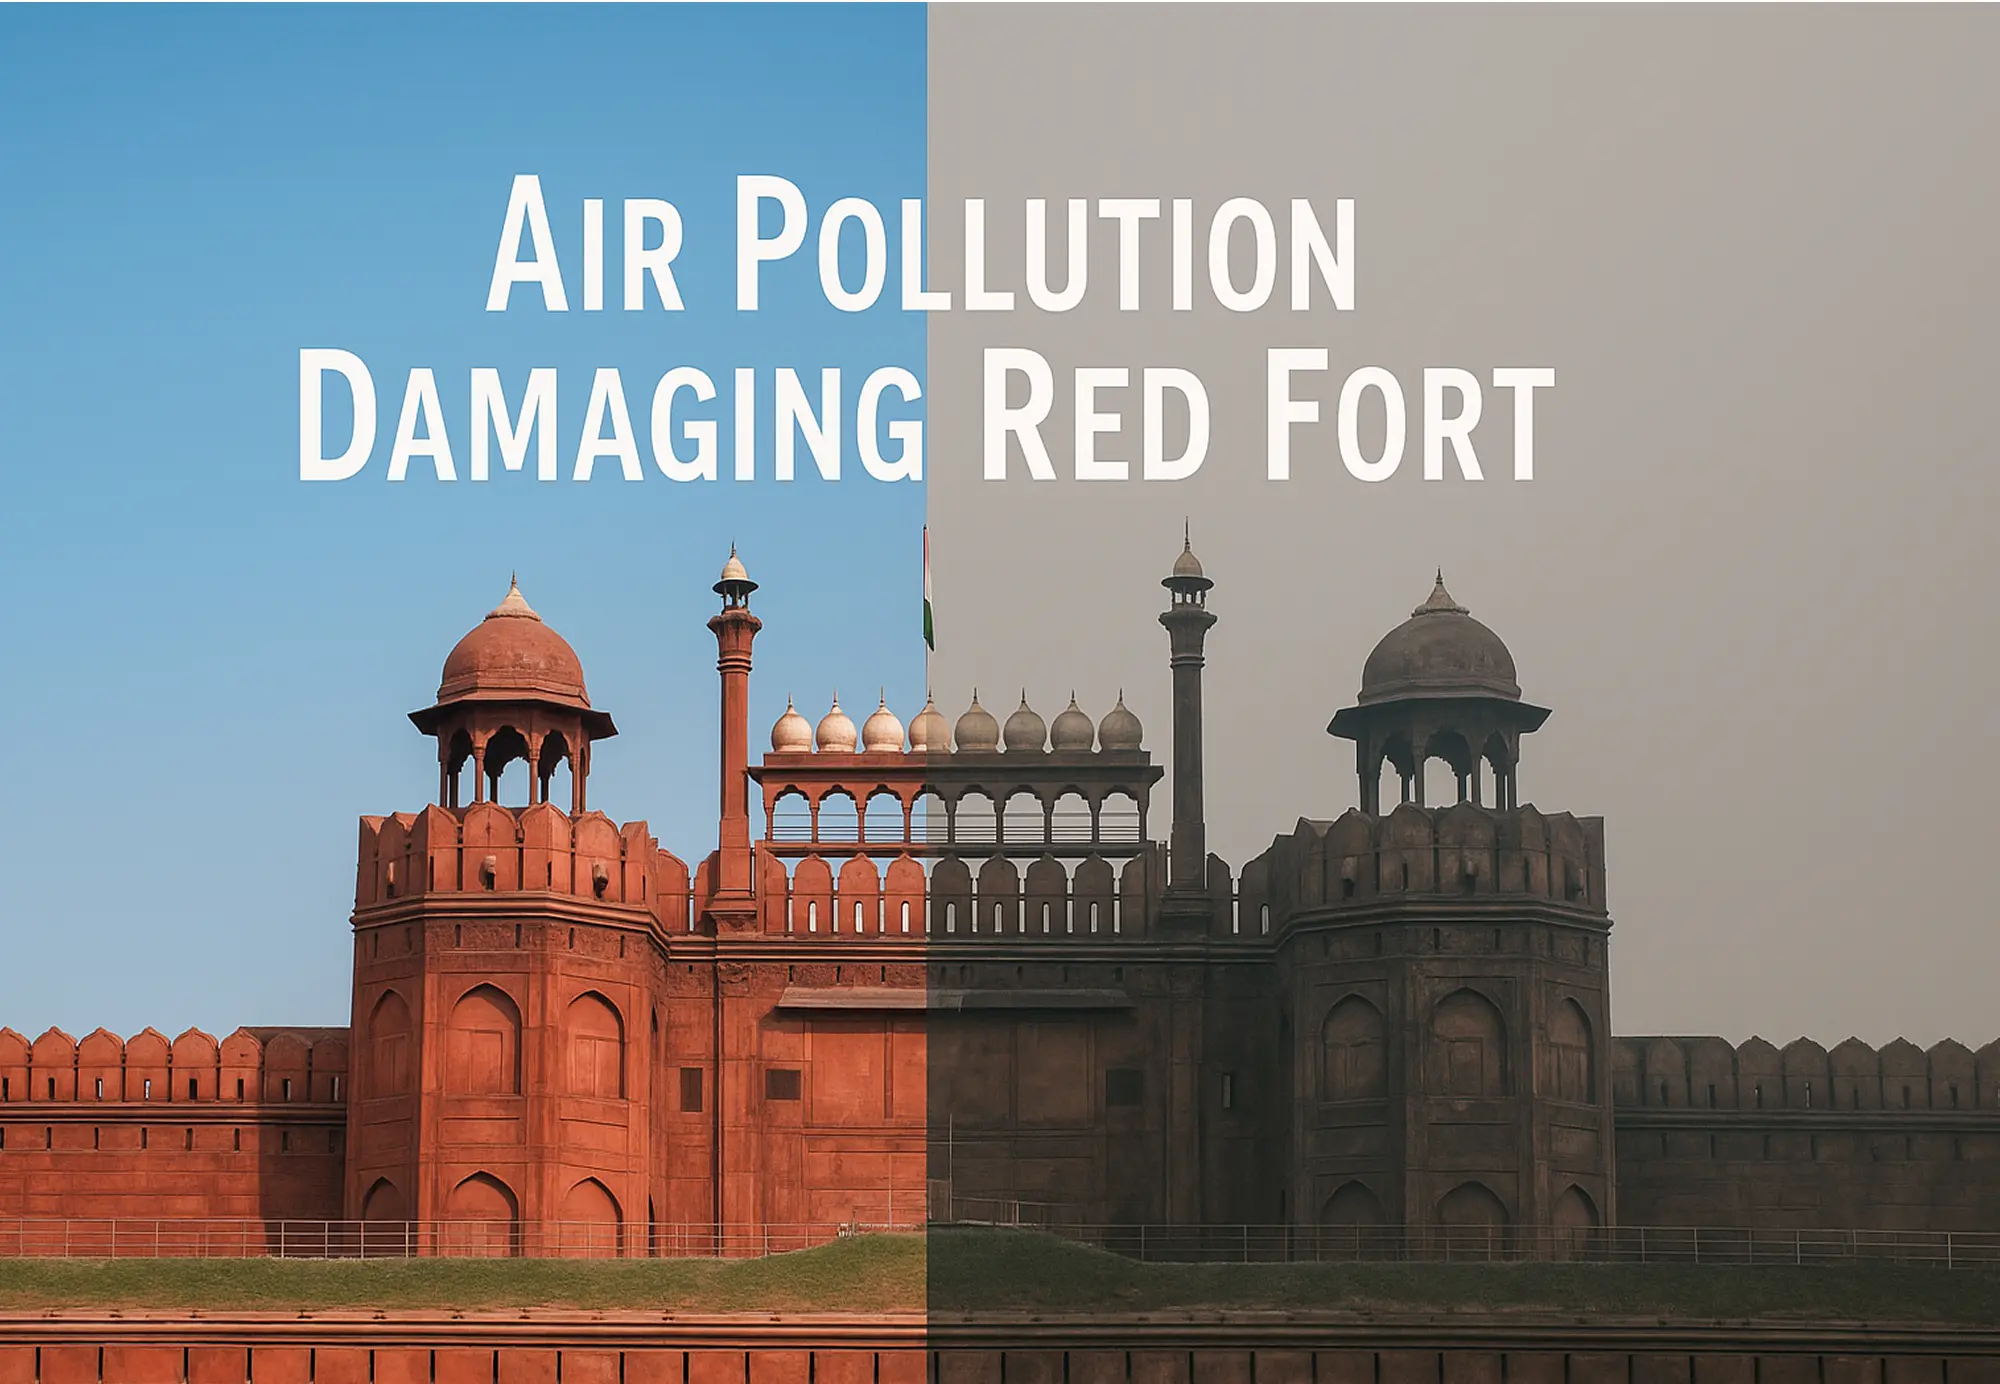
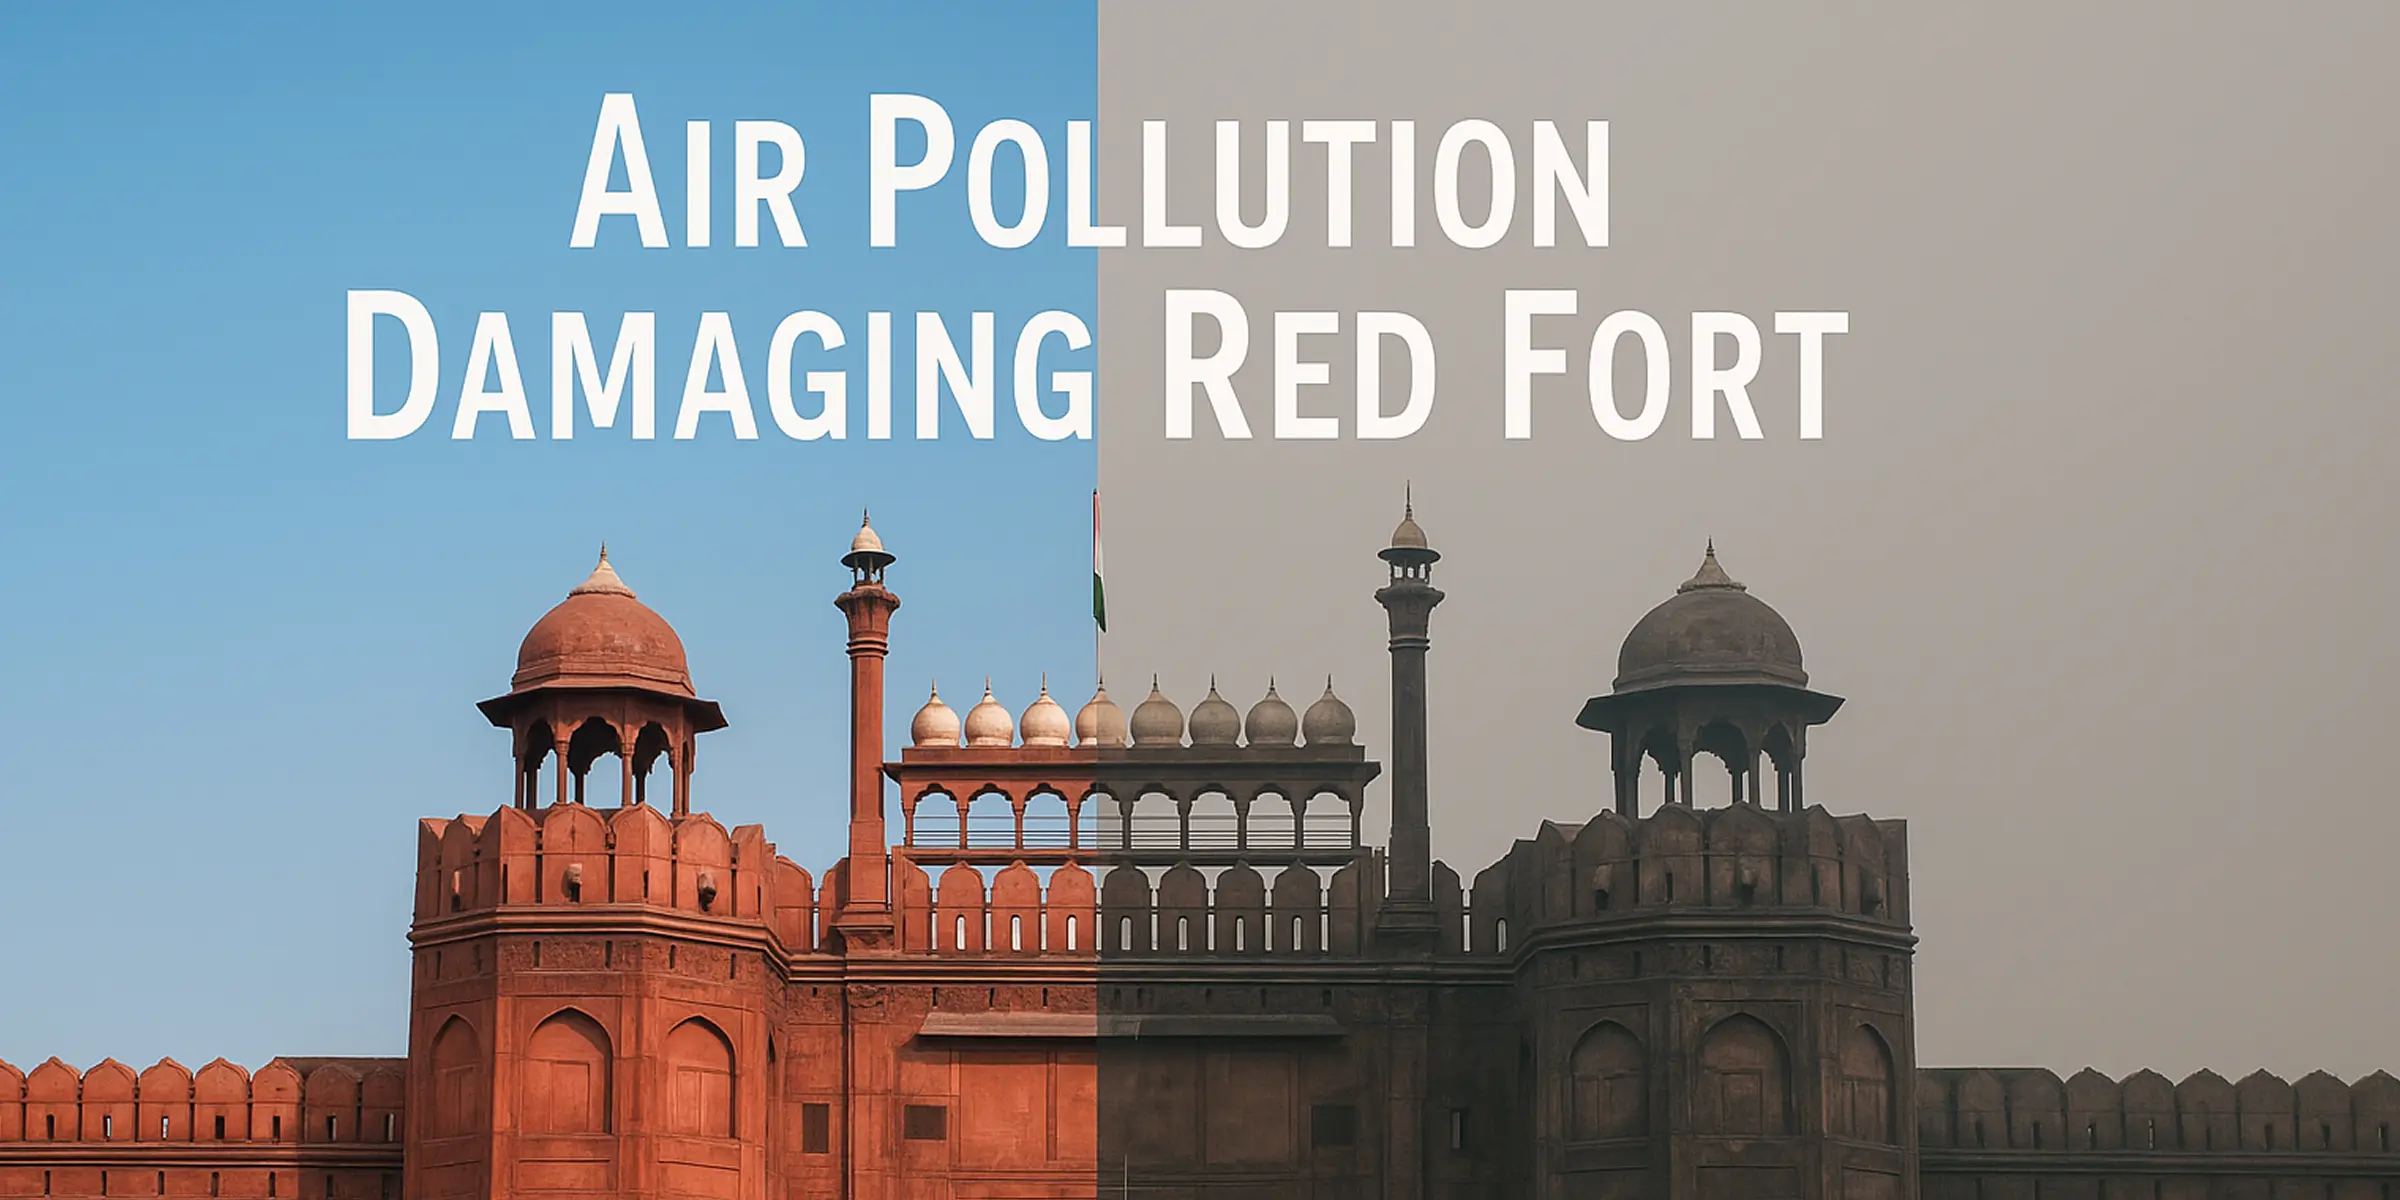
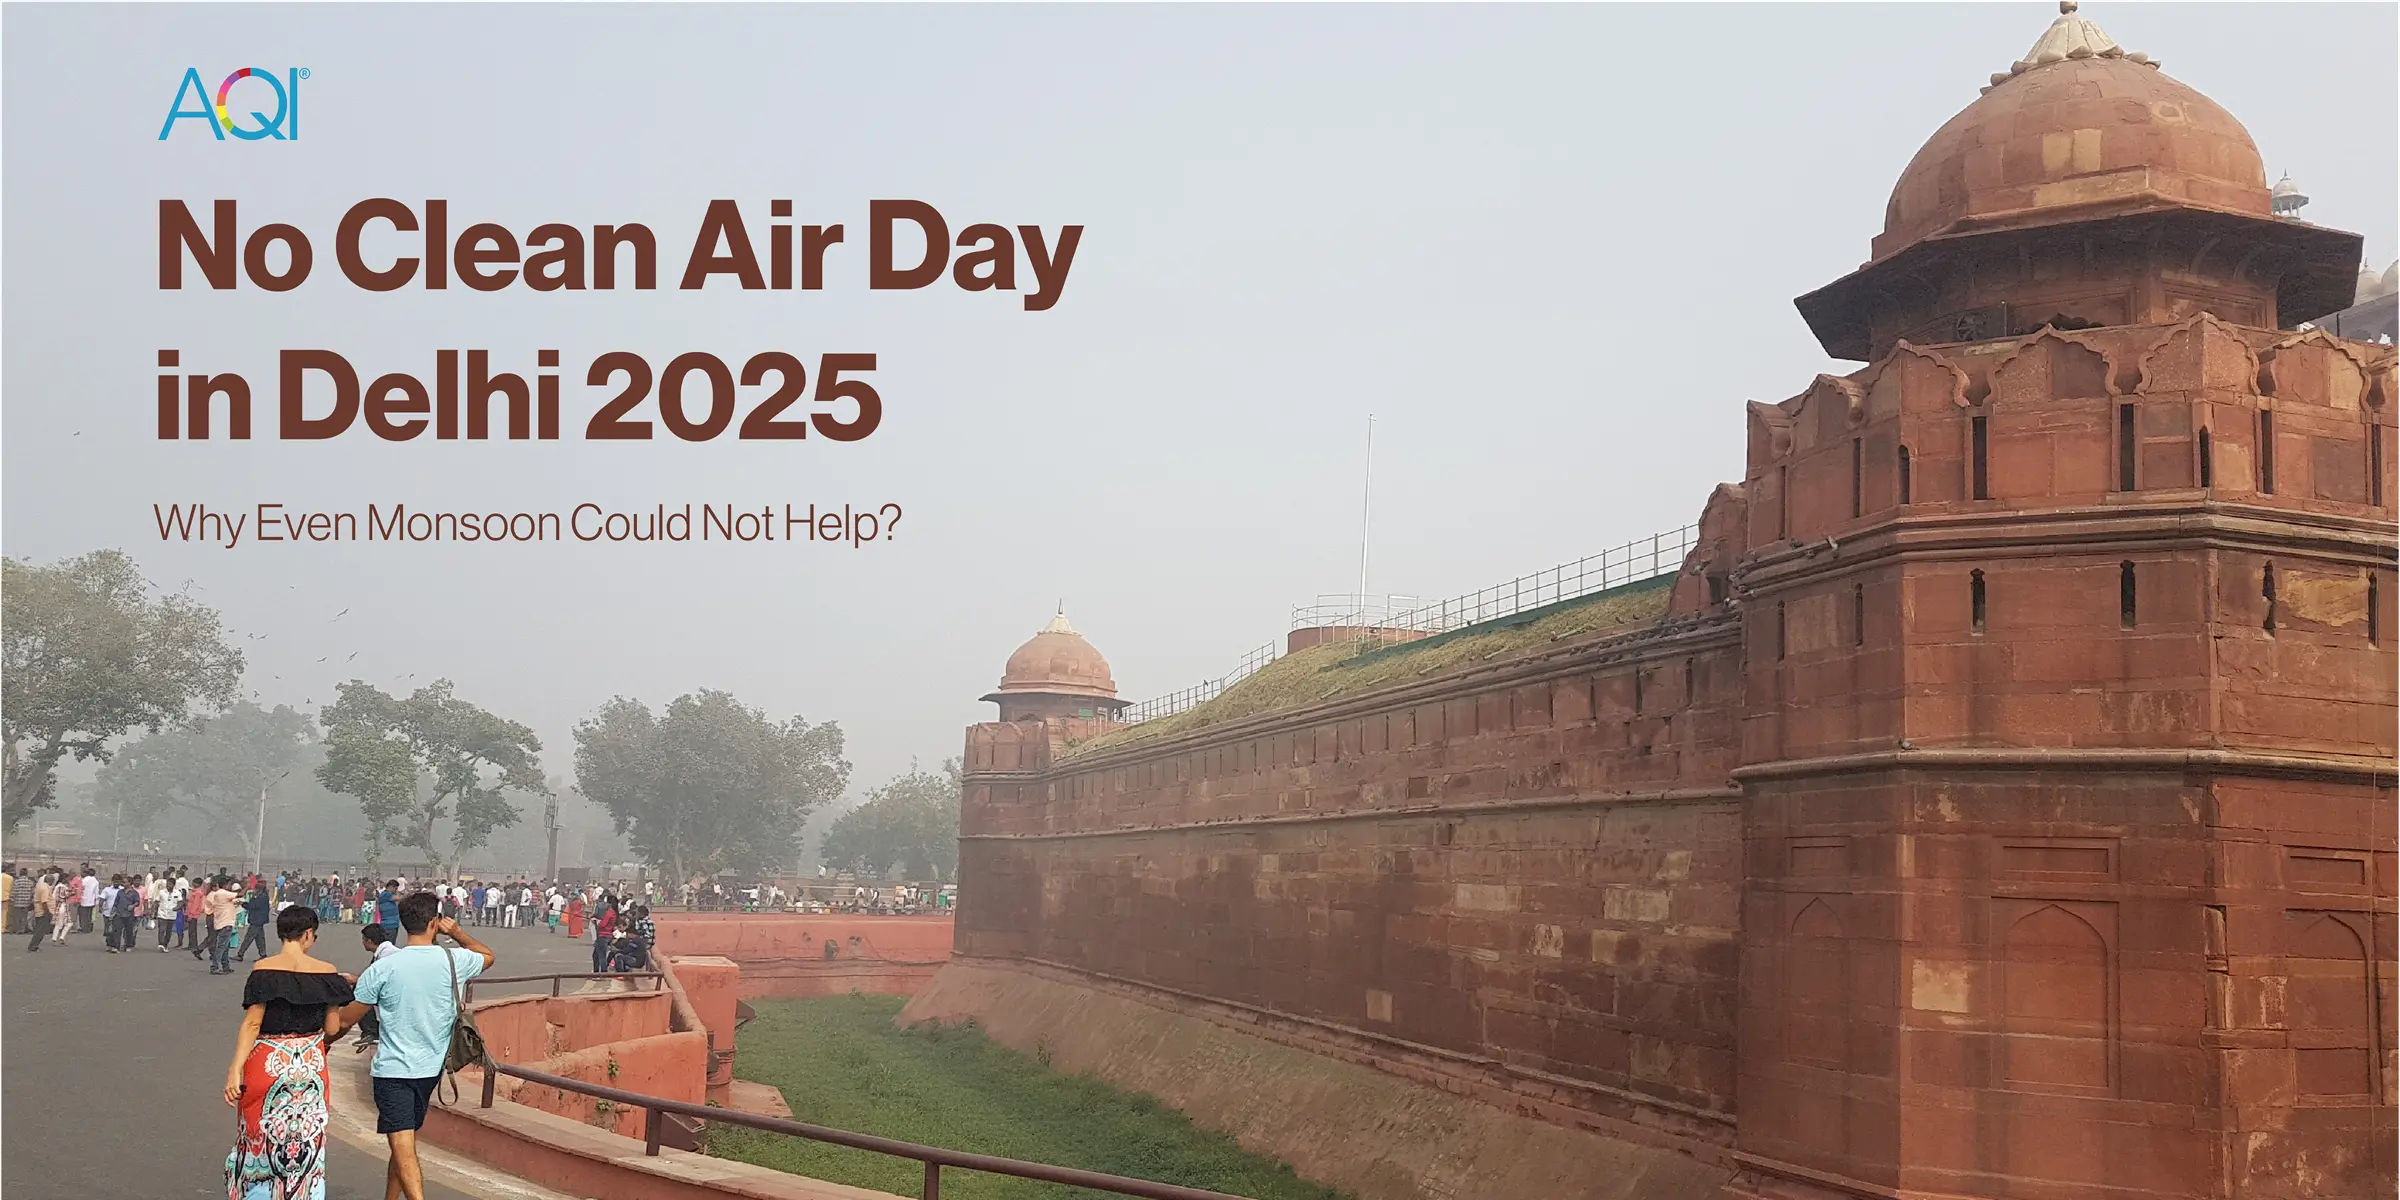
Red Fort in Delhi is Not Red Anymore! It is Turning Black: Air Pollution Damaging Red Fort
Air Quality in Hospitals: How Poor Indoor Air Pollution Affects Patients, Doctors, and Staff?
What’s the Connection Between Air Pollution and Blood Cancer?
Air Quality in Banks: Why Clean Air Matters for Health, Productivity, and Trust?
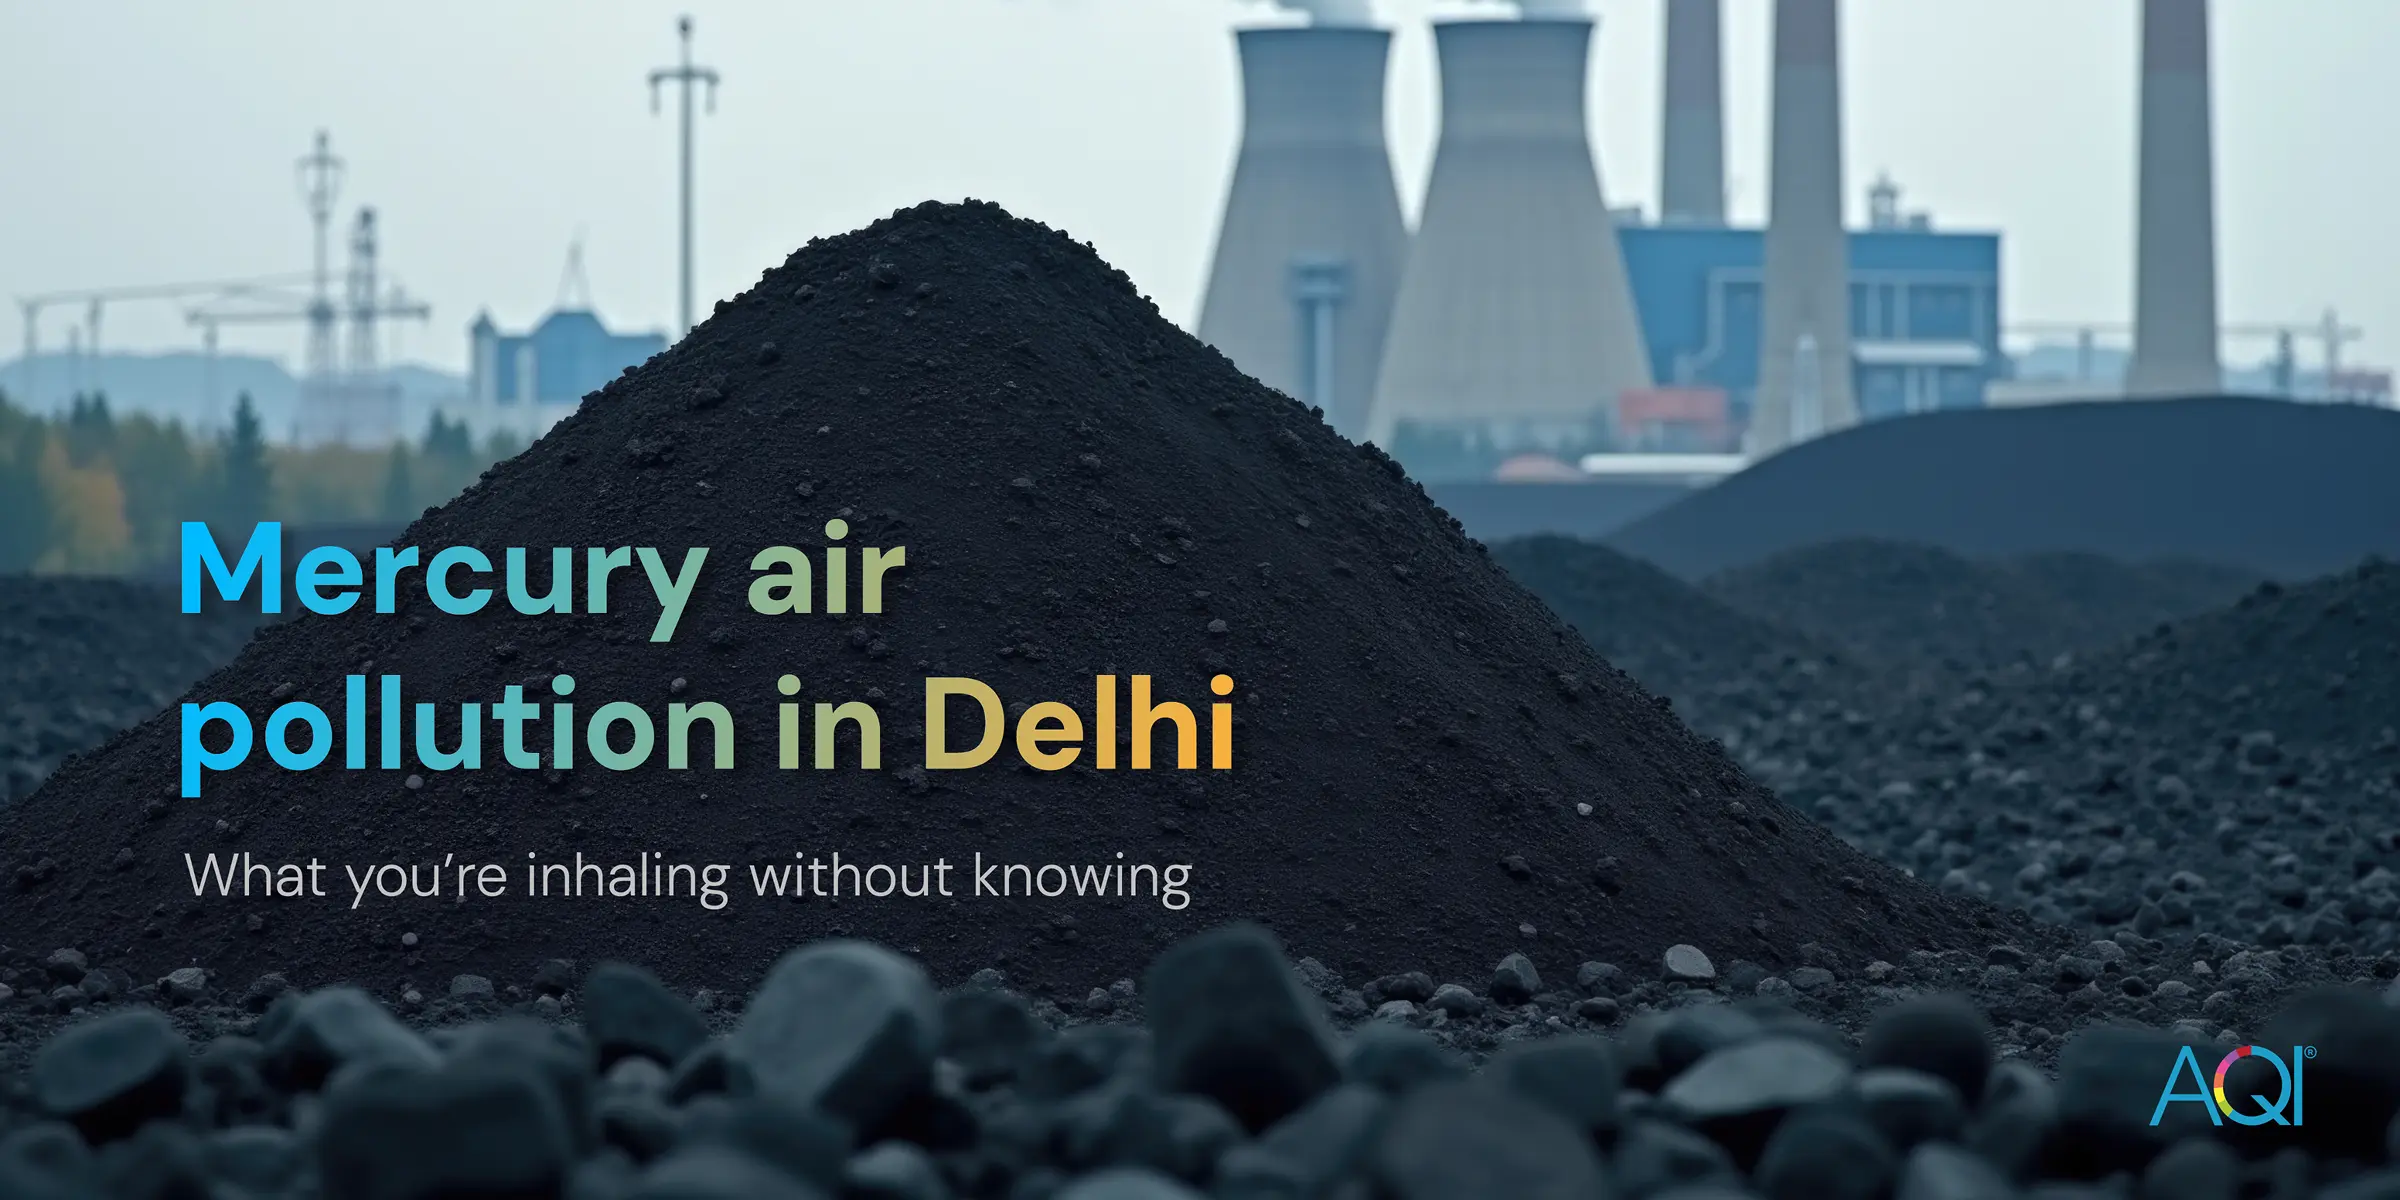
Mercury Air Pollution in Delhi: What You’re Inhaling Without Knowing
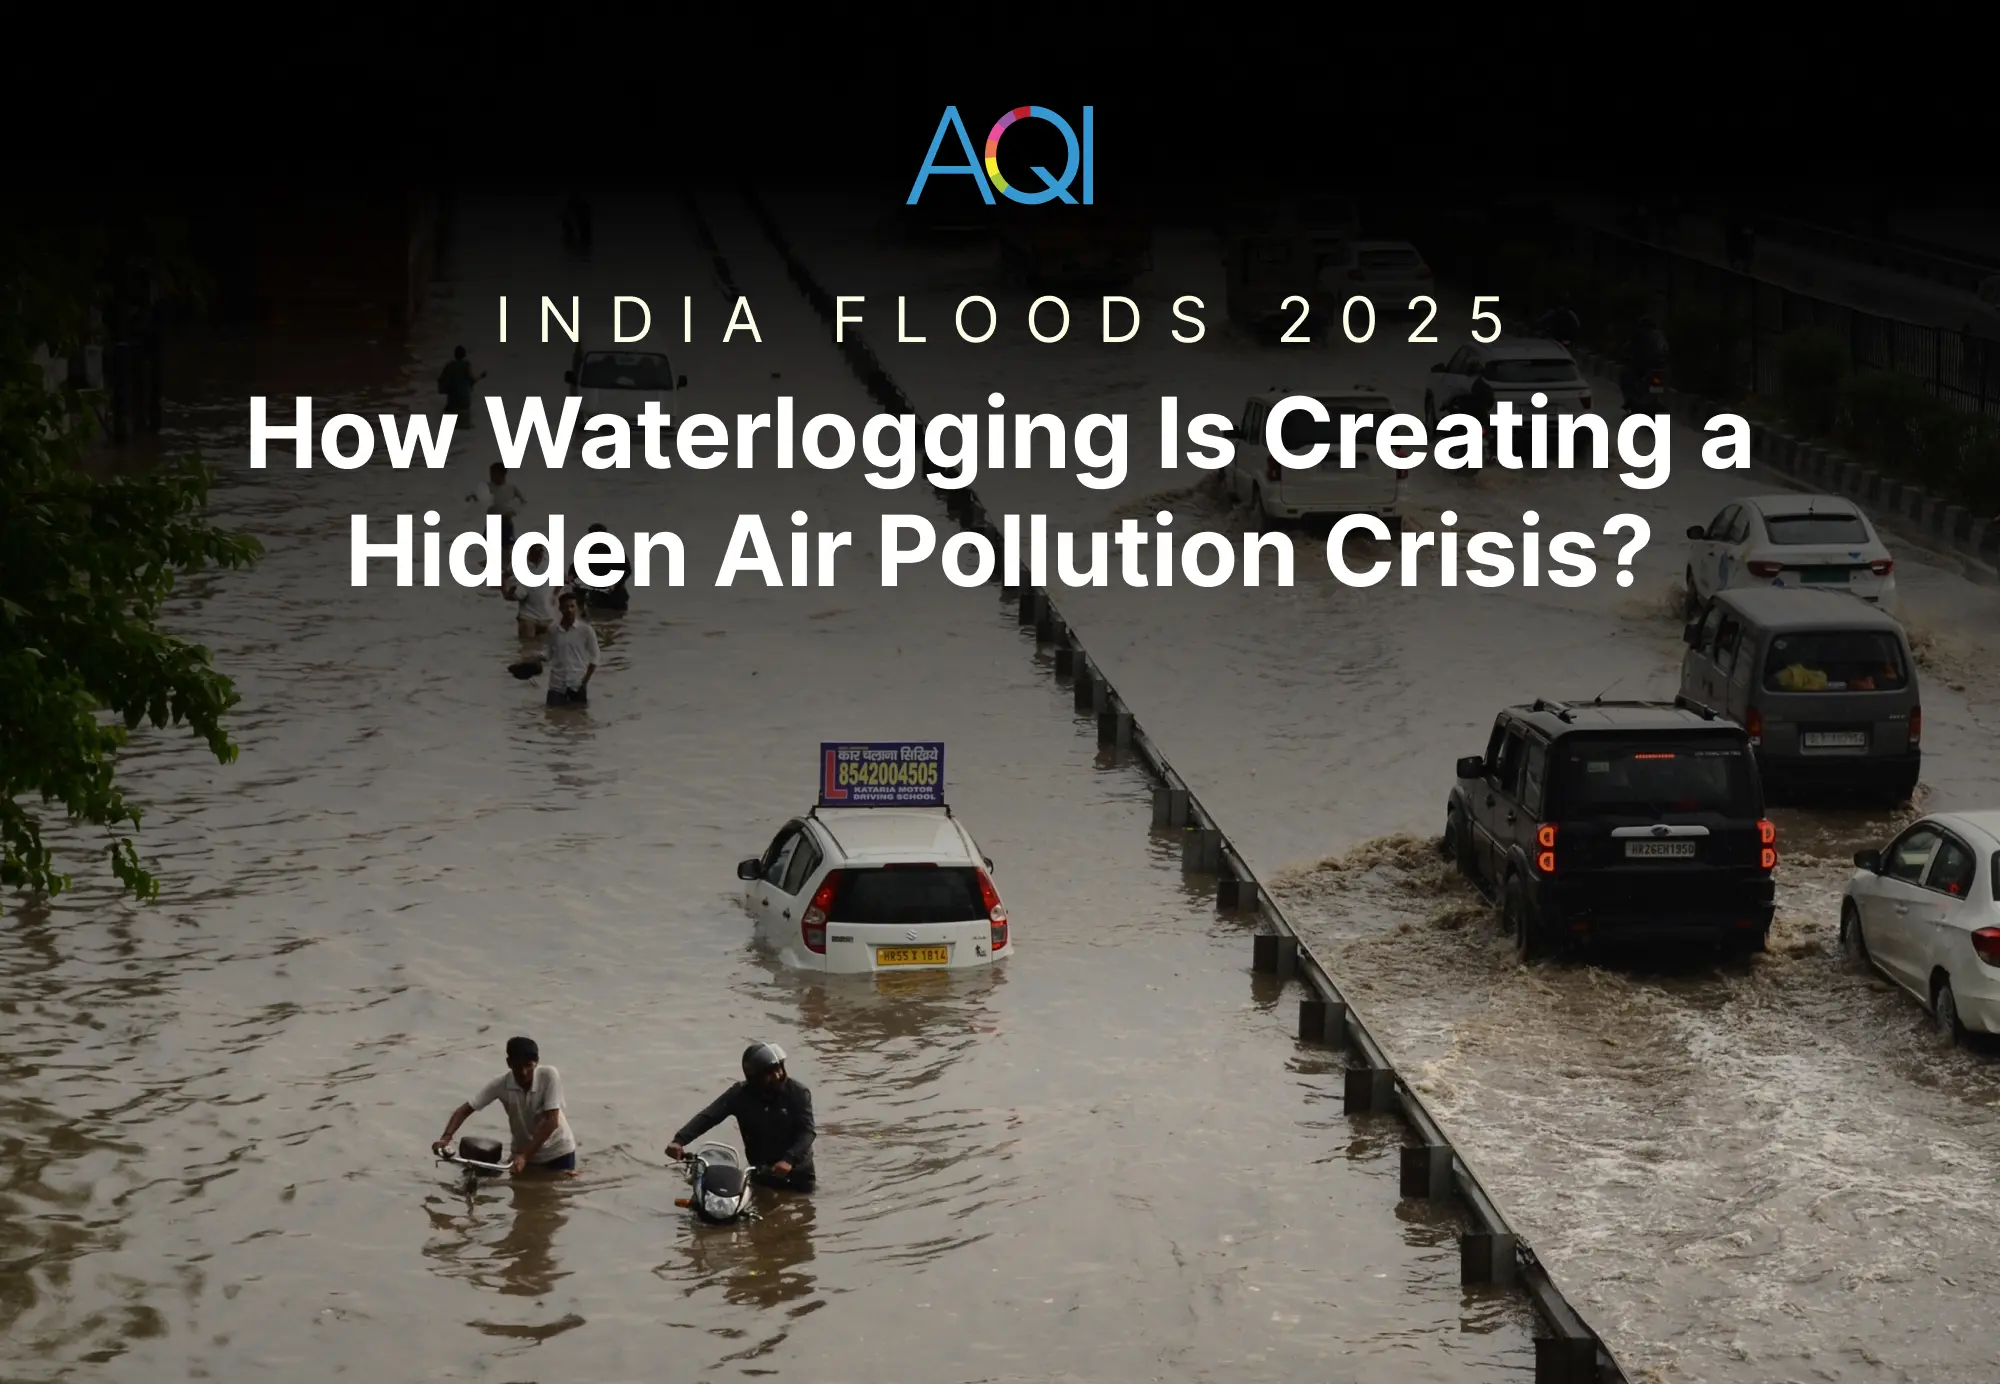
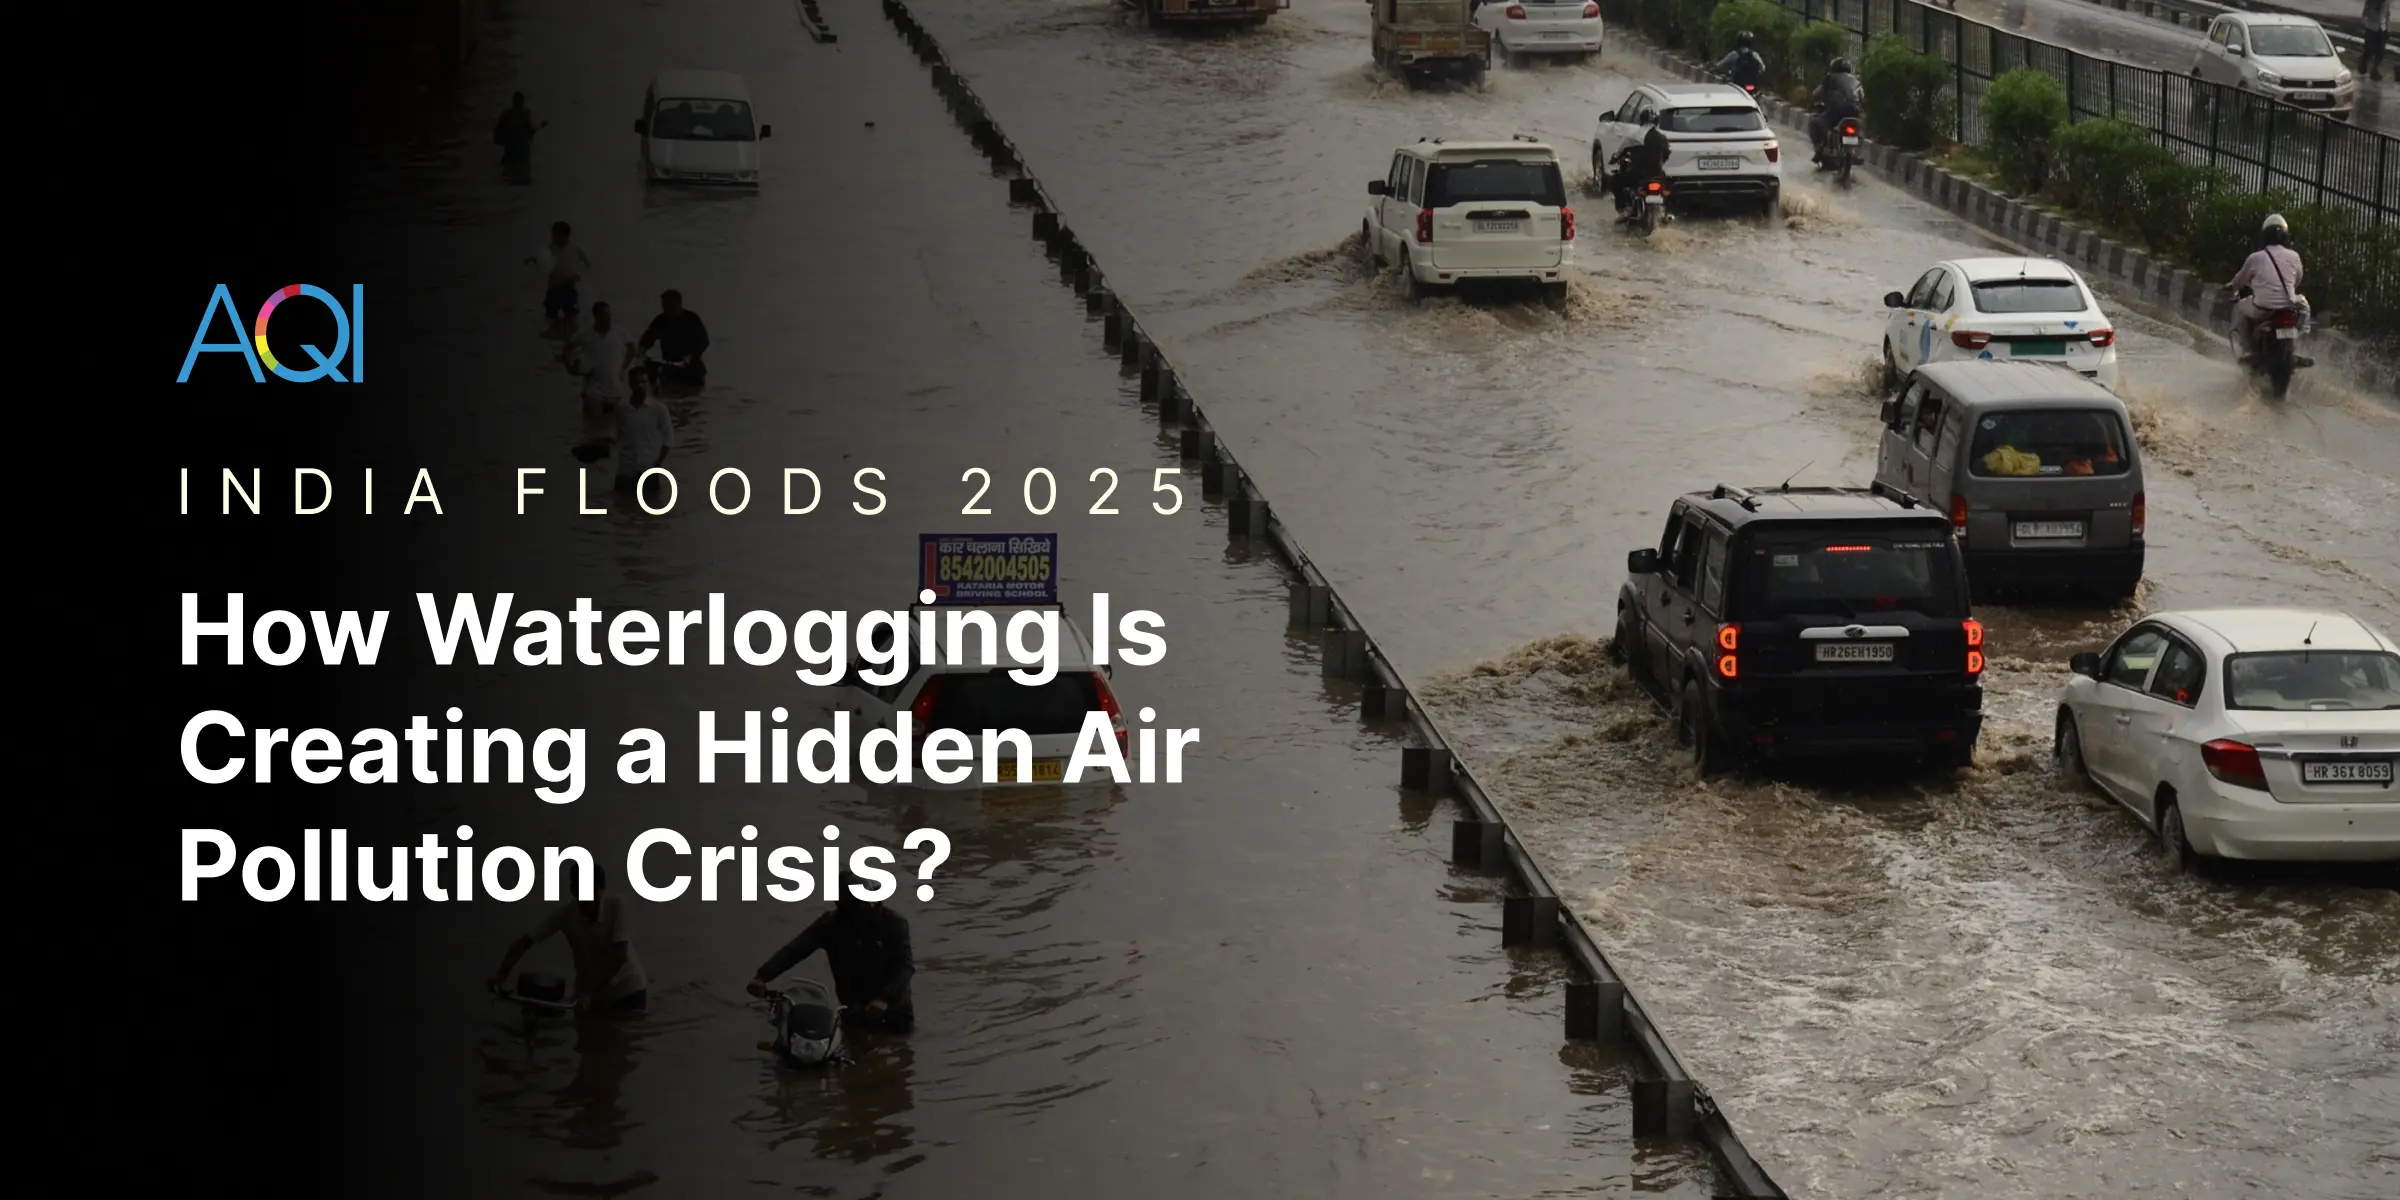
India Floods 2025: How Waterlogging Is Creating a Hidden Air Pollution Crisis?
AQI Graph
Historical Air Quality Data
Vinh Luong
Download 2024 Annual Data
World Air Quality Report

AQI Trends - Annual Air Quality Changes
Vinh Luong, Nha Trang, Khanh Hoa, Vietnam
Annual AQI Trends
Most & Least Polluted Months
* This data analysis is from year 2025 - 2025
Vietnam's Metro Cities
Air Quality Index


Air Quality Calendar 2025
Vinh Luong
Health Advice For People Living In
Vinh Luong
0Cigarettes per day
Breathe easy and get active! The air quality is perfect for enjoying outdoor activities.
Source:
Berkeley Earth
Solutions for Current AQI
 Air PurifierTurn Off
 Car FilterAdvisable
 N95 MaskAdvisable
 Stay IndoorAdvisable
As per the current AQI, turn off the air purifier.
Get an Air PurifierPrevent Health Problems: Understand Your Risks
Vinh Luong
 Asthma
 Heart Issues
 Allergies
 Sinus
Sinus Cold/Flu
 Chronic (COPD)

Low Chances of Asthma
Asthma
Risk of Asthma symptoms is Low when AQI is Good (0-50)
Mild symptoms such as slight wheezing, occasional cough, and minor shortness of breath
Do's :
Keep track of air quality to plan outdoor activities safely.
Drink water to keep airways moist and reduce irritation.
Include non-allergenic fruits and vegetables that support overall lung health, like apples, pears, and spinach.
Don'ts :
Skip medications that is prescribed by your doctor.
Engage in outdoor activities in early morning during high pollen hours.
Most Polluted Cities 2025
Vietnam
Analyze the real-time most air polluted cities in the country.
Standard Value
1.
Thanh pho Thai Nguyen, Vietnam
2.
Thai Nguyen, Vietnam
3.
Da Nang, Vietnam
4.
Thanh pho Thai Binh, Vietnam
5.
Thanh pho Song Cong, Vietnam
6.
Thai Binh, Vietnam
7.
North Tu Liem District, Vietnam
8.
Long Bien, Vietnam
9.
Thanh pho Hung Yen, Vietnam
10.
Long Bien District, Vietnam
Last Updated: 24 Sept 2025, 03:37 AM
AQI City RankingsAir Quality Solutions For Vinh Luong
Explore the solutions of air quality monitoring & clean air.
Here are some applications that you can go through to find out the solutions.


Vinh Luong's AQI Data Analytics Solutions
Air quality data monitoring platforms

Your area’s real-time data with detailed parameters.
Personalized health advice as per current AQI.
Analytical data to identify trends and conditions.
Connect and control your air quality devices.
Air Quality FAQs
at Vinh Luong
Frequently Asked Questions About Air Quality
What is the current AQI level in Vinh Luong?
The current real-time AQI level in Vinh Luong is 35 (Good). This was last updated 24 Sep 2025, 10:26am (Local Time).
When was the best AQI level in Vinh Luong in the last 24 hours?
The best AQI level was 32 (Good) at 9:11 PM, Sep 23, 2025 (Local Time) during the last 24 hours.
When was the worst AQI level in Vinh Luong in the last 24 hours?
The worst AQI level was 47 (Good) at 1:11 PM, Sep 23, 2025 (Local Time) during the last 24 hours.
What is the current trend of AQI levels in Vinh Luong during last 24 hours?
The AQI levels in Vinh Luong have been fluctuating throughout the last 24 hours. The levels have increased by highest 47 at 1:11 PM, Sep 23, 2025 (Local Time), lowest 32 at 9:11 PM, Sep 23, 2025 (Local Time).
What actions are recommended as per the current AQI level in Vinh Luong?
The air quality is satisfactory, and air pollution poses little or no risk. No special precautions are needed; enjoy outdoor activities freely.
Recent AQI Blogs
Read the latest news
Here are some latest blogs that you can go through to find out more air pollution.