 Gyane Haobijam
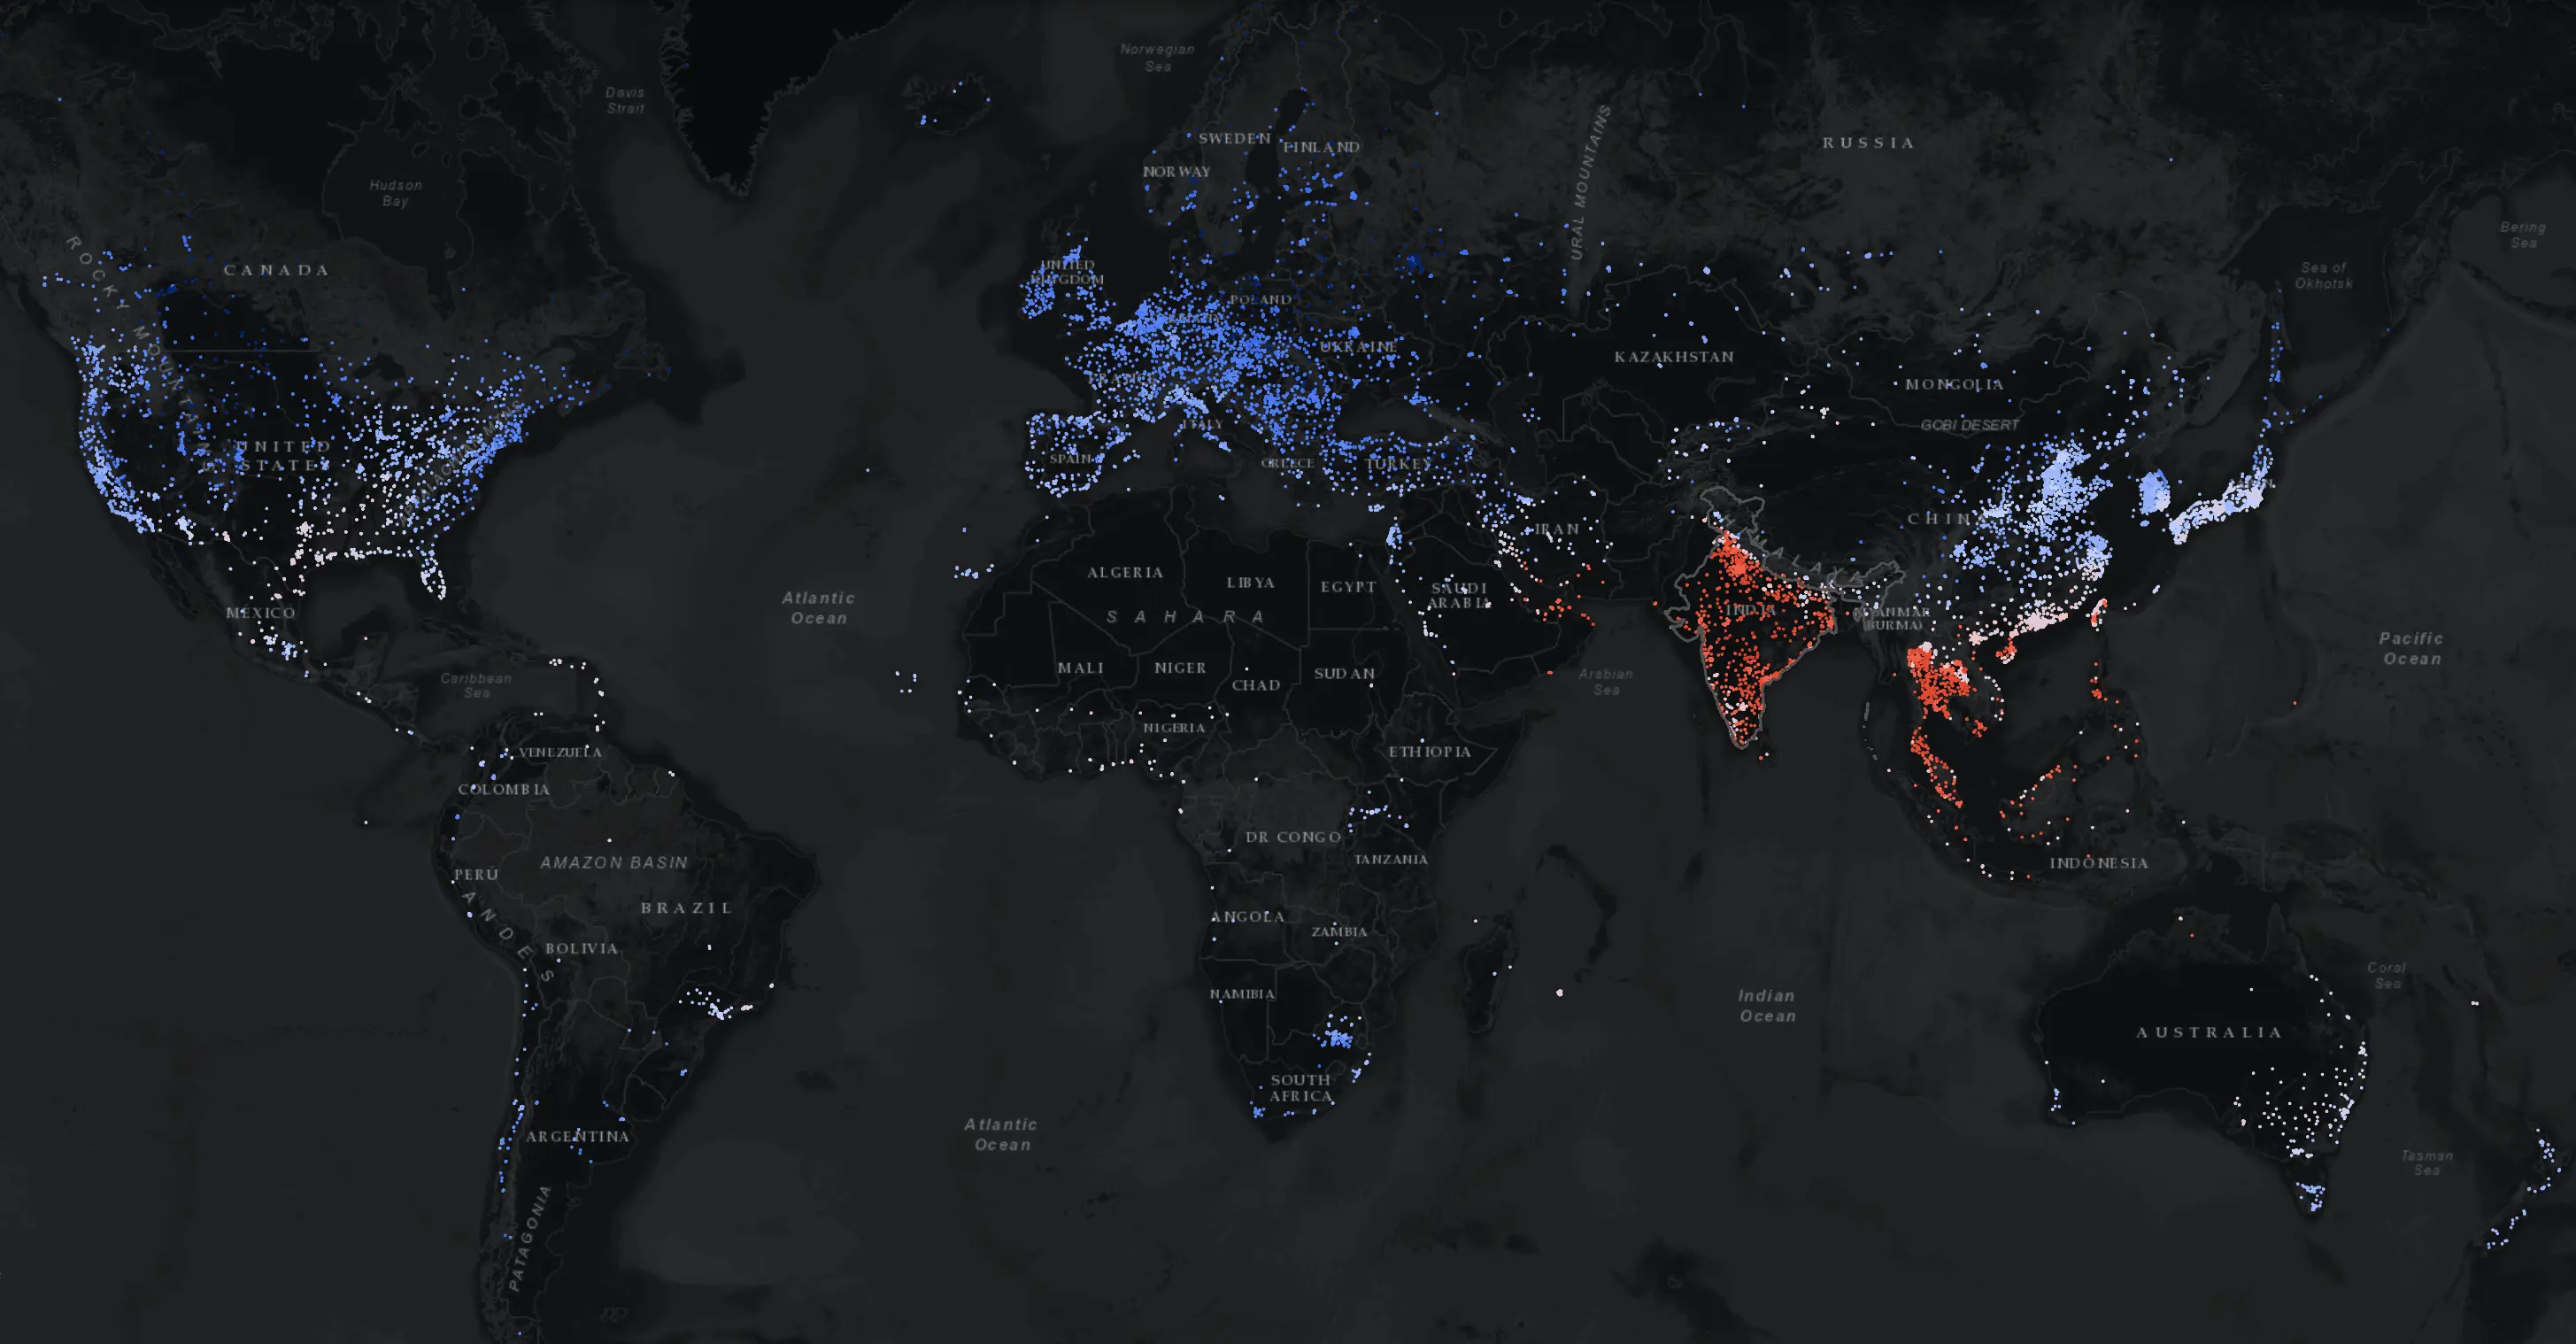
On April 27, 2026, something that has no modern precedent happened across global weather data. When AQI.in compiled its daily heat index, every single one of the world top hottest cities was located inside India.
Not one entry from the Middle East. Not one from sub-Saharan Africa. Not one from Australia. India occupied the entire list, from rank 1 to rank 50.
This is not a normal April. And it demands a serious, data-grounded reckoning.
Understanding the Dataset
Before going city by city, it is important to understand what this data is actually measuring. Each city entry captures six parameters recorded across the full day of April 27:
| Parameter | What It Measures |
|---|---|
| Min Temp (°C) | The coolest point of the day, usually before sunrise |
| Max Temp (°C) | The peak afternoon heat |
| Avg Temp (°C) | The primary ranking metric — sustained heat burden |
| UV Index | Solar radiation intensity on a 0–11+ scale |
| Max Wind (km/h) | Strongest gust recorded across the day |
| Precipitation (mm) | Total rainfall |
| Avg Humidity (%) | Moisture content in the air |
A city can hit a scorching afternoon maximum but rank lower if its nights are cooler. Average temperature captures the sustained heat that residents actually live through, across all 24 hours.
Across all 50 cities, the average peak temperature on April 27 was 44.7°C. The coolest maximum on the entire list — Solapur at 41.9°C — would be considered a public health emergency anywhere in Europe.
The Top Hottest Cities That Led the World
#1 — Banda, Uttar Pradesh
Avg 40.5°C · Max 46.2°C · Min 34.7°C · UV 9.5 · Wind 29.5 km/h · Humidity 15%
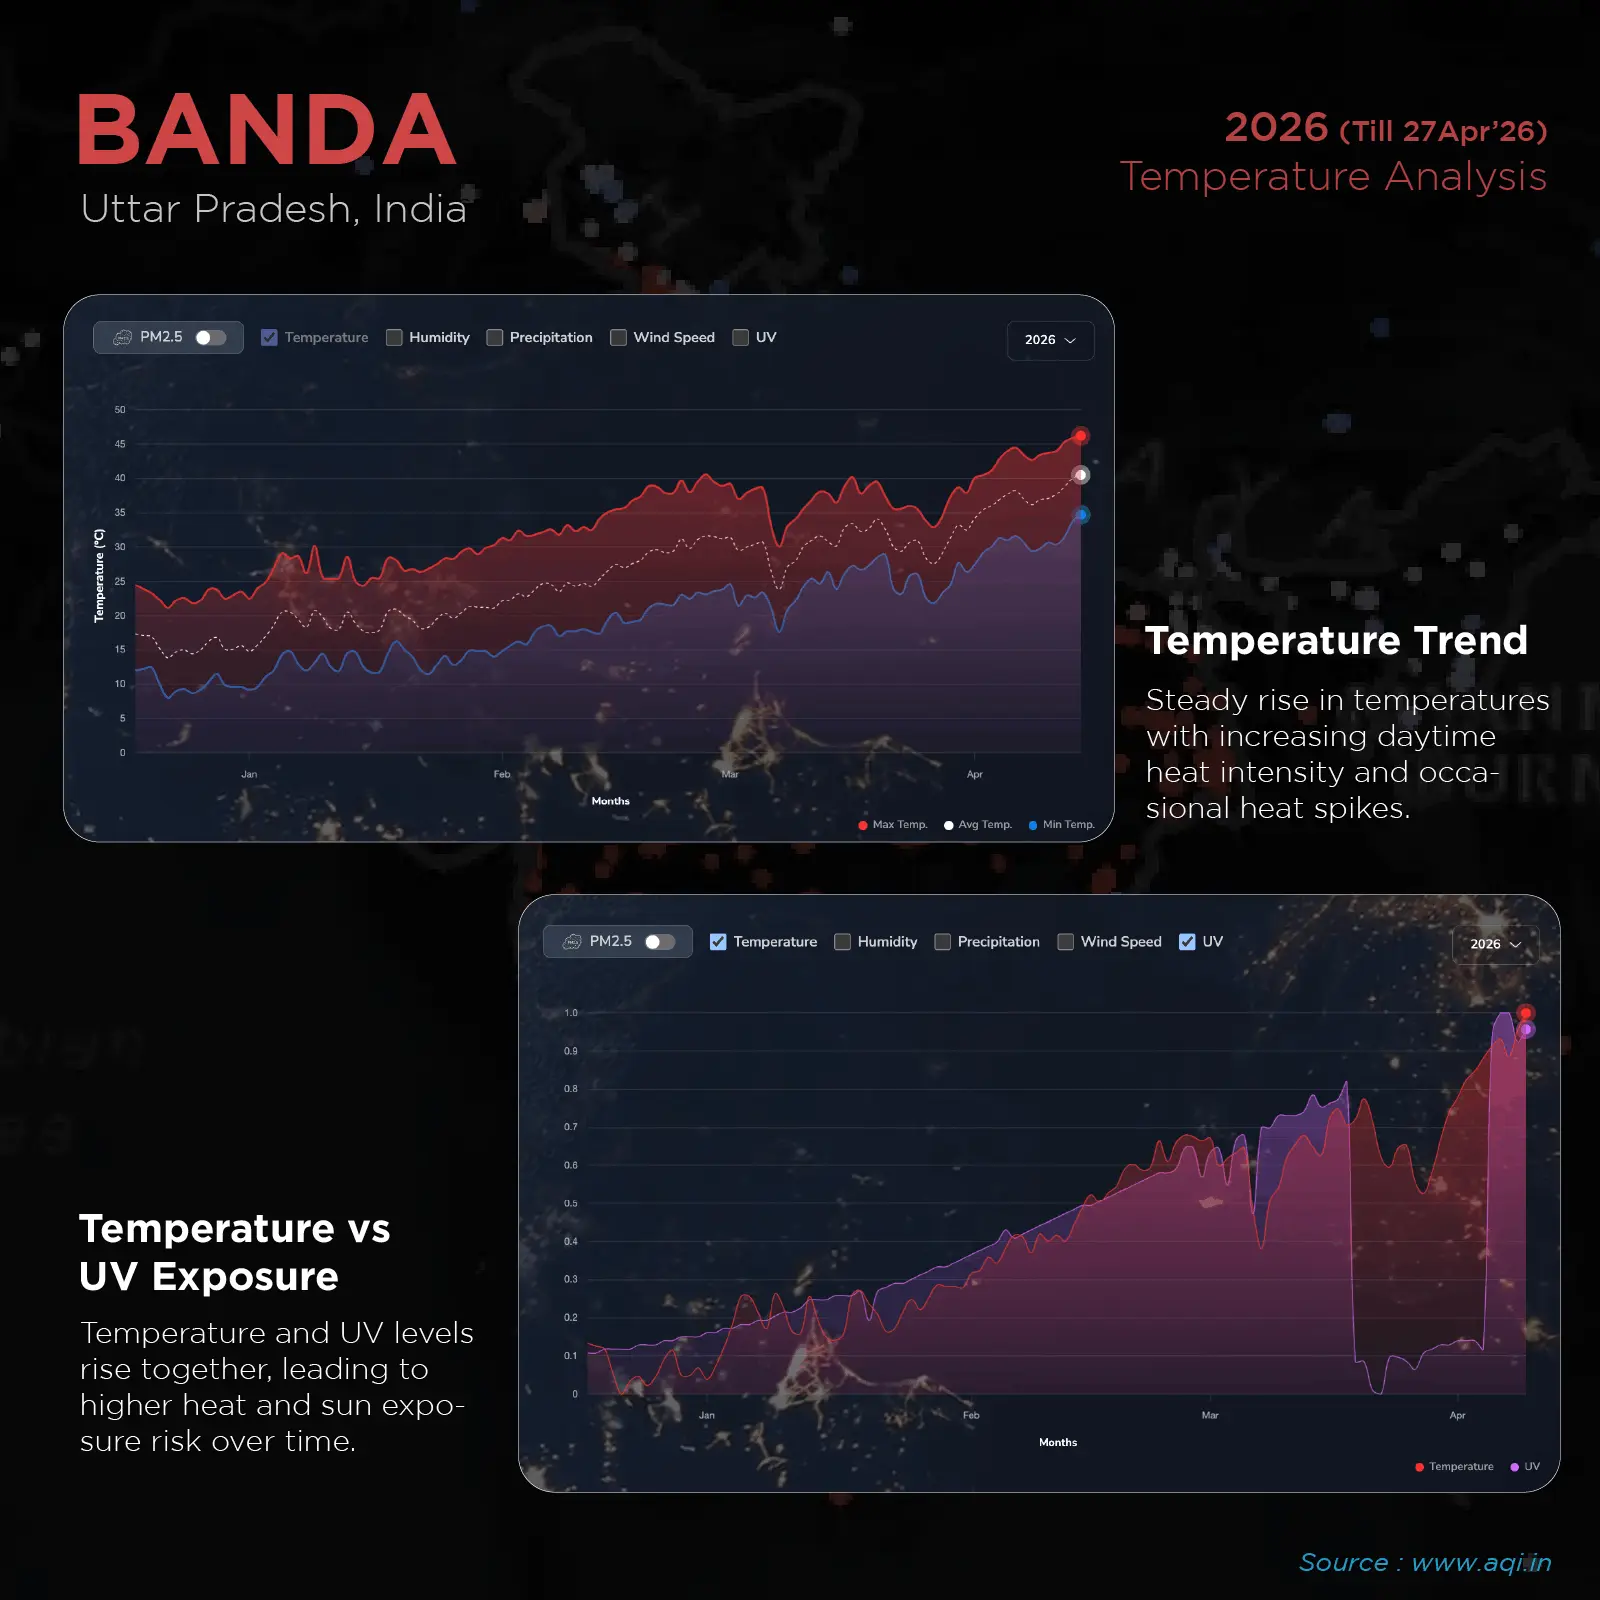
Banda sits in the Bundelkhand region of south Uttar Pradesh — a semi-arid plateau long known for brutal summers and chronic water scarcity. On April 27, it recorded the highest average temperature of any city on earth.
Its minimum was 34.7°C. That means even at its coolest — the hours after midnight — Banda was hotter than what most of Europe considers a dangerous summer heatwave. Its maximum of 46.2°C was the highest single-city peak on the global list that day. At 15% humidity, the heat is dry and desiccating. Skin loses moisture rapidly. Labourers working outdoors face genuine risk of heat stroke within hours of midday exposure.
Banda does not feature much in mainstream climate coverage. It has no world-famous landmarks. But on April 27, 2026, its sky recorded conditions more extreme than any other urban area on the planet.
#2 — Amravati, Maharashtra and #3 Kanpur, Uttar Pradesh
Avg 39.5°C each
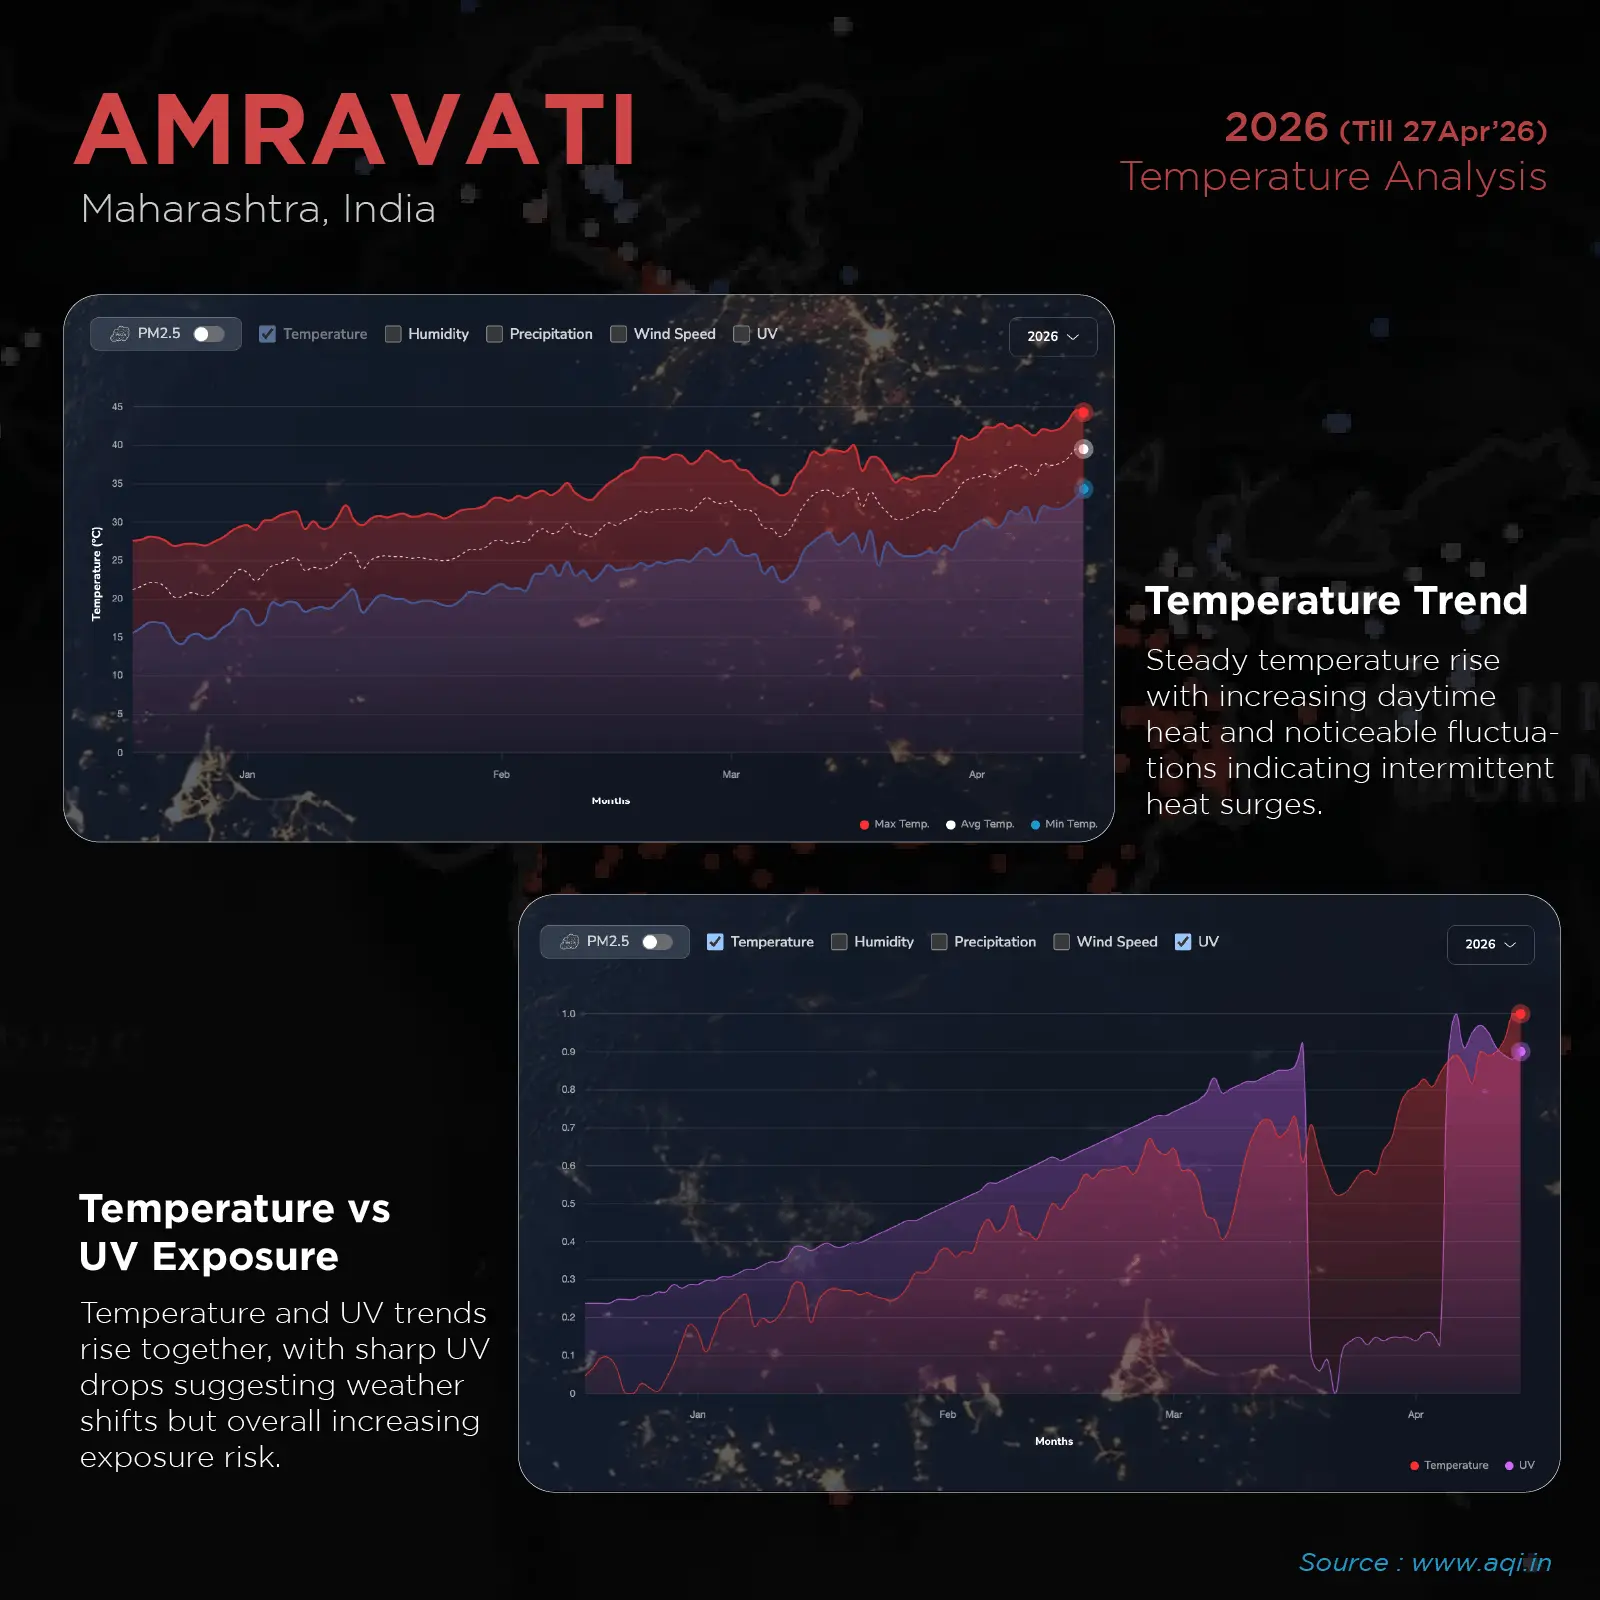
Amravati (Max 44.3°C, UV 10.3, Humidity 13%) represents Vidarbha — a structurally baked inland belt of Maharashtra. Flat terrain, sparse tree cover, low elevation, and distance from any moderating coastline create conditions where heat simply accumulates with nowhere to go.
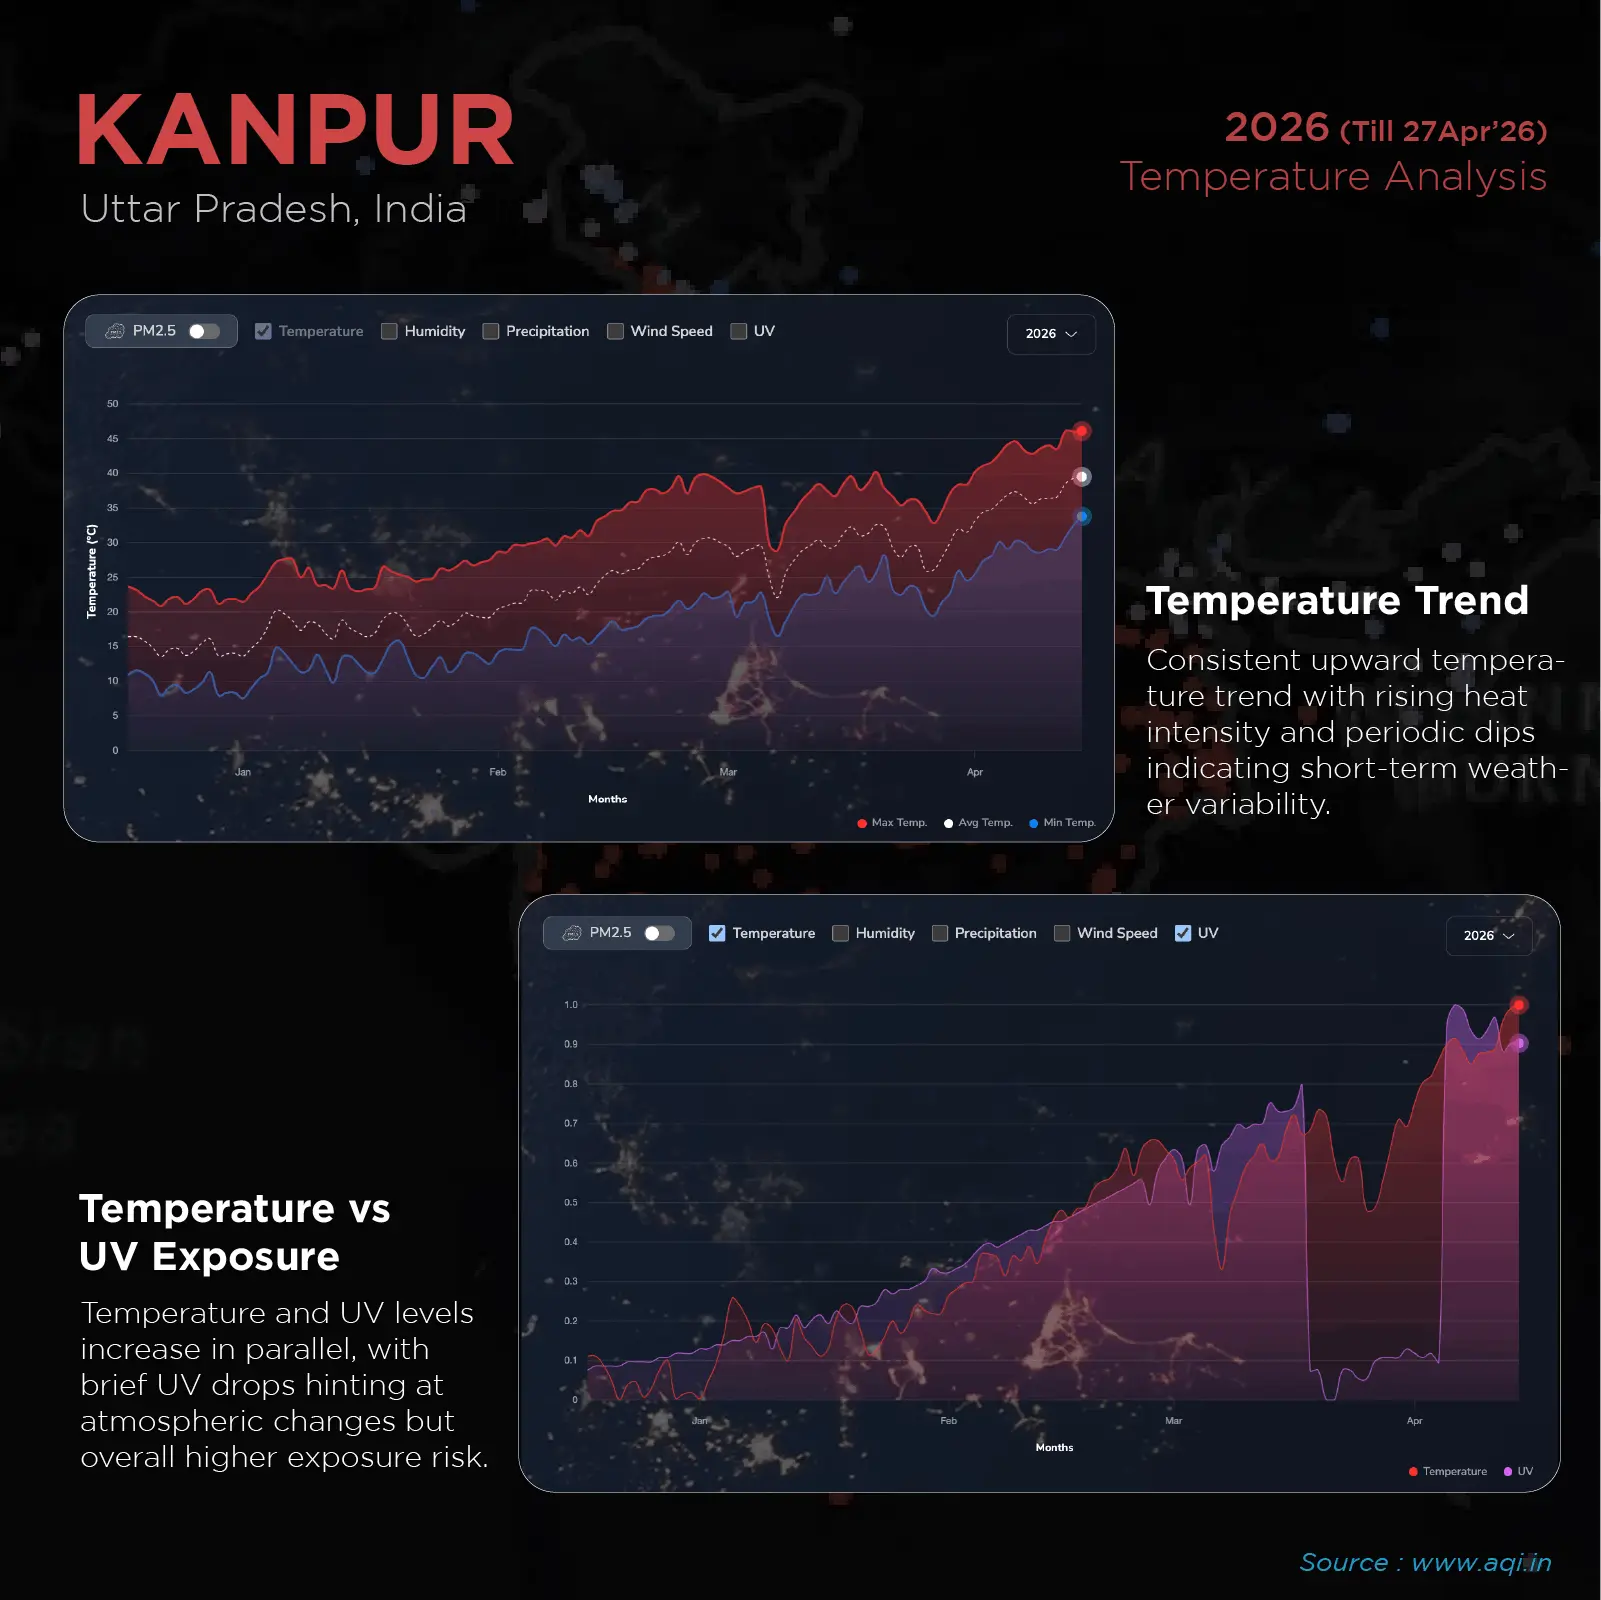
Kanpur (Max 46.1°C, Wind 27.7 km/h, Humidity 15%) tells a different story through the same temperature. An industrial city on the Gangetic plain, it is caught in late April’s heat trough: the westerly winds that kept winter cool have retreated, and a hot continental air mass from the northwest presses down. Wind at 27.7 km/h and 46°C does not cool the body — it accelerates dehydration.
#4 — Yavatmal and #4 Akola, Maharashtra
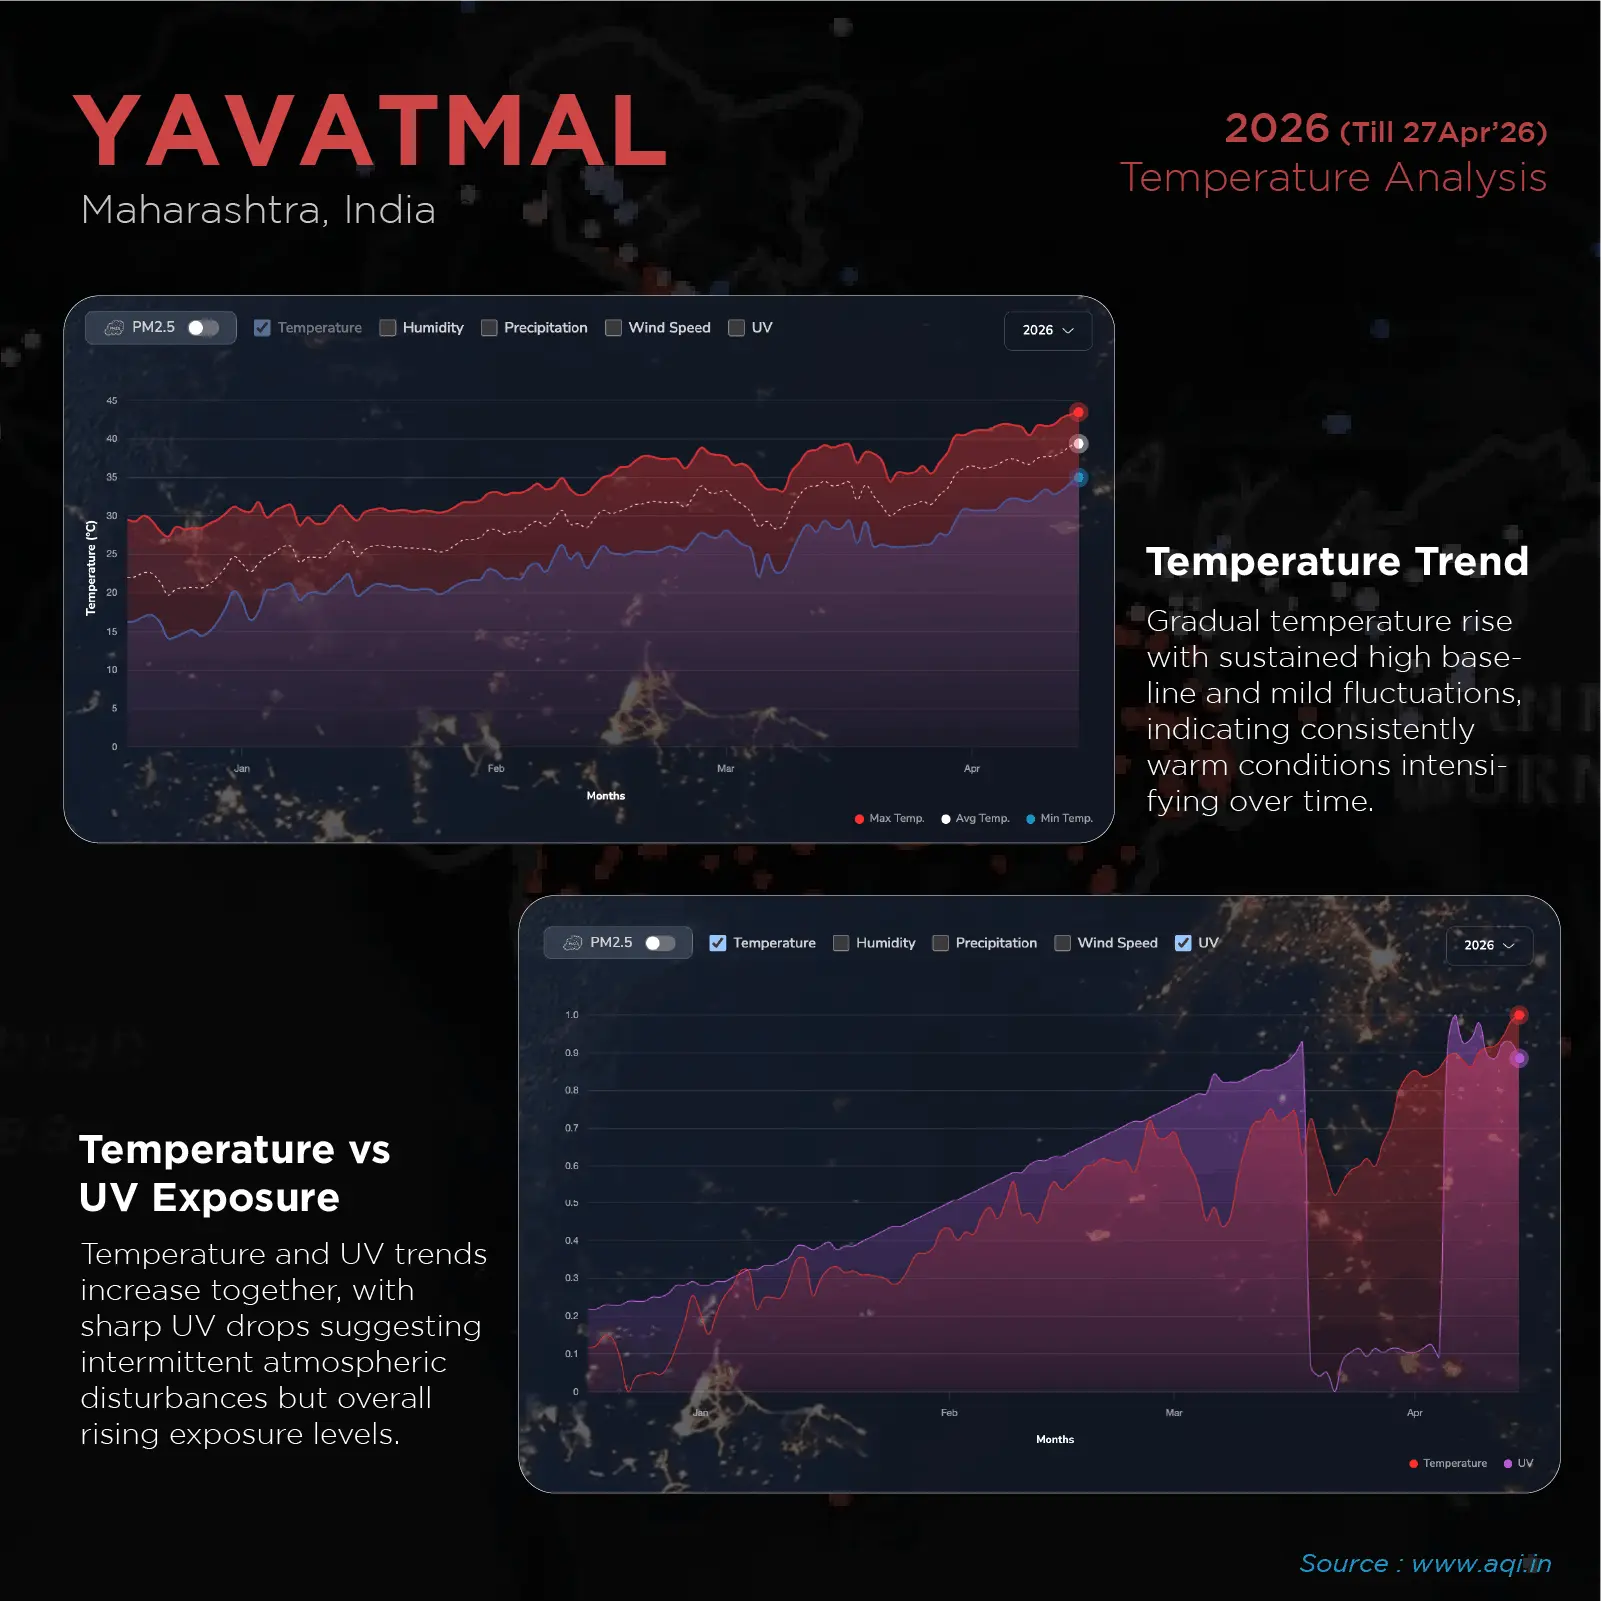
Avg 39.4°C and 39.3°C
Both from Vidarbha. Both illustrating one of the most overlooked climate stories of 21st-century India: the year-on-year intensification of summer heat in this belt.
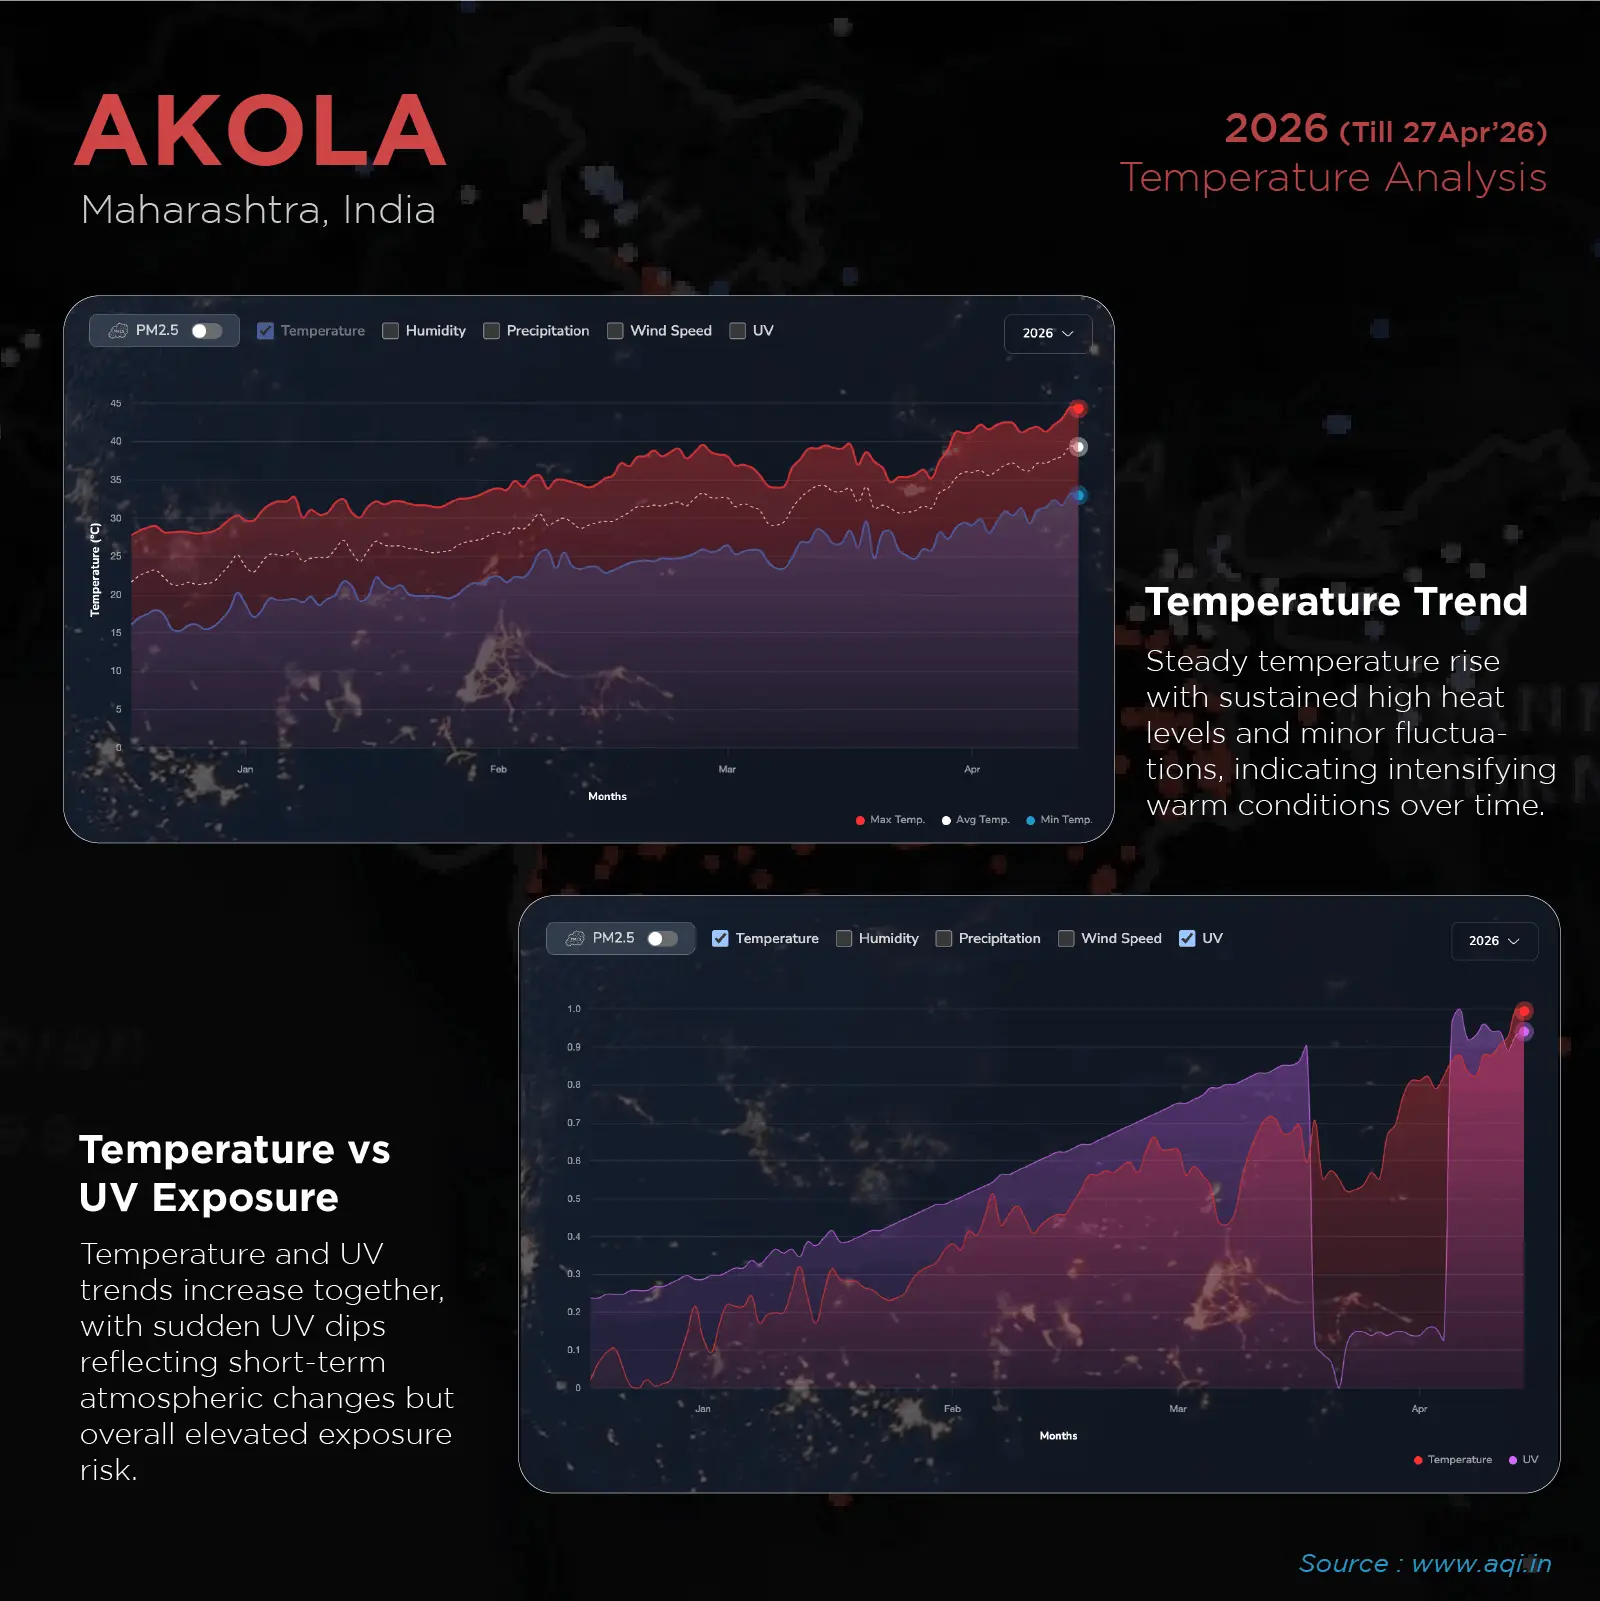
Akola recorded the highest UV index of any city on the list: 10.7. The WHO classifies UV 8+ as “very high” and 11+ as “extreme.” At 10.7, unprotected skin can begin to burn within 15 minutes at midday. Combined with 13% humidity — the driest conditions among the top-10 cities — Akola on this day was a textbook heat stress environment.
The Geography of This Heatwave
When all 50 cities are mapped by state, the pattern is unmistakable:
| State | Cities on List |
|---|---|
| Uttar Pradesh | 21 |
| Maharashtra | 10 |
| Madhya Pradesh | 6 |
| Rajasthan | 6 |
| Haryana | 4 |
| Delhi | 1 |
| Telangana | 1 |
| Chhattisgarh | 1 |
This is not random. These states occupy India’s interior heat belt, and each is experiencing this heatwave for a different structural reason.
Uttar Pradesh — 21 Cities, The Plains in Full Fire
With 21 cities on this list, UP deserves the most attention. The state spans the Gangetic plain — topographically flat, geographically exposed, and in late April locked in a heat trough driven by a low-pressure system over Rajasthan.
Fatehpur hit 46.1°C. Etawah matched it — but Etawah’s real story is wind: at 59.8 km/h, it recorded the strongest gusts of any city on the entire global list. At 46°C ambient temperature, winds of that speed are not a relief. They strip moisture from surfaces and bodies at a rate the body cannot compensate for.
Prayagraj had the widest temperature swing of any city: a high of 45.7°C dropping to a minimum of 29.1°C overnight — a 16.6°C diurnal range characteristic of continental climates in transition. It also had the highest humidity on the list at 21%, meaning the physiological heat burden was compounded.
The NCR cluster tells its own story. Noida, New Delhi, Faridabad, Gurgaon, Greater Noida, and Ghaziabad all clustered between 44.1°C and 44.9°C maximum. Delhi never dropped below 33.7°C even at its overnight minimum. Urban heat island effects — the density of concrete, asphalt, and machinery — mean cities retain daytime heat and radiate it back through the night.
Maharashtra — 10 Cities, A Chronic Crisis That Goes Unreported
Every Maharashtra entry comes from Vidarbha. Chandrapur (Max 45.3°C), Bhusawal (Max 44.6°C, UV 10.4), Nagpur (Max 44.0°C), Nanded (Max 43.6°C) — these are cities where summer temperatures push toward 45°C with increasing regularity.
What makes the Vidarbha situation particularly significant is context: this region carries some of the highest rates of agricultural distress in India. Farmers and field workers are outdoors during the hottest hours with limited access to shade, hydration, or emergency medical support. Heatwave mortality in this belt is consistently underreported.
Rajasthan — 6 Cities, The Desert Paradox
The surprise in this data is that Rajasthan does not dominate the list — the state with India’s all-time temperature record (Phalodi, 51°C in May 2016) is ranked in the bottom half.
The reason is analytically important: Rajasthan’s desert nights are genuinely cool. The Thar Desert loses heat rapidly after sunset, bringing average daily temperatures down even when the afternoon maximum is brutal.
Jaisalmer hit 44.1°C maximum — extreme by any measure — but its 30.5°C minimum brought its 24-hour average to 37.5°C, placing it at rank 49. Phalodi hit 44.5°C maximum with a 37.8°C average. The desert’s diurnal cooling saves it from the top of this particular ranking, even as its peak readings remain dangerous.
Madhya Pradesh — 6 Cities, The Hidden Heat Corridor
Orchha, Jhansi, Burhanpur, Gwalior, Khajuraho, Satna, and Maihar form a corridor of central Indian cities where historical deforestation has measurably reduced surface albedo, amplifying heat absorption.
Gwalior hit 45.6°C maximum with 41.8 km/h gusts. Khajuraho — the UNESCO World Heritage site drawing international tourists — hit 44.3°C. Visitors walking between the famous temples on April 27 were doing so in extreme heat conditions that would trigger national emergencies in most countries.
What the Individual Parameters Reveal
On Humidity (13%–21% range across all 50 cities)
Low humidity is often misunderstood as making heat more tolerable. In one narrow sense, it allows sweat to evaporate faster, aiding cooling. But at 44–46°C ambient temperature, this mechanism breaks down entirely.
When ambient air is hotter than core body temperature (37°C), the body absorbs heat from the environment even through the skin. No amount of sweating provides meaningful cooling.
Dry heat at extreme temperatures causes faster dehydration, faster kidney stress, and faster cognitive impairment. The 13% humidity recorded in Akola, Yavatmal, Amravati, Greater Noida, and Sambhal placed residents in precisely this condition for hours.
On UV Index (average 9.8 across all 50 cities)
The range on this list ran from 7.7 (Raipur) to 10.7 (Akola). The WHO classifies UV 8–10 as “very high” and 11+ as “extreme.” An average of 9.8 means nearly every city on this list was at the threshold of extreme solar radiation for hours around midday.
For agricultural communities where outdoor exposure runs six to eight hours daily, sustained very-high UV compounds the harm from heat alone in ways that simple temperature readings do not capture.
Raipur’s comparatively lower UV of 7.7 is notable — Chhattisgarh sits further east and slightly south, and may have experienced partial cloud cover or higher atmospheric moisture suppressing radiation even as surface temperatures remained elevated.
On Wind (15.5 km/h to 59.8 km/h range)
Strong wind during extreme heat carries a dual risk:
- Agricultural stress — wind accelerates moisture loss from soil and crops during the driest period of the year
- Air quality compounding — dry, fast-moving air carries fine dust, raising PM10 and PM2.5 concentrations simultaneously with heat stress
Etawah’s 59.8 km/h winds are consistent with pre-monsoon “loo” conditions — the hot, dry wind of the Indo-Gangetic plain that can incapacitate a person in direct exposure within hours.
Mathura and Vrindavan, major pilgrimage cities that draw millions of visitors, recorded 43.2 and 35.3 km/h respectively. For pilgrims walking barefoot between temples in these conditions, April 27 required serious caution.
On Precipitation (near zero across the board)
The highest rainfall recorded among all 50 cities was Agra at 0.50 mm — a trace. Most cities recorded 0.00 mm. A handful showed fractional amounts likely to have evaporated almost on contact.
This is expected in late April. The pre-monsoon season is the driest point of India’s annual cycle. Soil moisture is at its annual low. Rivers in rain-shadow zones are running shallow. The monsoon’s arrival is still six to eight weeks away. This is the trough — and it is the most dangerous period of the year from a heat health standpoint.
World Top 50 Hottest Cities – April 2026
| Rank | City | State | Avg °C | Max °C | Min °C | UV | Wind km/h | Humidity % |
|---|---|---|---|---|---|---|---|---|
| 1 | Banda | Uttar Pradesh | 40.5 | 46.2 | 34.7 | 9.5 | 29.5 | 15 |
| 2 | Amravati | Maharashtra | 39.5 | 44.3 | 34.3 | 10.3 | 24.1 | 13 |
| 2 | Kanpur | Uttar Pradesh | 39.5 | 46.1 | 33.8 | 9.8 | 27.7 | 15 |
| 4 | Yavatmal | Maharashtra | 39.4 | 43.5 | 35.0 | 10.1 | 19.4 | 13 |
| 5 | Akola | Maharashtra | 39.3 | 44.3 | 33.0 | 10.7 | 26.3 | 13 |
| 6 | Fatehpur | Uttar Pradesh | 39.1 | 46.1 | 32.5 | 9.7 | 28.1 | 16 |
| 7 | Etawah | Uttar Pradesh | 38.8 | 46.1 | 31.0 | 9.6 | 59.8 | 16 |
| 8 | Noida | Uttar Pradesh | 38.7 | 44.1 | 33.6 | 9.6 | 23.8 | 13 |
| 9 | Orchha | Madhya Pradesh | 38.7 | 45.2 | 33.0 | 9.9 | 26.3 | 17 |
| 10 | Jhansi | Uttar Pradesh | 38.7 | 45.2 | 33.0 | 9.9 | 26.3 | 17 |
| 11 | Nagpur | Maharashtra | 38.6 | 44.0 | 32.9 | 9.4 | 15.5 | 15 |
| 12 | Nanded | Maharashtra | 38.6 | 43.6 | 33.7 | 10.5 | 19.1 | 15 |
| 13 | Faridabad | Haryana | 38.6 | 44.2 | 33.4 | 9.6 | 23.8 | 14 |
| 14 | Parbhani | Maharashtra | 38.5 | 43.0 | 33.4 | 10.7 | 19.8 | 13 |
| 15 | New Delhi | Delhi | 38.5 | 44.0 | 33.7 | 9.6 | 23.0 | 14 |
| 16 | Chandrapur | Maharashtra | 38.5 | 45.3 | 31.4 | 9.3 | 19.8 | 20 |
| 17 | Burhanpur | Madhya Pradesh | 38.5 | 44.2 | 31.9 | 10.4 | 28.4 | 13 |
| 18 | Bhusawal | Maharashtra | 38.4 | 44.6 | 31.2 | 10.4 | 27.4 | 14 |
| 19 | Gurgaon | Haryana | 38.3 | 44.1 | 33.4 | 9.6 | 23.8 | 14 |
| 20 | Jalgaon | Maharashtra | 38.2 | 44.3 | 31.1 | 10.3 | 24.1 | 16 |
| 21 | Agra | Uttar Pradesh | 38.2 | 45.5 | 32.4 | 9.5 | 48.6 | 17 |
| 22 | Kota | Rajasthan | 38.2 | 44.2 | 32.6 | 10.0 | 24.5 | 15 |
| 23 | Firozabad | Uttar Pradesh | 38.2 | 45.7 | 32.5 | 9.5 | 40.0 | 17 |
| 24 | Palwal | Haryana | 38.1 | 44.9 | 31.8 | 9.5 | 27.0 | 16 |
| 25 | Adilabad | Telangana | 38.1 | 44.2 | 32.5 | 9.8 | 21.6 | 17 |
| 26 | Greater Noida | Uttar Pradesh | 38.1 | 44.6 | 31.8 | 9.6 | 24.1 | 13 |
| 27 | Ghaziabad | Uttar Pradesh | 38.1 | 44.3 | 32.3 | 9.6 | 24.1 | 13 |
| 28 | Bhiwadi | Rajasthan | 38.1 | 44.3 | 32.8 | 9.6 | 26.6 | 15 |
| 29 | Bikaner | Rajasthan | 38.0 | 44.4 | 32.2 | 10.0 | 30.6 | 17 |
| 30 | Prayagraj | Uttar Pradesh | 38.0 | 45.7 | 29.1 | 9.6 | 24.5 | 21 |
| 31 | Gwalior | Madhya Pradesh | 38.0 | 45.6 | 33.4 | 9.9 | 41.8 | 18 |
| 32 | Khurja | Uttar Pradesh | 37.9 | 44.8 | 31.2 | 9.5 | 29.5 | 14 |
| 33 | Khajuraho | Madhya Pradesh | 37.9 | 44.3 | 32.7 | 9.6 | 27.4 | 17 |
| 34 | Vrindavan | Uttar Pradesh | 37.8 | 45.4 | 31.5 | 9.3 | 35.3 | 18 |
| 35 | Mathura | Uttar Pradesh | 37.8 | 45.4 | 31.8 | 9.3 | 43.2 | 18 |
| 36 | Phalodi | Rajasthan | 37.8 | 44.5 | 30.8 | 10.4 | 28.1 | 16 |
| 37 | Hathras | Uttar Pradesh | 37.8 | 45.4 | 31.4 | 9.5 | 31.7 | 17 |
| 38 | Satna | Madhya Pradesh | 37.8 | 44.7 | 33.4 | 9.6 | 28.1 | 17 |
| 39 | Tonk | Rajasthan | 37.8 | 44.4 | 32.1 | 10.3 | 27.4 | 16 |
| 40 | Aligarh | Uttar Pradesh | 37.8 | 45.3 | 31.0 | 9.5 | 27.7 | 16 |
| 41 | Bulandshahr | Uttar Pradesh | 37.8 | 44.7 | 30.9 | 9.5 | 27.7 | 14 |
| 42 | Maihar | Madhya Pradesh | 37.8 | 44.7 | 33.4 | 9.6 | 28.1 | 17 |
| 43 | Barehra | Uttar Pradesh | 37.7 | 45.4 | 31.0 | 9.6 | 29.9 | 16 |
| 44 | Bahadurgarh | Haryana | 37.7 | 44.5 | 31.8 | 9.7 | 30.2 | 15 |
| 45 | Raipur | Chhattisgarh | 37.5 | 44.0 | 30.9 | 7.7 | 28.4 | 18 |
| 46 | Lucknow | Uttar Pradesh | 37.5 | 45.2 | 29.6 | 9.7 | 20.9 | 18 |
| 47 | Budaun | Uttar Pradesh | 37.5 | 45.6 | 31.5 | 9.6 | 29.2 | 14 |
| 48 | Solapur | Maharashtra | 37.5 | 41.9 | 31.7 | 10.3 | 28.1 | 19 |
| 49 | Sambhal | Uttar Pradesh | 37.5 | 45.5 | 30.5 | 9.5 | 29.5 | 13 |
| 50 | Jaisalmer | Rajasthan | 37.5 | 44.1 | 30.5 | 10.1 | 35.6 | 18 |
Data Source: AQI.In – 27 April, 2026
What This Means — Three Ways to Read This Data
This dataset can be read in three meaningful ways, and all three matter.
It is an emergency health signal. When 50 cities share average temperatures above 37.5°C — core human body temperature — entire regions are living in conditions where heat-related illness becomes a mass public health risk. Outdoor workers, the elderly, children, and those with cardiovascular conditions face acute danger. Public health infrastructure across most of these cities is not scaled for heat emergencies of this duration and spread.
It is a climate data point in a worsening trend. April heatwaves of this intensity across this many cities simultaneously are not historically typical of the Indian subcontinent. India has always had hot summers. But the geographic spread, the duration, and the concurrence of multiple regions crossing extreme thresholds on the same day have all been intensifying. One day’s data cannot establish a trend alone — but it is a data point within a pattern that climate scientists have been documenting with increasing urgency.
It is actionable information for residents. If you live in any of these 50 cities, this data tells you something specific: the UV intensity around midday, what the wind means for moisture loss, what an overnight minimum of 33°C means for sleep and recovery. Heat safety is not only about the afternoon peak — it is about the cumulative burden across all 24 hours, which is precisely what average temperature is designed to capture.
Heat Safety – What the Numbers Mean for Daily Decisions
Avoid outdoor activity between 11 AM and 4 PM. At temperatures between 44–46°C with UV indexes above 9.5, healthy adults can develop heat exhaustion within 30–45 minutes of direct exposure.
Hydrate constantly, not only when thirsty. At 13–21% humidity, the body loses moisture through respiration and perspiration faster than the thirst signal keeps pace. Electrolyte replenishment — ORS, coconut water, salted lemon water — is meaningfully more effective than plain water alone in these conditions.
Recognise heat stroke warning signs. Confusion, hot dry skin, loss of consciousness, and paradoxically stopping sweating are emergency signals. Move the person to shade immediately, wet the skin, and seek medical help. Do not give water orally to someone unconscious.
Check on elderly neighbours. People over 65 have impaired thermoregulation. In cities like Banda, Akola, and Jhansi, regular welfare checks during peak afternoon hours can be genuinely life-saving.
Monitor air quality alongside temperature. In cities like Agra, Firozabad, Etawah, and Ghaziabad, high winds during heat events raise fine particulate matter concentrations. On days when PM2.5 is elevated and temperature exceeds 44°C, the combined physiological load on the cardiovascular and respiratory systems is compounded. Track both simultaneously at AQI.in.
Why This Data Exists
AQI.in built this dataset because accurate, real-time, city-level environmental data should not be a product available only to researchers and government agencies, this is for everyone.