 Gyane Haobijam
The conversation around air pollution in India’s National Capital Region (NCR) is often flattened into a single, unchanging narrative: the air is always severe. However, a granular look at the data, especially concerning Delhi Air Quality, reveals that Delhi Air Quality is a highly dynamic, volatile, and seasonal phenomenon.
Using comprehensive, daily monitoring records from www.aqi.in, we conducted an in-depth data analysis comparing Delhi’s fine particulate matter (PM2.5) concentrations from January to May 2026 against a 6-year historical baseline (2020–2025) to better understand Delhi Air Quality.
The findings reveal a fascinating “tale of two seasons.” While 2026 began with winter pollution spikes that significantly breached historical averages, it transitioned into an unprecedented, cleaner spring and summer, recording some of the lowest PM2.5 concentrations observed in recent history, improving the overall Delhi Air Quality.
Macro Analysis: The Jan–May 2026 PM2.5 Average
When looking at the entire 5-month period (comprising 153 days of continuous tracking), the overall metrics for 2026 sit remarkably close to the 6-year historical average.
Ongoing research will continue to evaluate and address challenges to Delhi Air Quality.
- Overall Average PM2.5 in 2026: 102.24 µg/m³
- Overall Historical Average (2020–2025): 99.57 µg/m³
- Net Percentage Change: +2.68%
While a 2.68% net increase suggests that 2026 was slightly more polluted on average, this macro-level metric masks a dramatic monthly volatility. The year began with an intense winter crisis but was rescued by a highly encouraging atmospheric clean-up during the pre-monsoon months.
The chart below illustrates this sharp contrast between the early winter surge and the spring-summer decline.

Charting the Shift: Monthly PM2.5 Variations
Daily data points were aggregated to contrast the current year with the established baseline:
Monthly Breakdown: Tracking Delhi’s Pollution Volatility
The table below outlines the monthly average PM2.5 concentrations (µg/m³) for 2026 compared to the 6-year historical baseline, highlighting the percentage shift and general air quality trend:
Tracking Delhi Air Quality trends helps to identify successful pollution control measures.
| Month | 2026 Avg. (PM2.5) | Historical Avg. (2020–2025) | % Change | Air Quality Trend |
| January | 211.77 µg/m³ | 184.90 µg/m³ | +14.53% | Significant Worsening |
| February | 129.75 µg/m³ | 115.28 µg/m³ | +12.55% | Moderate Worsening |
| March | 79.03 µg/m³ | 75.48 µg/m³ | +4.70% | Marginal Worsening |
| April | 53.70 µg/m³ | 67.03 µg/m³ | -19.89% | Significant Improvement |
| May | 41.81 µg/m³ | 58.81 µg/m³ | -28.91% | Massive Improvement |
Chronological Analysis: From Winter Smog to Summer Clear Skies
To understand how the air quality shifted so drastically, we must break down the timeline into its two distinct meteorological phases.
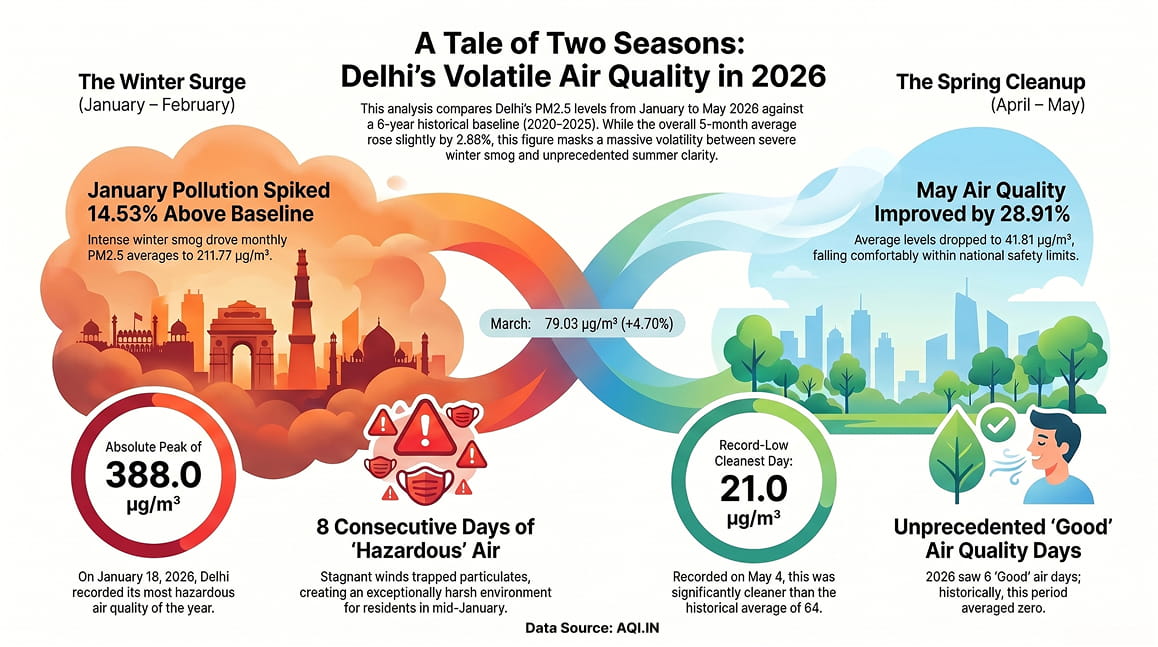
1. The Heavy Winter Surge (January – February)
The year 2026 began under a dense, toxic blanket of smog. January recorded a monthly average PM2.5 level of 211.77 µg/m³, which is 14.53% higher than the 6-year baseline of 184.90 µg/m³.
During this month, Delhi experienced its most hazardous air of the year. The historical monitoring reveals a consecutive 8-day streak of “Hazardous” air quality from January 13 to January 20.
Ultimately, achieving better Delhi Air Quality requires collaborative efforts from all stakeholders.
Comparative analysis of Delhi Air Quality highlights the need for ongoing monitoring.
- The 2026 Absolute Peak: On January 18, 2026, daily PM2.5 peaked at an alarming 388.0 µg/m³.
- The Historical Comparison: By contrast, the highest single-day average in the historical baseline for that same calendar period was 248 µg/m³.
February followed a similar pattern, averaging 129.75 µg/m³—a 12.55% escalation over the multi-year average of 115.28 µg/m³. Low wind speeds and standard winter atmospheric inversions locked fine particulates close to the surface, making early 2026 exceptionally harsh for residents.
2. The Spring Pivot (March)
March served as the seasonal bridge. The monthly average settled at 79.03 µg/m³, matching the historical baseline (75.48 µg/m³) within a close margin of +4.70%. As temperatures began to rise, the boundary layer lifted, setting the stage for a dramatic atmospheric turnaround.
3. The Unprecedented Pre-Monsoon Clean-Up (April – May)
The most striking insight from the dataset is the major air quality victory observed in April and May 2026.
- April 2026: Slashed its average concentration down to 53.70 µg/m³, beating the historical baseline of 67.03 µg/m³ by -19.89%.
- May 2026: Registered an extraordinary average of just 41.81 µg/m³ against the historical expectation of 58.81 µg/m³—a staggering -28.91% drop.
This means May 2026 air quality was, on average, comfortably within India’s National Ambient Air Quality Standard (NAAQS) daily safety limit of 60 µg/m³ for PM2.5.
Air Quality Classification: A Highly Polarized Profile
Air quality categories for PM2.5 follow a clear structure from Good to Hazardous. When we look at the distribution of the 153 days monitored in Delhi 2026 (Jan-May), we see a highly polarized profile compared to the baseline:
- Good (0 to 30 µg/m³): 2026 recorded 6 days in this pristine category. Historically, the multi-year baseline average had never dropped into this bracket for this period, yielding 0 days.
- Moderate (31 to 60 µg/m³): 2026 enjoyed 51 days of moderate air, nearly doubling the historical baseline of 27 days.
- Poor (61 to 90 µg/m³): There were 29 days in this bracket for 2026, compared to a significant 69 days historically.
- Unhealthy (91 to 120 µg/m³): 2026 registered 21 days, closely mirroring the historical baseline of 14 days.
- Severe (121 to 250 µg/m³): 2026 observed 37 days shifting into this bracket, showing an improvement from the historical average of 43 days.
- Hazardous (251 to 380+ µg/m³): 2026 encountered 9 intense days breaching this extreme threshold, all concentrated in January. The historical baseline displays 0 days here because averaging multiple years mathematically smooths out individual hyper-peaks.
The Pristine Days of May 2026
All 6 of the ultra-clean “Good” air days occurred during May 2026. The cleanest day of the year was recorded on May 4, 2026, with a record-low PM2.5 concentration of just 21.0 µg/m³. Historically, that exact calendar day averaged a much cloudier 64 µg/m³ (falling into the Poor bracket).
Other exceptionally clean days in May 2026 included:
- May 21: 22.0 µg/m³
- May 22: 29.0 µg/m³
- May 25: 26.0 µg/m³
- May 29: 26.0 µg/m³
- May 30: 26.0 µg/m³
Public awareness about Delhi Air Quality is essential for community action against pollution.
Key Takeaways for Policy and Public Health
May 2026 serves as a benchmark for future improvements in Delhi Air Quality.
- Averages Over-Simplify the Narrative: Relying purely on an overall 5-month metric (+2.68% change) hides the massive improvements achieved in the spring and summer. Environmental reporting must highlight seasonal dynamics to remain accurate.
- Unprecedented Spring/Summer Cleanliness: The nearly 29% reduction in PM2.5 during May indicates that meteorology or localized control measures drastically altered the typical pre-monsoon dust-and-smog baseline.
- Winter Remains a Rigid Challenge: Despite the cleaner summer, the intense peaks in January (388.0 µg/m³) prove that the winter meteorological trap remains as severe as ever.
Data Statement & Pollutant Disclaimer: The analysis in this blog is strictly based on daily PM2.5 records provided by www.aqi.in, evaluating the period from January 1st to 31st May, 2026, against the corresponding 6-year multi-year historical average (2020–2025). This dataset completely excludes PM10 data; readers should note that PM10 trends may vary and are distinct from the fine PM2.5 fractions analyzed here.
 Shakshi
 Deepshikha Deb
 Poorna Khanna
 Manasvi Kumar
 Livia Machado
 Purandhi Mittal
 Shikhar Verma
 Nandini