Hiran Magri Air Quality Index (AQI) | Air Pollution
Real-time PM2.5, PM10 air pollution level in Udaipur
Last Updated: 21 Oct 2025, 02:04am (Local Time)

22 °C
ClearHiran Magri
Trending in India
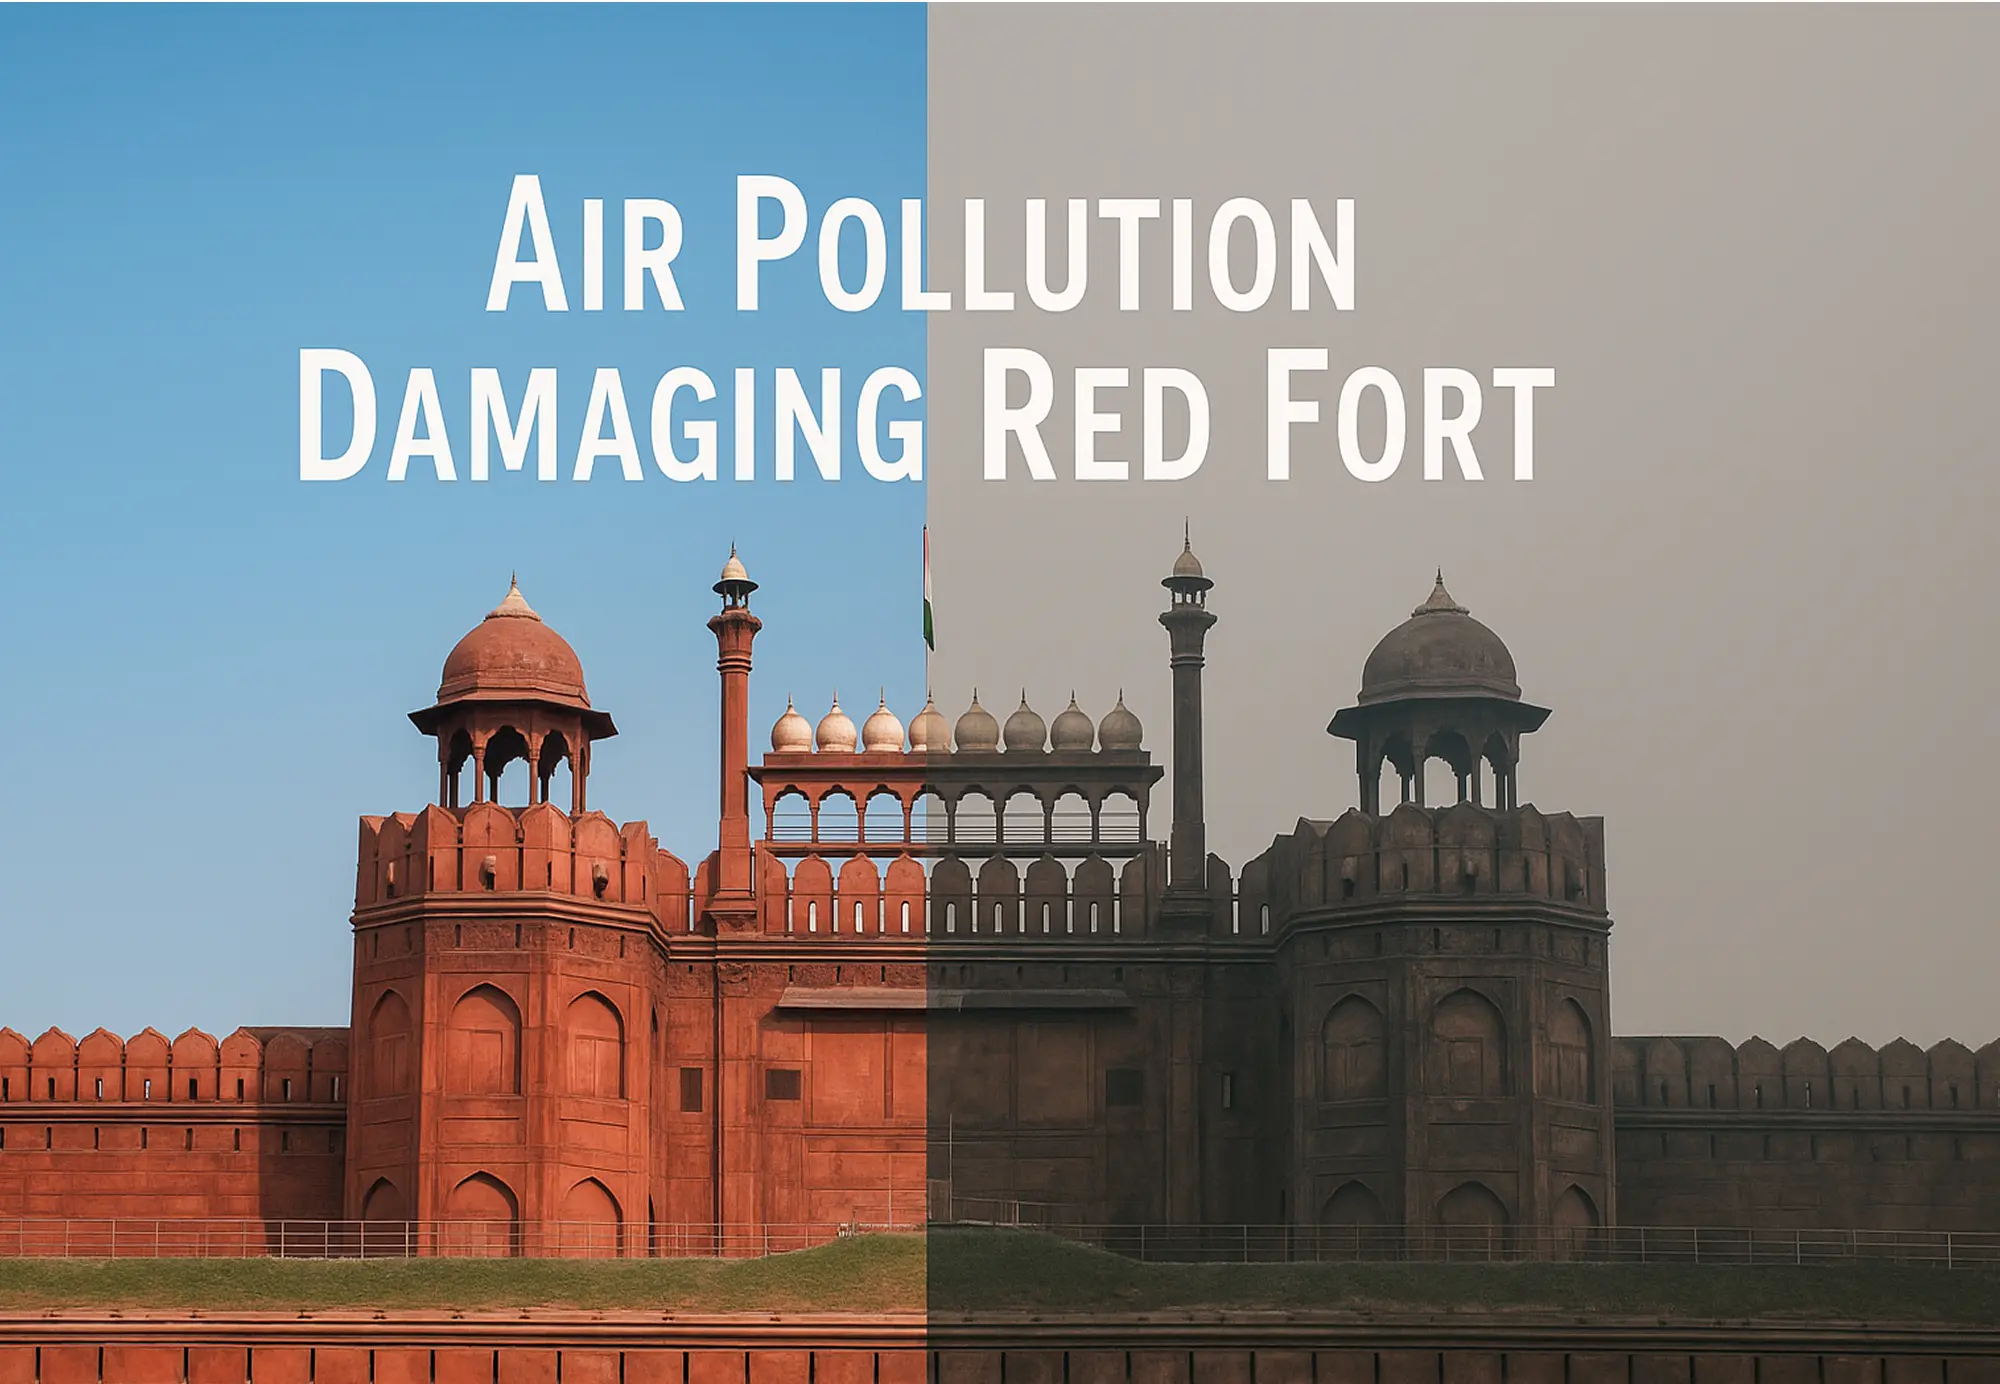
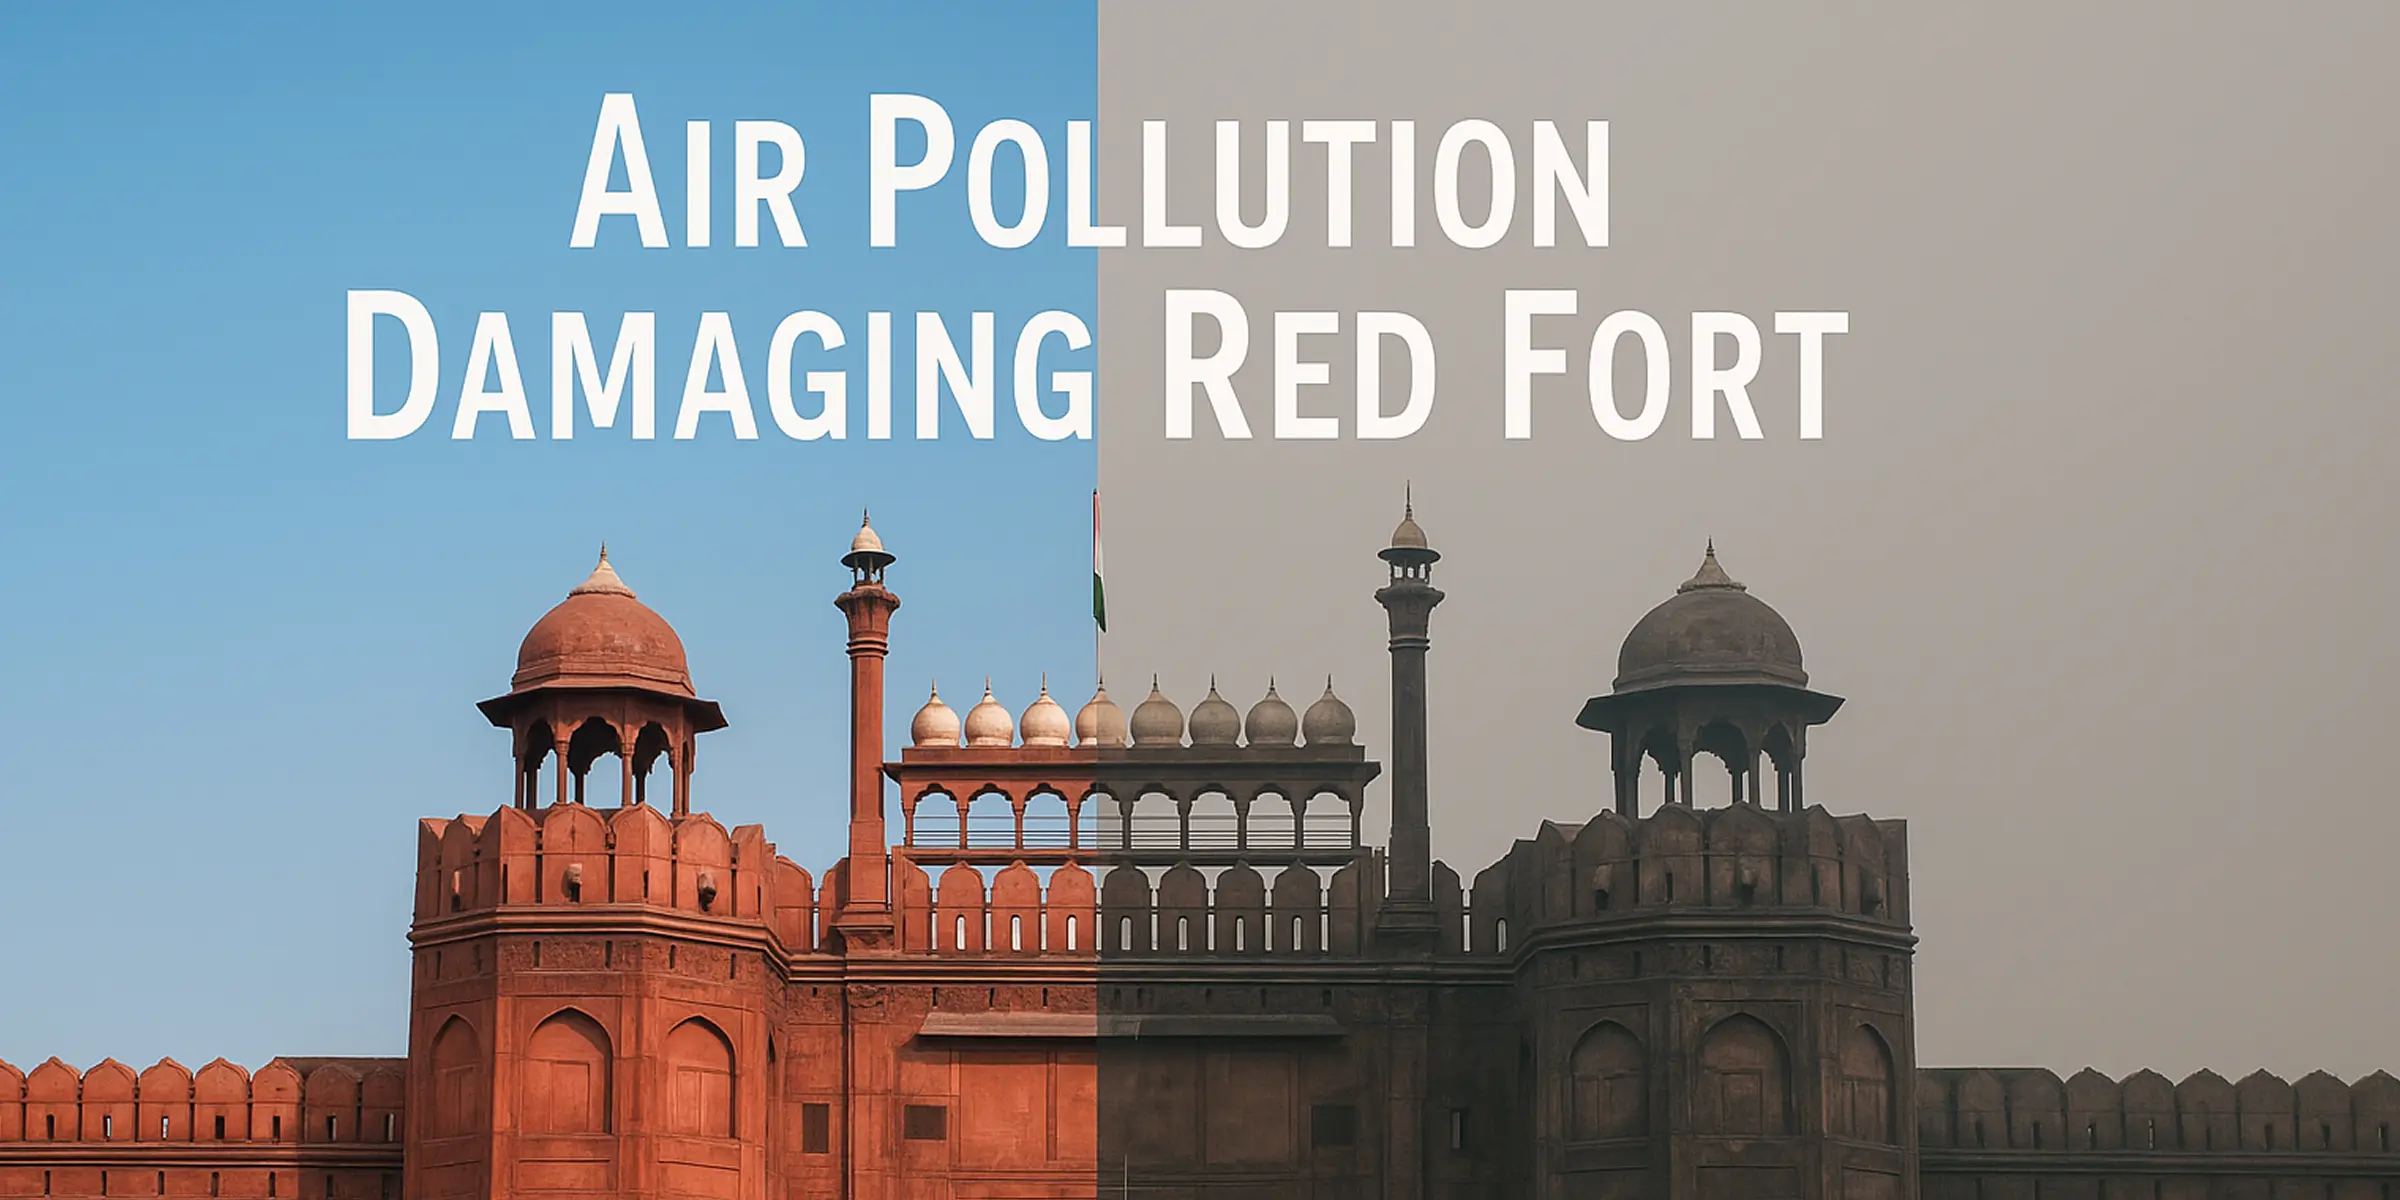
Red Fort in Delhi is Not Red Anymore! It is Turning Black: Air Pollution Damaging Red Fort
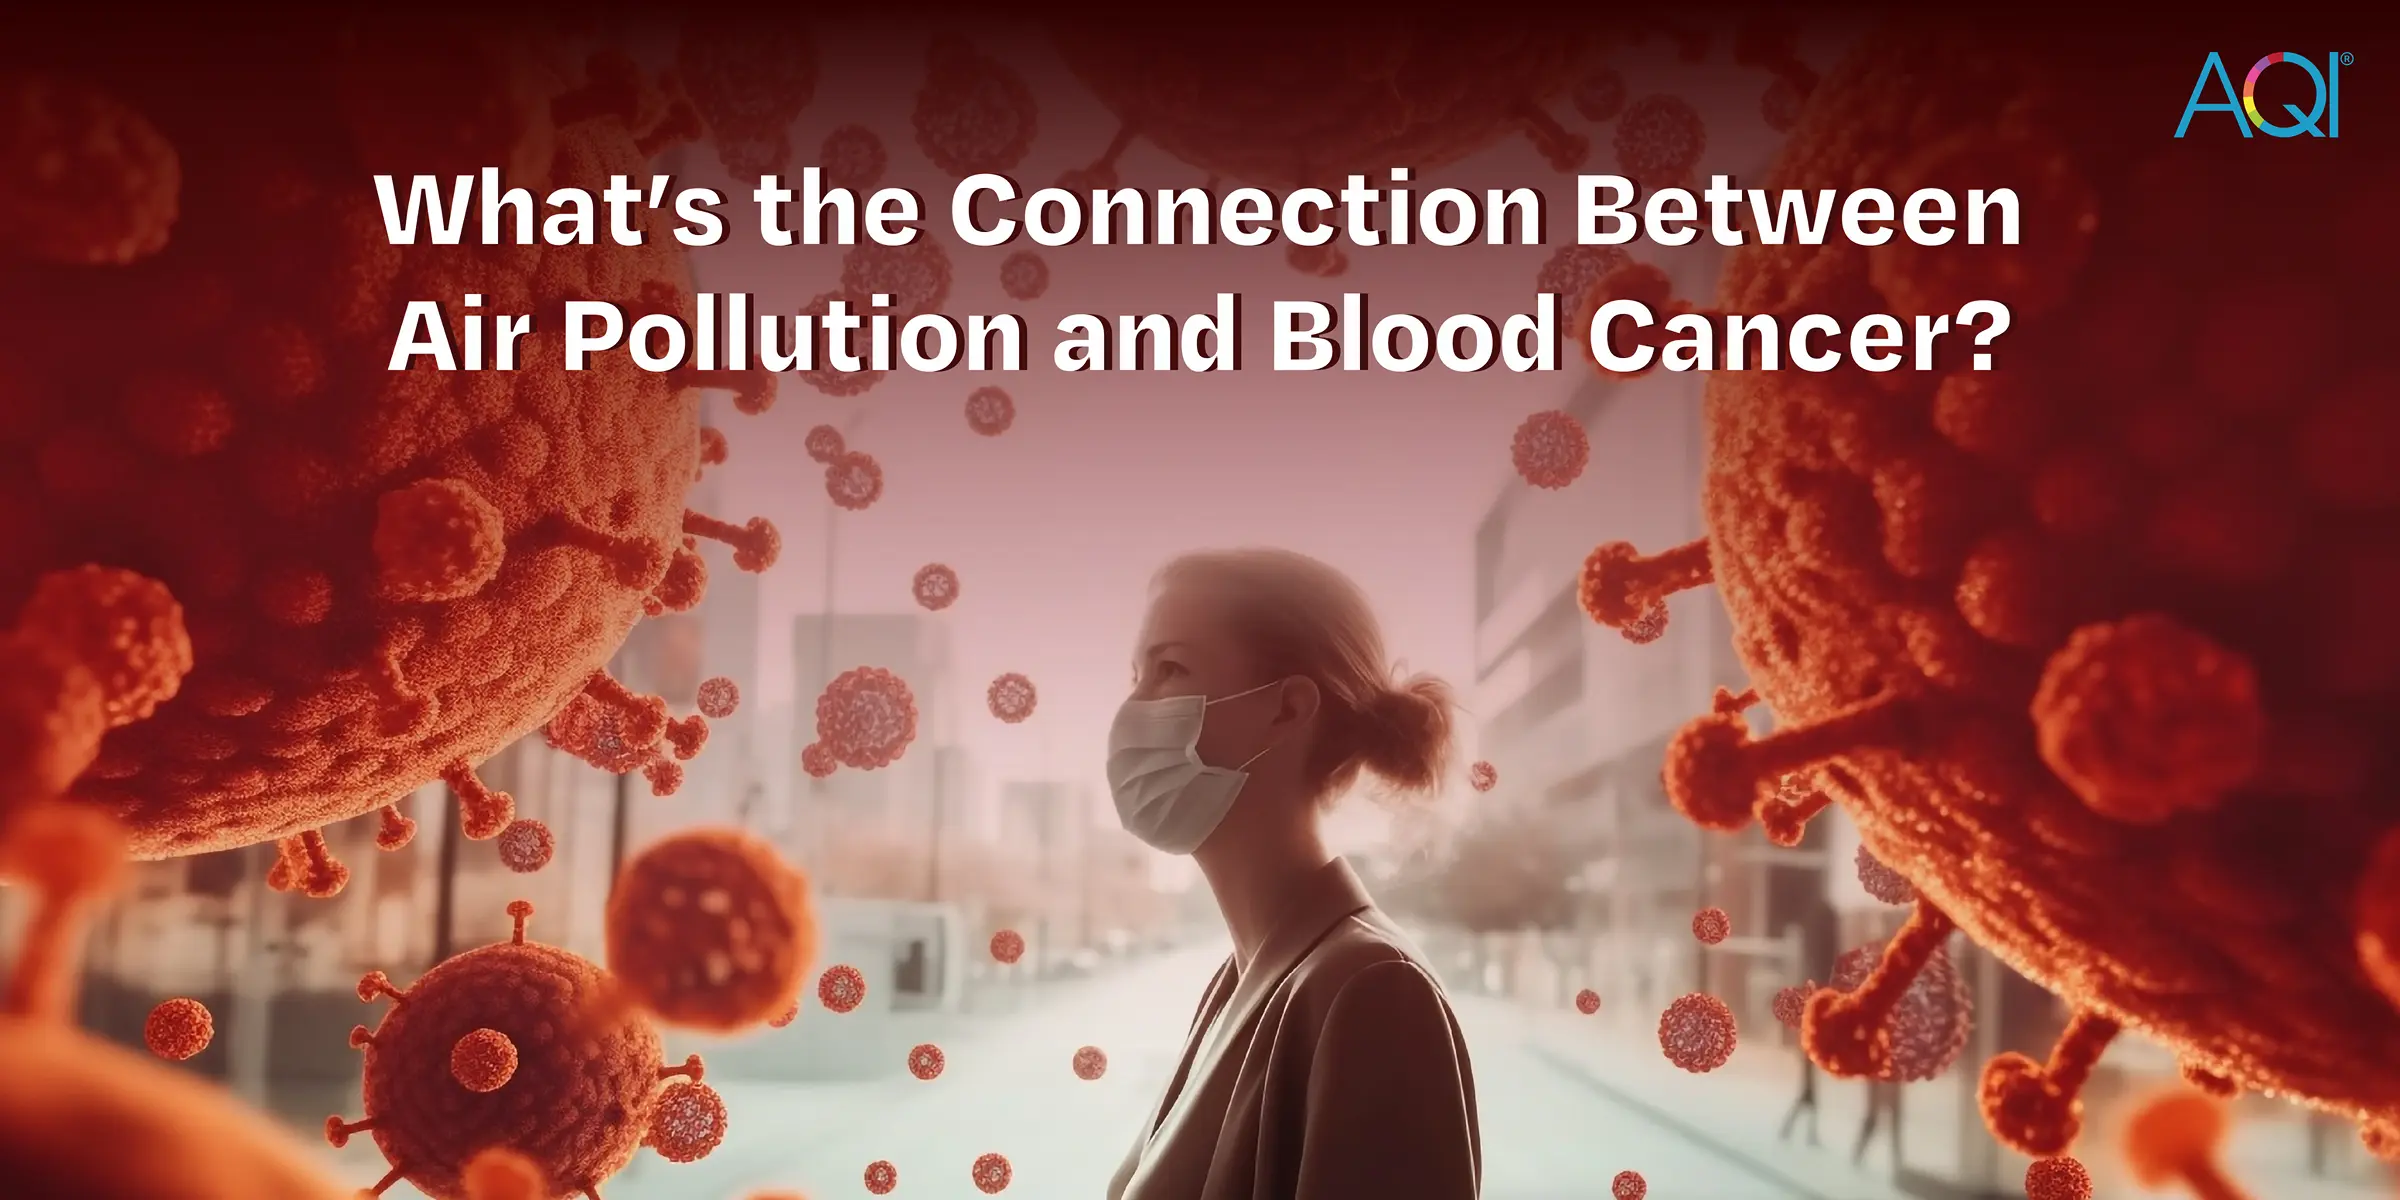
What’s the Connection Between Air Pollution and Blood Cancer?
AQI Graph
Historical Air Quality Data
Hiran Magri
Download 2024 Annual Data
World Air Quality Report

AQI Trends - Annual Air Quality Changes
Hiran Magri, Udaipur, Rajasthan, India
Annual AQI Trends
Most & Least Polluted Months
* This data analysis is from year 2020 - 2025
Air Quality Calendar 2025
Hiran Magri
Air Quality Solutions For Hiran Magri
Explore the solutions of air quality monitoring & clean air.
Here are some applications that you can go through to find out the solutions.


Hiran Magri's AQI Data Analytics Solutions
Air quality data monitoring platforms

Your area’s real-time data with detailed parameters.
Personalized health advice as per current AQI.
Analytical data to identify trends and conditions.
Connect and control your air quality devices.
Recent AQI Blogs
Read the latest news
Here are some latest blogs that you can go through to find out more air pollution.