AQI Logo
AQI Logo
  • Ranking
  • Products
  • Resources

AQI Standard
AQI-USAQI-US

Preferred Language
English-INEnglish-IN


AQI Logo

Real-time Air quality and Weather data around the world

  • About AQI
  • About Us
  • Contact Us
  • AQI Monitor
  • Air Quality Blog
  • Climate Change
  • Community AQI Monitor
  • World Air Quality Report
  • Air Quality
  • AQI App
  • AQI TV App
  • AQI Map
  • AQI APIs
  • AQI Widgets
  • Web Dashboard
  • Rankings
  • Live AQI City Ranking
  • Historic AQI City Ranking
  • Historic AQI Country Ranking
  • Weather Ranking
  • Location
  • +91 73918 73918 icon+91 73918 73918
  • info@purelogic.in icon[email protected]
  • 706, 7th Floor, Crown Heights, Rohini Sec-10, Delhi 110085, INDIA icon706, 7th Floor, Crown Heights, Rohini Sec-10, Delhi 110085, INDIA
  • Support Desk
  • Find us on:
  • instagram icon
  • twitter (X) icon
  • linkedin icon
  • youtube icon
  • facebook icon

Terms & Conditions

Privacy Policy

© 2025 AQI, All rights reserved

Want to Buy AQI Monitor?Get a FREE AQI Monitor to Join the Community
MapMap
Climate ChangeClimate Change
Near Me?Near Me?
  • Dashboard
  • United States
  • California
California
AQIPM2.5PM10COSO2NO2O3
View aqi DataAQIView weather DataWeather
Live

California Air Quality Index (AQI) | Air Pollution

Real-time PM2.5, PM10 air pollution level in United States

Last Updated: 2 seconds ago (Local Time)

location image
Live AQI
36
Air Quality is
Good
pm10 :  25 µg/m³
PM2.5 :  7 µg/m³
Good
050
Moderate
100
Poor
150
Unhealthy
200
Severe
300
Hazardous
301+
aqi good level.webp in California
clear

17 °C

Clear
Humidity
Humidity68 %

Wind Speed
Wind Speed9 km/h

UV Index
UV Index0
Last Updated: 2 seconds ago (Local Time)
AQI LogoMap

California

Major Air Pollutants

California

PM2.5's Icon

Particulate Matter(PM2.5)

7µg/m³

PM10's Icon

Particulate Matter(PM10)

25µg/m³

CO's Icon

Carbon Monoxide(CO)

45ppb

SO2's Icon

Sulfur Dioxide(SO2)

1ppb

NO2's Icon

Nitrogen Dioxide(NO2)

5ppb

O3's Icon

Ozone(O3)

31ppb

Trending in United States

Why You Should Be Monitoring Air Quality During Monsoon — Not Just in Winter?

Why You Should Be Monitoring Air Quality During Monsoon — Not Just in Winter?

Air Pollution and Lung Cancer: How Toxic Air is Mutating Your DNA?

Air Pollution and Lung Cancer: How Toxic Air is Mutating Your DNA?

City Climate Change Severity Analysis is NOW LIVE on AQI.in!📢

City Climate Change Severity Analysis is NOW LIVE on AQI.in!📢

AQI Graph

Historical Air Quality Data

California

24 Hours
AQI
California
AQI
.
15-07-2025Time16-07-2025
TimeCalifornia
02 AM39
03 AM38
04 AM34
05 AM34
06 AM34
07 AM35
08 AM35
09 AM35
10 AM36
11 AM37
12 PM38
01 PM39
02 PM39
03 PM40
04 PM39
05 PM39
06 PM39
07 PM38
08 PM38
09 PM39
10 PM38
11 PM38
12 AM38
01 AM37
02 AM36
34
Min.at 4:10 AM on 15th Jul
40
Max.at 3:09 PM on 15th Jul

Want air quality data?

AQI Logo

Download 2024 Annual Data

World Air Quality Report

Globe

California's Cities

Real-time Air Pollution Level

Location
Status
AQI
PM2.5(µg/m³)
PM10(µg/m³)
Temp.(°C)
Humi.(%)
Alameda
Good
25
5
12
16
85
Alpine
Good
33
6
28
25
52
Alta Sierra
Moderate
51
9
35
22
52
Anaheim
Good
19
3
10
20
80
Anderson
Good
42
8
25
21
61
Antioch
Good
26
5
13
17
76
Arden Arcade
Good
24
4
14
18
65
Arroyo Grande
Good
20
4
10
20
82
Arvin
Good
50
9
42
21
53
Atascadero
Good
19
3
12
18
79
Auburn
Good
44
8
47
23
53
August
Good
22
4
12
17
80
Bakersfield
Good
48
9
30
22
58
Banning
Good
38
7
33
26
47
Barstow
Good
44
8
36
26
48
Ben Lomond
Good
30
5
32
22
57
Benicia
Good
45
6
49
17
82
Berkeley
Good
23
4
13
16
85
Big Pine
Moderate
51
9
24
15
37
Bishop
Good
41
7
21
14
36
Blythe
Good
32
6
21
23
72
Brawley
Moderate
56
10
65
28
62
Bromela
Good
21
4
10
20
82
Burbank
Good
36
6
22
18
82
Calexico
Good
50
9
46
26
69
Calipatria
Moderate
53
10
55
29
60
Camp Pendleton South
Good
24
4
12
22
76
Capitan
Good
27
5
20
22
76
Carmel Valley
Good
19
3
16
21
59
Carpinteria
Good
28
5
14
19
78
Carson
Good
20
4
10
20
83
Cartago
Good
44
8
27
18
37
Chester
Good
40
7
22
14
38
Chico
Good
42
8
26
22
58
Chiriaco Summit
Moderate
53
10
36
26
49
Chula Vista
Good
34
6
22
21
77
Cloverdale
Good
28
5
22
22
59
Clovis
Good
47
9
36
24
53
Colfax
Good
44
8
35
22
52
Colusa
Good
42
7
19
20
64
Compton
Good
21
4
10
19
84
Concord
Good
29
5
17
18
64
Contra Costa Centre
Good
24
4
15
18
68
Corcoran
Moderate
56
12
36
23
56
Corning
Good
42
8
24
22
60
Coronado
Good
26
5
16
24
73
Crescent City
Good
27
5
17
20
67
Crestline
Moderate
56
12
40
22
42
Dublin
Good
31
5
34
22
57
East Porterville
Moderate
53
10
30
22
50
East Rancho Dominguez
Good
23
4
11
18
84
Eastern Goleta Valley
Good
47
8
38
27
47
Edison
Good
37
7
26
19
74
El Cajon
Good
29
5
14
20
77
El Centro
Good
41
7
45
26
67
El Rio
Good
32
6
13
18
85
Elk Grove
Good
23
4
14
18
68
Emeryville
Good
24
4
12
16
85
Eureka
Good
36
6
14
20
62
Fairfield
Good
24
4
13
17
74
Felton
Good
31
5
34
22
57
Fillmore
Good
36
7
23
18
83
Florence Graham
Good
27
5
12
21
76
Folsom
Good
26
5
21
22
59
Fontana
Good
39
7
20
28
40
Foresta
Good
43
8
37
17
38
Fortuna
Good
44
8
22
21
64
French Valley
Poor
105
13
164
26
48
Fresno
Moderate
52
10
40
23
54
Fullerton
Good
19
3
10
21
80
Galt
Good
24
4
12
17
76
Gardena
Good
23
4
10
18
81
Gilroy
Good
26
5
25
22
56
Glendora
Good
34
6
17
19
77
Goleta
Good
28
5
10
18
86
Grass Valley
Good
46
8
37
21
52
Gridley
Good
34
6
19
20
62
Half Moon Bay
Good
23
4
16
17
79
Hanford
Moderate
56
11
58
23
53
Hayward
Good
37
7
20
20
64
Healdsburg
Good
24
4
16
18
63
Hesperia
Moderate
54
11
37
21
38
Hidden Valley Lake
Good
35
6
21
22
57
Hollister
Good
22
4
11
21
60
Huntington Park
Good
23
4
10
21
80
Huron
Good
45
8
26
24
52
Indio
Moderate
53
10
44
24
73
Jackson
Good
32
6
24
23
53
Jurupa Valley
Good
32
6
19
18
84
Keeler
Good
48
8
24
18
37
Kernville
Moderate
55
11
39
23
48
King City
Good
24
4
15
22
53
La Habra
Good
24
4
10
21
73
Lake Elsinore
Moderate
52
10
35
26
50
Lakeport
Good
31
6
24
23
53
Lancaster
Good
39
7
22
25
46
Lebec
Good
44
8
42
20
38
Lee Vining
Good
34
6
17
17
48
Lincoln
Good
27
5
16
20
59
Live Oak
Good
19
3
16
17
75
Live Oak Springs
Good
49
9
34
22
47
Livermore
Good
28
5
22
21
60
Lomita
Good
22
4
10
19
81
Lompoc
Good
21
4
10
18
86
Lone Pine
Good
46
8
21
20
40
Long Beach
Good
22
4
10
20
82
Los Angeles
Good
27
5
14
20
77
Los Gatos
Good
33
6
34
22
57
Lucerne Valley
Good
50
9
28
21
37
Madera
Moderate
53
10
41
23
53
Magalia
Good
35
6
27
18
40
Mammoth Lakes
Good
46
8
25
16
43
Manteca
Good
33
6
18
18
77
Maricopa
Good
31
6
17
20
72
Mayfair
Moderate
55
11
43
23
54
Mckinleyville
Good
36
6
19
21
59
Mecca
Moderate
57
9
68
27
64
Mendota
Good
33
6
26
22
53
Merced
Good
37
7
29
21
57
Miramonte
Moderate
58
13
30
17
40
Mock
Good
48
9
20
18
37
Modesto
Good
32
6
22
20
63
Mojave
Good
43
8
30
24
48
Mono County
Good
41
7
20
18
43
Morro Bay
Good
27
5
16
23
59
Mount Shasta
Good
46
8
27
19
39
Napa
Good
21
4
13
17
80
Nipomo
Good
21
4
12
20
77
North Auburn
Good
43
8
44
23
51
North Fair Oaks
Good
21
4
12
16
83
North Shore
Moderate
52
9
59
27
65
Oakland
Good
30
6
14
16
84
Oakley
Good
23
4
13
17
82
Oceano
Good
19
3
9
18
80
Ojai
Good
23
4
20
18
82
Olancha
Good
45
8
23
20
39
Ontario
Good
35
6
20
21
72
Orange Cove
Moderate
53
11
38
19
49
Orcutt
Good
21
4
10
23
62
Orland
Good
39
7
26
22
59
Oroville
Good
36
6
23
22
58
Paicines
Good
39
7
19
21
64
Palm Springs
Good
38
7
28
19
82
Paradise
Good
41
7
26
22
54
Park Village
Good
48
9
34
23
55
Parlier
Good
47
8
35
23
53
Pasadena
Good
27
5
21
18
82
Paso Robles
Good
25
5
13
18
80
Pico Rivera
Good
25
4
10
21
76
Piru
Good
36
7
23
18
83
Placerville
Good
45
8
38
22
54
Pleasanton
Good
31
5
34
22
57
Poleta
Good
47
8
19
16
37
Pomona
Good
32
6
18
19
76
Porterville
Moderate
54
11
26
22
58
Portola
Good
35
5
38
13
38
Quincy
Good
33
6
27
18
37
Rancho Calaveras
Good
39
7
20
21
57
Red Bluff
Good
44
8
31
20
54
Redding
Good
48
9
22
21
59
Redlands
Moderate
75
13
105
26
46
Redwood City
Good
19
3
13
16
83
Ridgecrest
Good
47
9
26
21
41
Rio Vista
Good
26
5
13
17
74
Riverside
Good
28
5
17
18
84
Rosamond
Good
49
9
31
25
49
Roseville
Good
28
5
14
21
60
Sacramento
Good
25
4
13
17
71
Salinas
Good
22
4
16
17
76
Salton City
Moderate
51
10
50
28
61
San Andreas
Good
31
6
19
21
61
San Bernardino
Good
36
6
29
29
47
San Diego
Good
29
5
21
21
77
San Francisco
Good
30
5
12
16
84
San Jose
Good
30
5
18
18
72
San Juan Bautista
Good
26
5
21
22
58
San Leandro
Good
26
5
14
17
80
San Luis Obispo
Good
22
4
12
22
70
San Martin
Good
44
8
37
22
55
San Pablo
Good
24
4
13
17
84
San Rafael
Good
23
4
12
16
84
Santa Barbara
Good
28
5
10
18
86
Santa Clarita
Good
46
8
34
25
50
Santa Cruz
Good
20
4
17
17
74
Santa Margarita
Moderate
58
8
70
25
49
Santa Maria
Good
21
4
13
22
69
Santa Ynez
Good
22
4
21
18
83
Searles Valley
Moderate
51
9
45
25
54
Seaside
Good
17
3
15
22
57
Sebastopol
Good
21
4
14
17
62
Shafter
Good
42
7
26
23
55
Shandon
Good
43
8
29
25
48
Shasta Lake
Good
44
8
24
20
50
Signal Hill
Good
21
4
10
20
80
Simi Valley
Good
38
7
18
23
58
Sonora
Good
45
8
38
19
46
South Gate
Good
21
4
10
18
81
South Lake Tahoe
Good
33
6
18
17
39
Springville
Moderate
53
10
23
23
55
St Helena
Good
27
5
21
21
61
Stockton
Good
32
6
14
17
77
Summertown
Good
39
7
22
18
38
Susanville
Good
44
8
26
14
40
Tahoe City
Good
27
5
19
17
40
Temecula
Good
44
4
48
31
37
Thousand Oaks
Good
32
6
20
18
84
Three Rivers
Moderate
53
10
34
25
53
Topanga
Good
32
6
21
18
83
Tracy
Good
29
6
20
20
59
Truckee
Good
32
6
21
17
40
Turlock
Good
34
6
26
19
62
Ukiah
Good
29
5
20
20
64
University Of California Davis
Good
40
6
32
17
68
Upland
Good
48
9
38
25
48
Vacaville
Good
18
3
15
18
60
Vallejo
Good
36
6
31
17
78
Vandenberg Village
Good
21
4
15
18
81
Victorville
Moderate
58
13
42
26
43
Visalia
Moderate
52
10
30
23
53
Weaverville
Moderate
52
10
23
22
53
Westmorland
Moderate
57
10
68
28
62
Willits
Good
30
6
24
22
53
Willows
Good
38
7
25
22
57
Wilton
Good
21
4
16
20
62
Windsor
Good
22
4
14
18
64
Winters
Good
24
4
20
22
58
Woodlake
Good
50
9
30
22
54
Woodland
Good
45
6
50
17
70
Yosemite Lakes
Moderate
52
9
47
21
46
Yreka
Good
38
7
23
21
50
Yuba City
Good
28
5
17
20
64
Yucca Valley
Moderate
53
10
38
21
47

United States's Metro Cities

Air Quality Index

Chicago City AQI

Chicago

49

temp.27°C

hum.76%
Los Angeles City AQI

Los Angeles

27

temp.18°C

hum.78%
Minneapolis City AQI

Minneapolis

42

temp.21°C

hum.93%
Nashville City AQI

Nashville

35

temp.26°C

hum.79%
New Orleans City AQI

New Orleans

38

temp.28°C

hum.88%
New York City City AQI

New York City

34

temp.26°C

hum.82%
San Francisco City AQI

San Francisco

30

temp.16°C

hum.80%
Washington City AQI

Washington

28

temp.26°C

hum.88%

Health Advice For People Living In

California

0Cigarettes per day

Weekly 0 Cigarettes
Monthly 0 Cigarettes

Breathe easy and get active! The air quality is perfect for enjoying outdoor activities.

Source:

Berkeley Earth


Solutions for Current AQI

  • Air Purifier
    Air PurifierTurn Off
  • Car Filter
    Car FilterAdvisable
  • N95 Mask
    N95 MaskAdvisable
  • Stay Indoor
    Stay IndoorAdvisable


As per the current AQI, turn off the air purifier.

Get an Air Purifier

Prevent Health Problems: Understand Your Risks

California

  • asthma due to air pollution in CaliforniaAsthma
  • heart due to air pollution in CaliforniaHeart Issues
  • allergy due to air pollution in CaliforniaAllergies
  • sinus due to air pollution in CaliforniaSinus
  • flu due to air pollution in CaliforniaCold/Flu
  • copd due to air pollution in CaliforniaChronic (COPD)
asthma due to air pollution in California

Low Chances of Asthma

Asthma

Risk of Asthma symptoms is Low when AQI is Good (0-50)

Mild symptoms such as slight wheezing, occasional cough, and minor shortness of breath

Do's :

  • Keep track of air quality to plan outdoor activities safely.

  • Drink water to keep airways moist and reduce irritation.

  • Include non-allergenic fruits and vegetables that support overall lung health, like apples, pears, and spinach.

Don'ts :

  • Skip medications that is prescribed by your doctor.

  • Engage in outdoor activities in early morning during high pollen hours.

Most Polluted Cities 2025

United States

Analyze the real-time most air polluted cities in the country.

Most Polluted Cities Live Ranking 2025
World's Most PollutedCity Rankings (2024)
World's Most PollutedCountry Rankings(2024)
RankCityAQIAQI Status

Standard Value

Follow

1.

Gilbert, United States

178
Unhealthy
12xabove Standard

2.

Sacaton, United States

177
Unhealthy
12xabove Standard

3.

Stanfield, United States

162
Unhealthy
11xabove Standard

4.

Fountain Hills, United States

155
Unhealthy
10xabove Standard

5.

Casa Grande, United States

151
Unhealthy
10xabove Standard

6.

Casa Blanca, United States

148
Poor
10xabove Standard

7.

Eloy, United States

144
Poor
10xabove Standard

8.

San Tan Valley, United States

140
Poor
9xabove Standard

9.

Maricopa, United States

138
Poor
9xabove Standard

10.

Fort McDowell, United States

136
Poor
9xabove Standard

Last Updated: 16 Jul 2025, 07:39 AM

AQI City Rankings

Air Quality Solutions For California

Explore the solutions of air quality monitoring & clean air.

Here are some applications that you can go through to find out the solutions.

Air Quality Monitor

Air Quality Monitor

Monitor the air quality
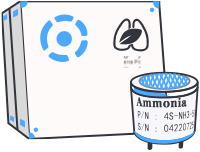
Air Quality Sensors

Air Quality Sensors

Sensors to measure the air quality
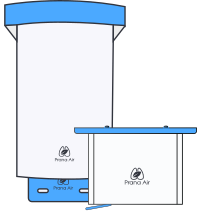
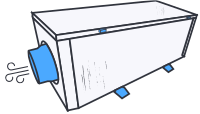
Fresh Air Machine

Fresh Air Machine

Clean the air you breathe
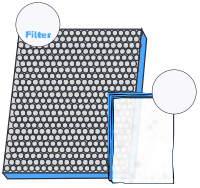
Car Cabin Filter

Car Cabin Filter

Purify the air in your car
N95 Mask

N95 Mask

Shield yourself from pollution
air quality solutions for offices for California

Air Quality Solution For Offices

A complete solution for air quality monitoring, data analysis, and fresh air solutions in workplaces prioritizing employee's health and productivity.

air quality solutions for smart-city for California

Air Quality Solutions For Smart City

Prana Air smart city project provides air quality monitors, drones, outdoor air purifiers, and data dashboards solution to improve air quality.

air quality solutions for institutes for California

Air Quality Solutions for Schools | Institutes

Prana Air provides the air quality solutions for schools by air monitoring & fresh air machine that help the students to breather clean air.

air quality solutions for hotels for California

Air Quality Solutions For Hotels

Prana Air air quality solutions are suited for hotel businesses. The occupancy of hotels is the main reasons for bad air quality.

air quality solutions for restaurants for California

Air Quality Solutions for Restaurants

Prana Air has the air quality solutions for restaurant, cafes, and gives you the power to know what your customers and staff breathe.

air quality solutions for rmc-plants for California

Air Quality Solutions for RMC Plants

Prana Air provides air quality monitoring solutions for RMC plants. Improve compliance, protect workers and community, and reduce emissions.

air quality solutions for fitness-center for California

Air Quality Solutions for Fitness Center

Prana Air provides the air quality solutions of pollution monitoring and fresh air for fitness center - gym.

air quality solutions for parking-lot for California

Air Quality Solutions for Parking Lot

A complete solution for air monitoring, data analysis, and fresh air solutions for enclosed car parking areas and car lots.

air quality solutions for retail-stores for California

Air Quality Solutions for Retail Stores

Prana Air provides air quality solutions of pollution monitoring and fresh air for retail stores and shopping outlets.

air quality solutions for airport for California

Prana Air provides air quality solutions of pollution monitoring and fresh air for retail stores and shopping outlets

Prana Air provides the air quality solutions for airport. Gathering of many passengers is the main reasons of bad air quality in airport.

air quality solutions for construction-sites for California

Air Quality Solutions For Construction Sites

Prana Air offers air quality monitoring solutions for construction sites with data cloud storage, web-dashboard, mobile apps, TV display.

air quality solutions for hospitals for California

Air Quality Solutions For Hospitals

Prana Air provides air quality monitoring and fresh air solutions for hospitals to ensure clean and healthy indoor air.

air quality solutions for bathroom for California

Air Quality Solutions For Washroom | Bathroom

Improve washroom and bathroom air quality with Prana Air air quality monitoring devices and fresh air machine. Breathe easy and stay healthy.

air quality solutions for banks for California

Air Quality Solutions for Banks

Prana Air provides air quality solutions of pollution monitoring and fresh air for banks and financial institutions.

air quality solutions for cinema for California

Air Quality Solutions for Cinema

Air quality solutions for cinema halls or theatres will help the customers to get the good experience, comfort and breathe clean air.

air quality solutions for real-estates for California

Air Quality Solutions For Real Estates

Prana Air provides the air quality solutions of pollution monitoring and fresh air for real estates - residential and commercial.

California's AQI Data Analytics Solutions

Air quality data monitoring platforms

Mobile AppMobile App
Smart TV AppSmart TV App
Web DashboardWeb Dashboard
APIAPI
WidgetsWidgets
aqi air quality app for California
Mobile App

Empower Your Decisions with Reliable Data

Get it onApp Store
Get it onGoogle Play
Your area’s real-time data with detailed parameters.

Your area’s real-time data with detailed parameters.


Personalized health advice as per current AQI.

Personalized health advice as per current AQI.


Analytical data to identify trends and conditions.

Analytical data to identify trends and conditions.


Connect and control your air quality devices.

Connect and control your air quality devices.


Air Quality FAQs

at California

Frequently Asked Questions About Air Quality

What is the current AQI level in California?

The current real-time AQI level in California is 36 (Good). This was last updated 2 seconds ago (Local Time).

When was the best AQI level in California in the last 24 hours?

The best AQI level was 34 (Good) at 4:10 AM, Jul 15, 2025 (Local Time) during the last 24 hours.

When was the worst AQI level in California in the last 24 hours?

The worst AQI level was 40 (Good) at 3:09 PM, Jul 15, 2025 (Local Time) during the last 24 hours.

What is the current trend of AQI levels in California during last 24 hours?

The AQI levels in California have been fluctuating throughout the last 24 hours. The levels have increased by highest 40 at 3:09 PM, Jul 15, 2025 (Local Time), lowest 34 at 4:10 AM, Jul 15, 2025 (Local Time).

What actions are recommended as per the current AQI level in California?

The air quality is satisfactory, and air pollution poses little or no risk. No special precautions are needed; enjoy outdoor activities freely.

Recent AQI Blogs

Read the latest news

Here are some latest blogs that you can go through to find out more air pollution.
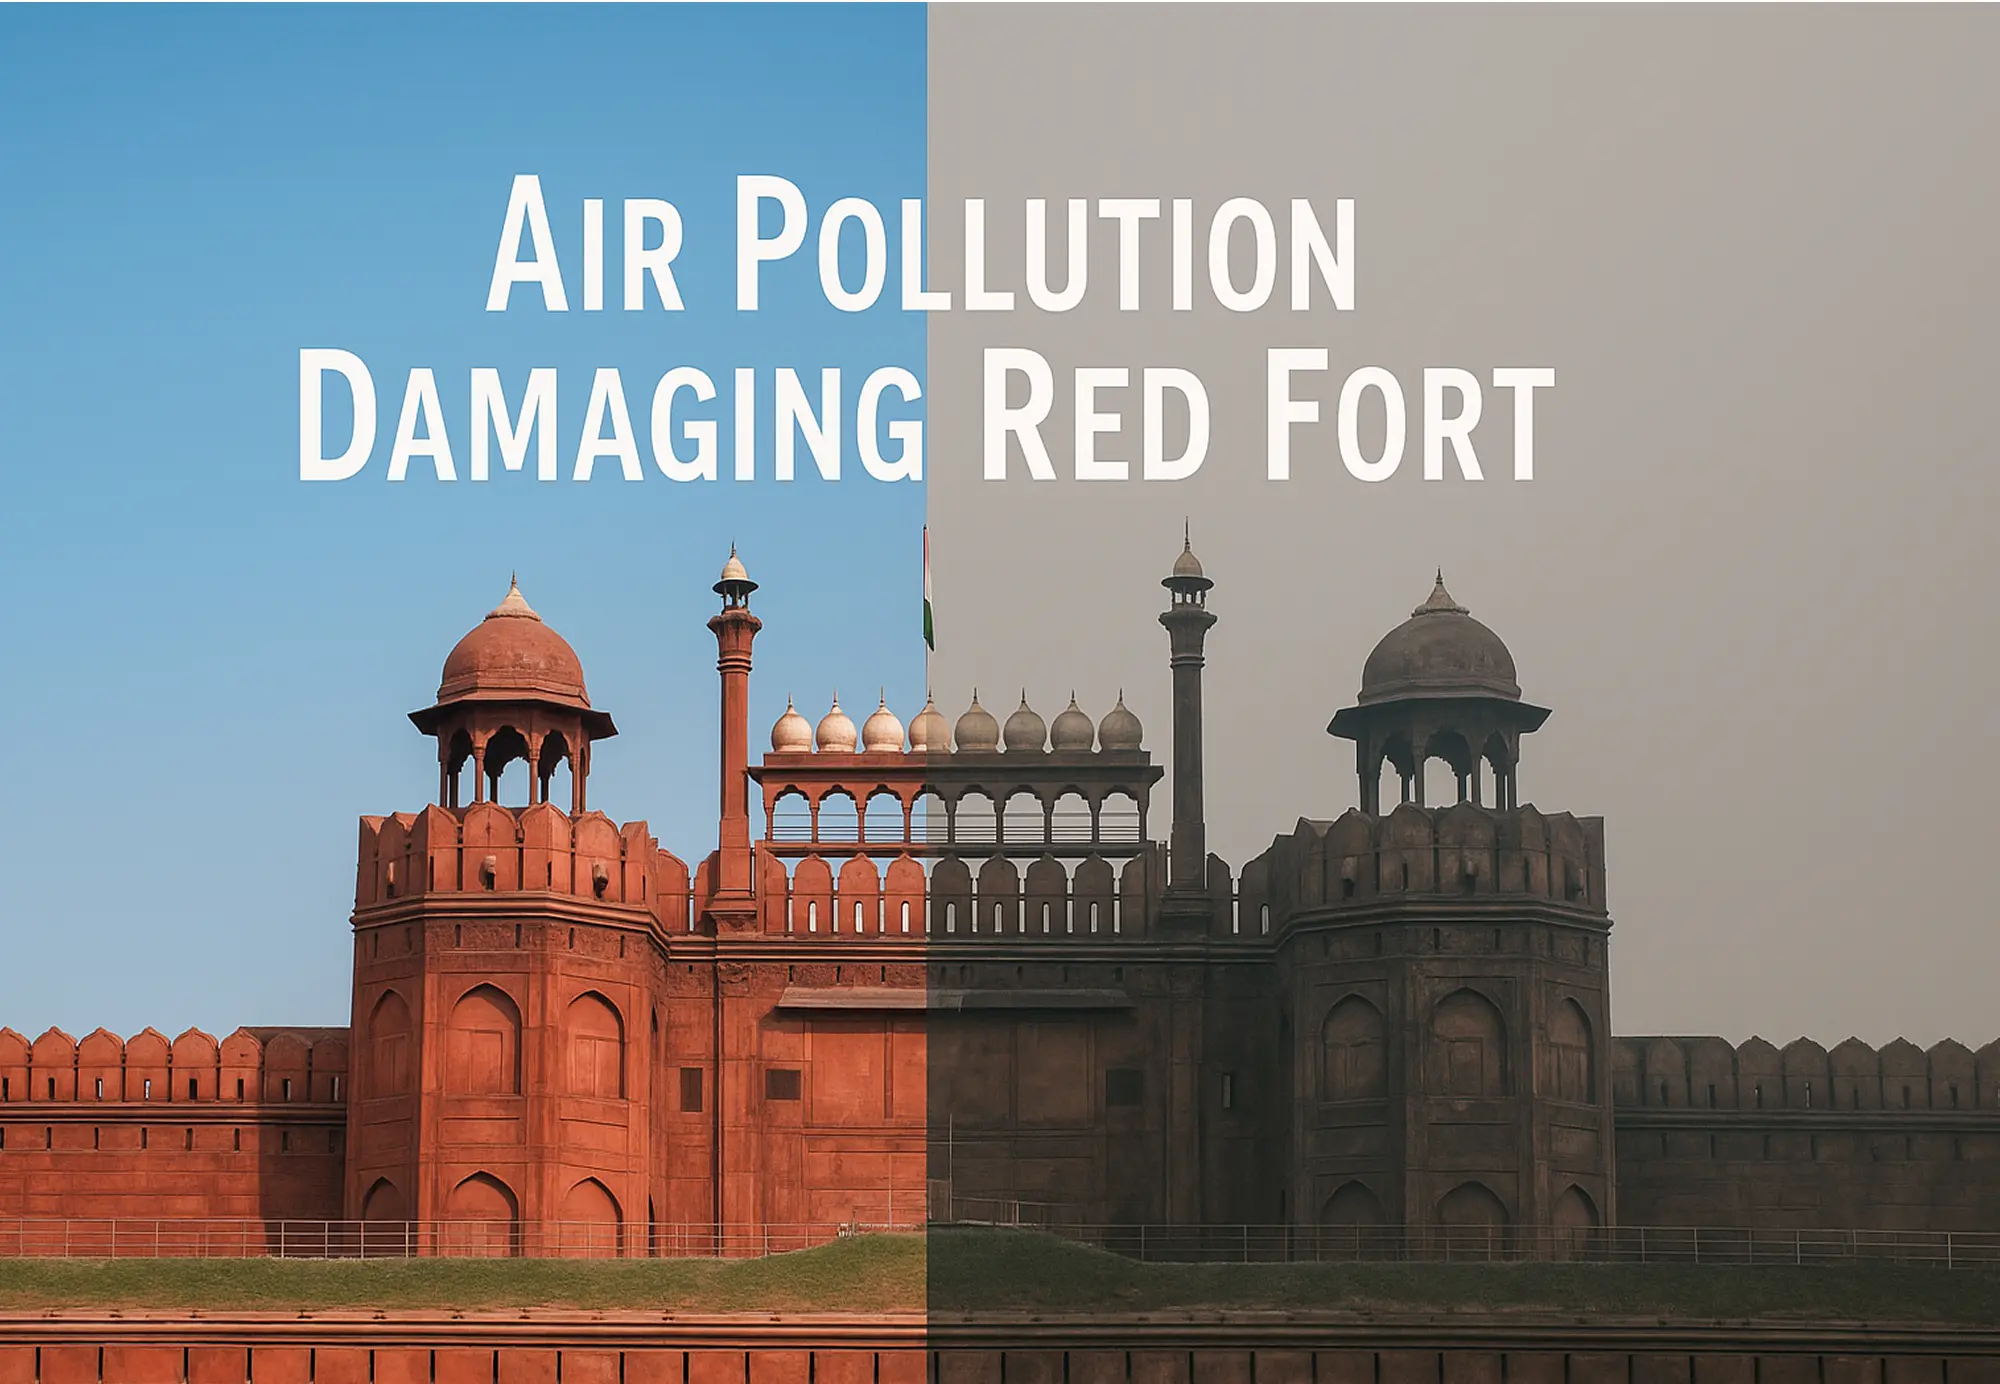
Do People Really Consider Air Pollution Before Moving to Delhi NCR?

Do People Really Consider Air Pollution Before Moving to Delhi NCR?

15 Jul 2025Shakshi
Is Poor Air Quality in Gyms Holding Back Your Fitness Goals?

Is Poor Air Quality in Gyms Holding Back Your Fitness Goals?

12 Jul 2025Shakshi
Air Pollution and Lung Cancer: How Toxic Air is Mutating Your DNA?

Air Pollution and Lung Cancer: How Toxic Air is Mutating Your DNA?

7 Jul 2025Shakshi
Can Banning Old Vehicles Really Improve Delhi’s Air Quality? Here’s What the Data Says

Can Banning Old Vehicles Really Improve Delhi’s Air Quality? Here’s What the Data Says

4 Jul 2025Gyane Haobijam
Arizona Dust Storm 2025: How the Sudden Storm Pushed AQI to Hazardous Levels?

Arizona Dust Storm 2025: How the Sudden Storm Pushed AQI to Hazardous Levels?

2 Jul 2025Shakshi
Air Pollution Comparison Between England vs India: What a 45% Asthma Spike in the UK Reveals

Air Pollution Comparison Between England vs India: What a 45% Asthma Spike in the UK Reveals

1 Jul 2025Shakshi
Urban Heat Islands in India: The 2024 Climate Crisis in Metro Cities

Urban Heat Islands in India: The 2024 Climate Crisis in Metro Cities

24 Jun 2025Shakshi
Delhi AQI Drops After Months: How Rain Provided Temporary Relief in Pollution Levels 

Delhi AQI Drops After Months: How Rain Provided Temporary Relief in Pollution Levels 

19 Jun 2025Shakshi
AQI.IN Launched First Ever City-Level Climate Change Severity Index -June 2025

AQI.IN Launched First Ever City-Level Climate Change Severity Index -June 2025

19 Jun 2025Gyane Haobijam
Noise Pollution in Ocean: The Silent Threat Beneath the Waves

Noise Pollution in Ocean: The Silent Threat Beneath the Waves

17 Jun 2025Shakshi
Prana Air Logo

Prana Sense

Air Quality Monitor

Air Quality Index depicts the extent of air pollution at a particular location.
Prana Sense Air Quality MonitorPrana Sense Air Quality Monitor
Prana Air Logo

Pocket PM

Air Quality Monitor

Know the air quality around you wherever you are with the Pocket monitor to get instant air quality insights.

Pocket PM Air Quality MonitorPocket PM Air Quality Monitor
Prana Air Logo

Cair +

Indoor Air Quality Monitor

Track indoor air quality with advanced connectivity and portability for real-time air quality data.

Cair + Indoor Air Quality MonitorCair + Indoor Air Quality Monitor