Banhore Carbon Monoxide (CO) Level
Jammu And Kashmir, India

0ppb
Last Updated: 2025-11-27 10:58:03 PM (Local Time)

Banhore
What is the Current CO Level?
Banhore
The current CO level in Banhore based on the average air quality level across the city is 0 ppb, making it healthy and safe for everyone.
The current CO level in Banhore is 3490x Below the recommended WHO guideline of 3490 ppb.
Trending in India
.png)
Ethiopia Volcano Eruption: Did the Ash Cloud Affect Delhi’s Air Quality?
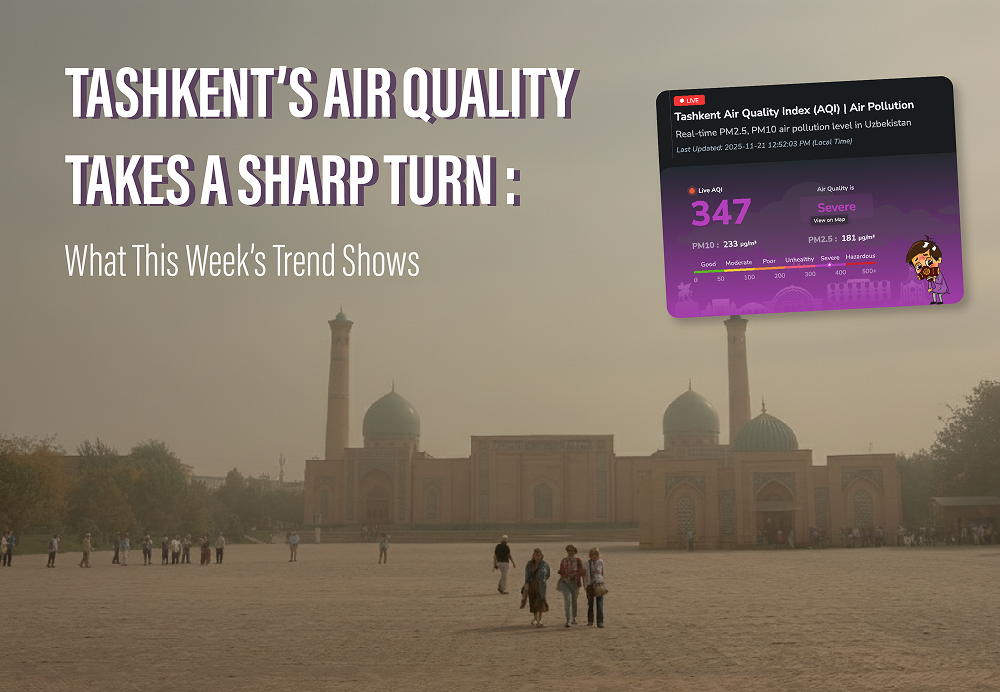
Tashkent’s Air Quality Takes a Sharp Turn: What This Week’s Trend Shows

Invisible dust reality
.png)
Dust vs Smoke: Why Cleaning Your Home Doesn’t Clean Your Air
AQI Graph
Historical Air Quality Data
Banhore
Download 2024 Annual Data
World Air Quality Report

Do you know CO emissions in the atmosphere can affect the greenhouse gas level? It is because CO emission causes global and climate changes in the atmosphere by increasing or changing the sea and land temperatures. It makes changes in ecosystems and storm activity and affects other weather events..

Uncovering the Sources of Carbon Monoxide (CO): Where Does It Come From?

Biomass burning
Burning wood, crop residues, and organic materials.
Power plants
Emissions from burning fossil fuels in power plants.
Fireplaces
Emissions from burning wood or coal in fireplaces.
Road traffic
Overall contributions from vehicles exhaust.
Vehicles engines
Exhaust emissions from cars and trucks.Short-Term CO Exposure Impacts

Fatigue
Feeling tiredness or lack of energy.
Chest pain
Discomfort or pain in the chest area.
Confusion
Frequent difficulty in thinking clearly.
Flu-like symptoms
Symptoms like headache and nausea.
Weakness
Frequent weakness or lack of strength.Why you should care about Carbon Monoxide (CO)?
Know More About CO Sensor
