India Air Quality Index (AQI) | Air Pollution
Real-time PM2.5, PM10 air pollution level in India
Last Updated: 2025-10-14 11:28:15 AM (Local Time)


27 °C
Patchy rain nearbyIndia
Trending in India

Air Quality Monitoring for Logistics: Smarter Deliveries with Data
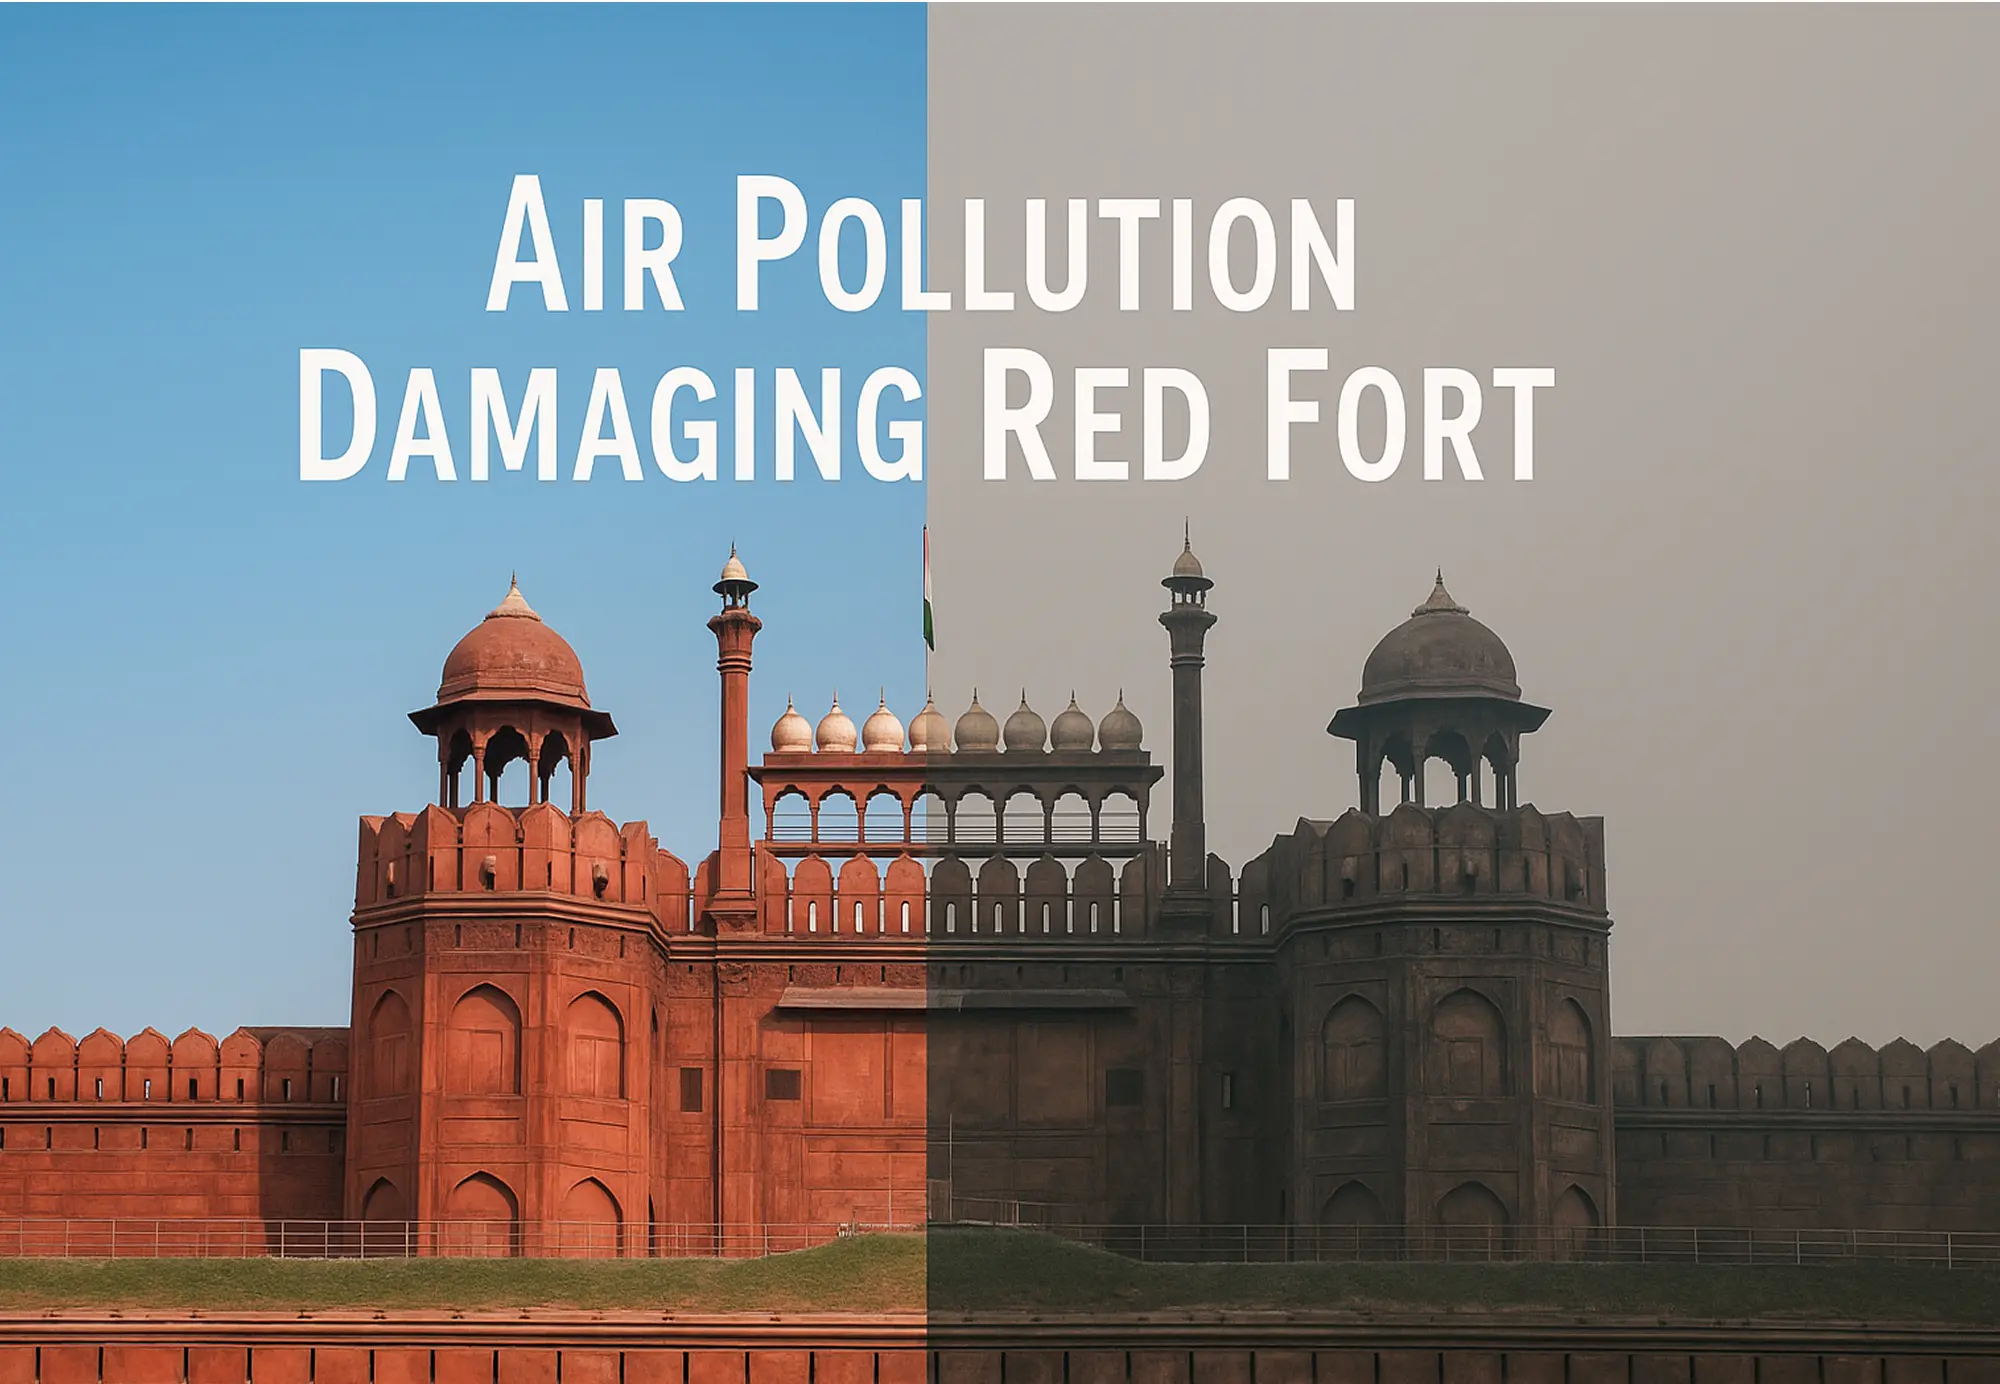
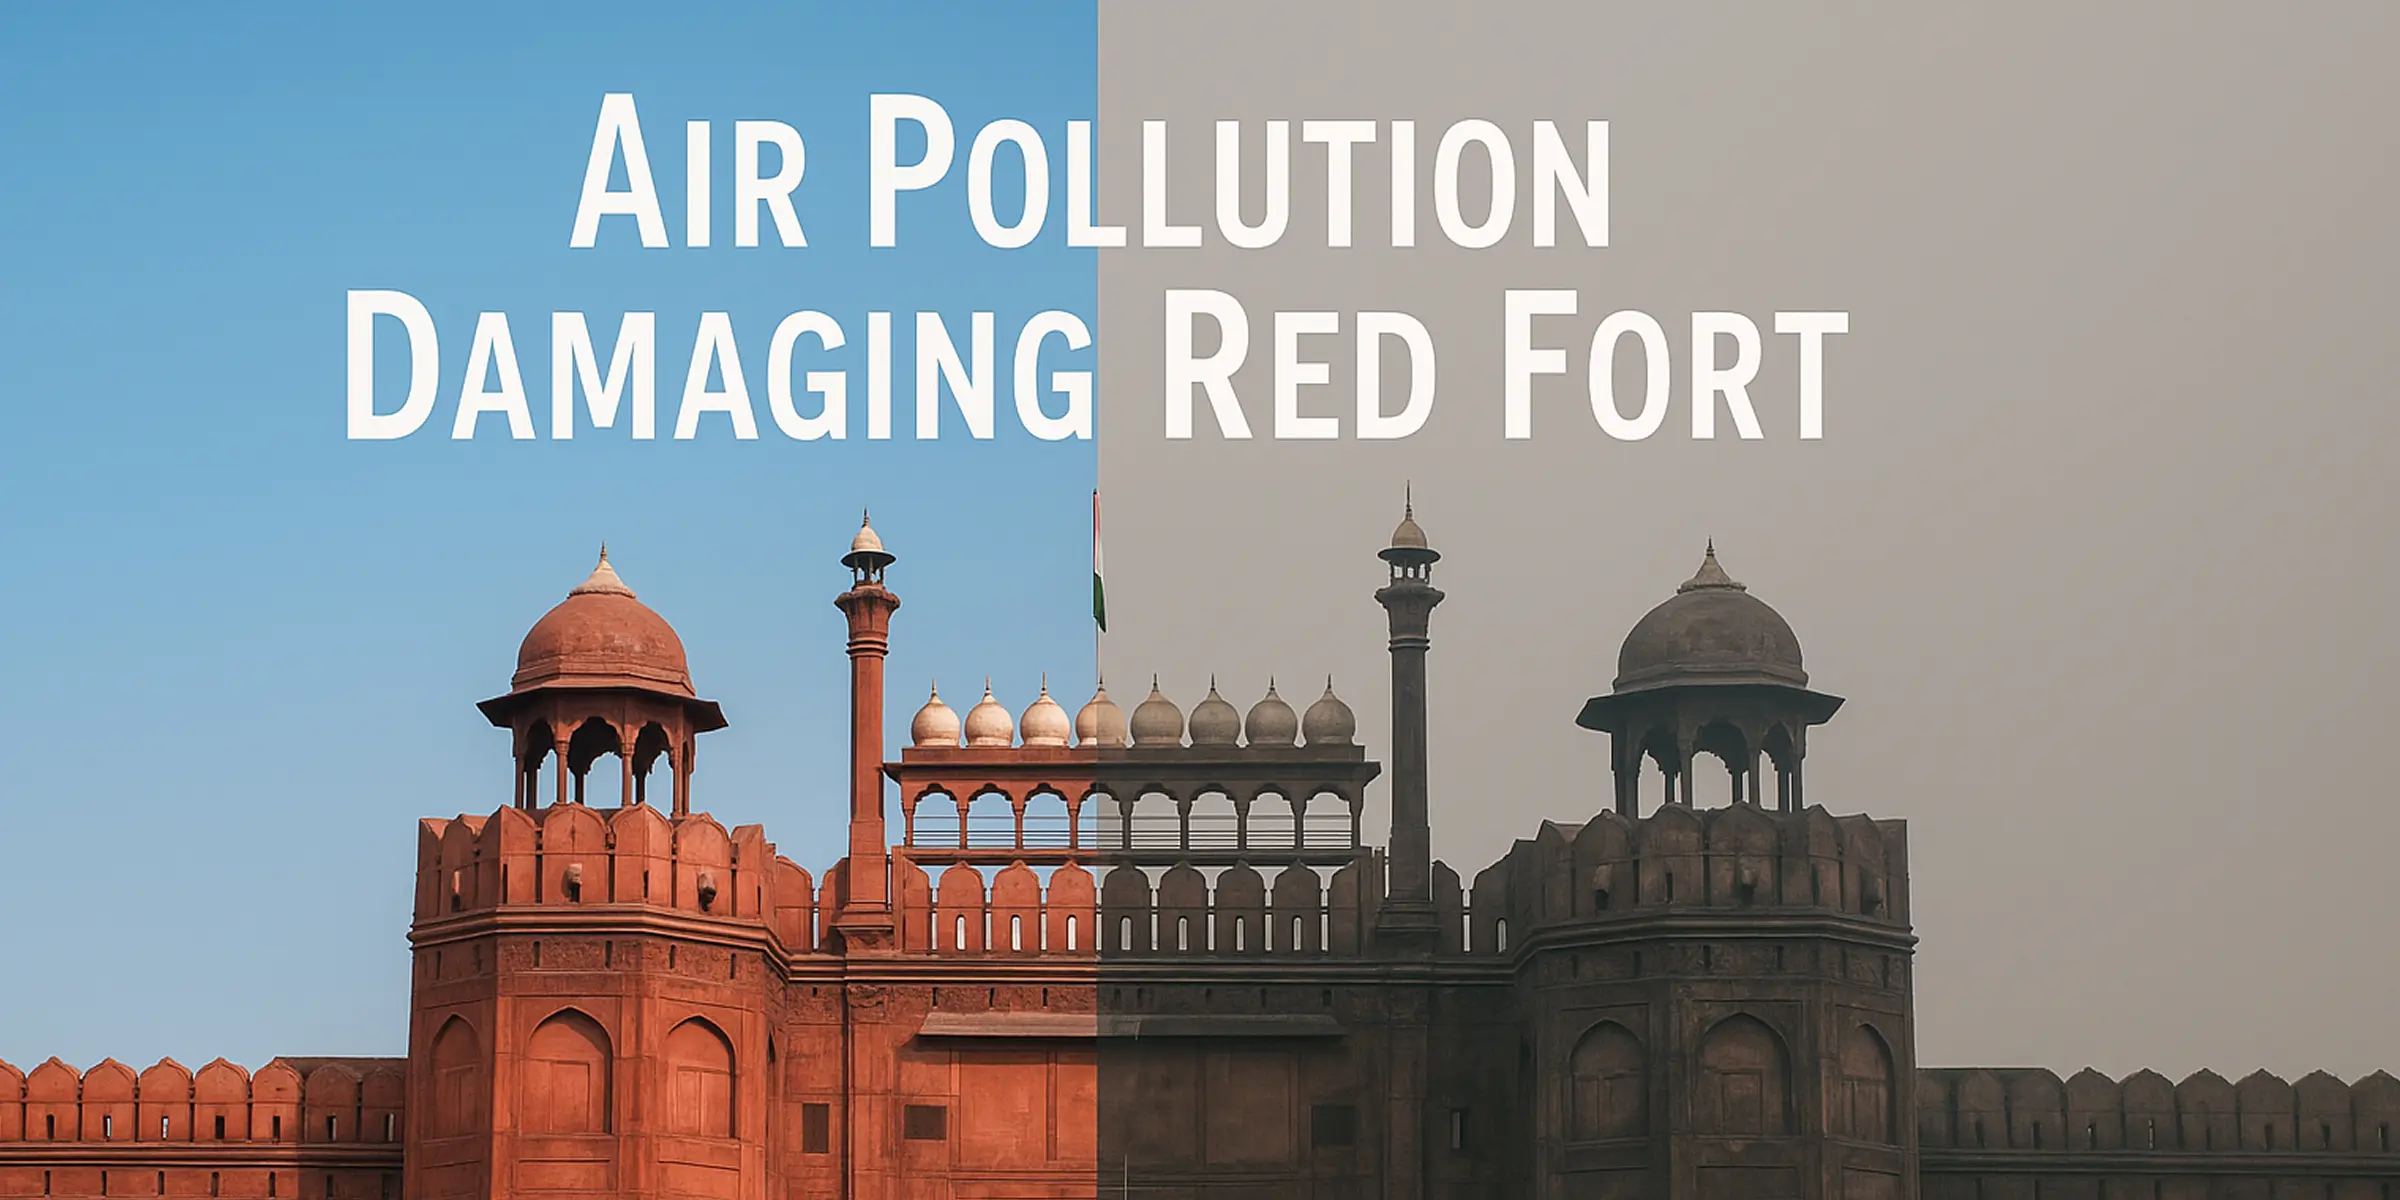
Red Fort in Delhi is Not Red Anymore! It is Turning Black: Air Pollution Damaging Red Fort
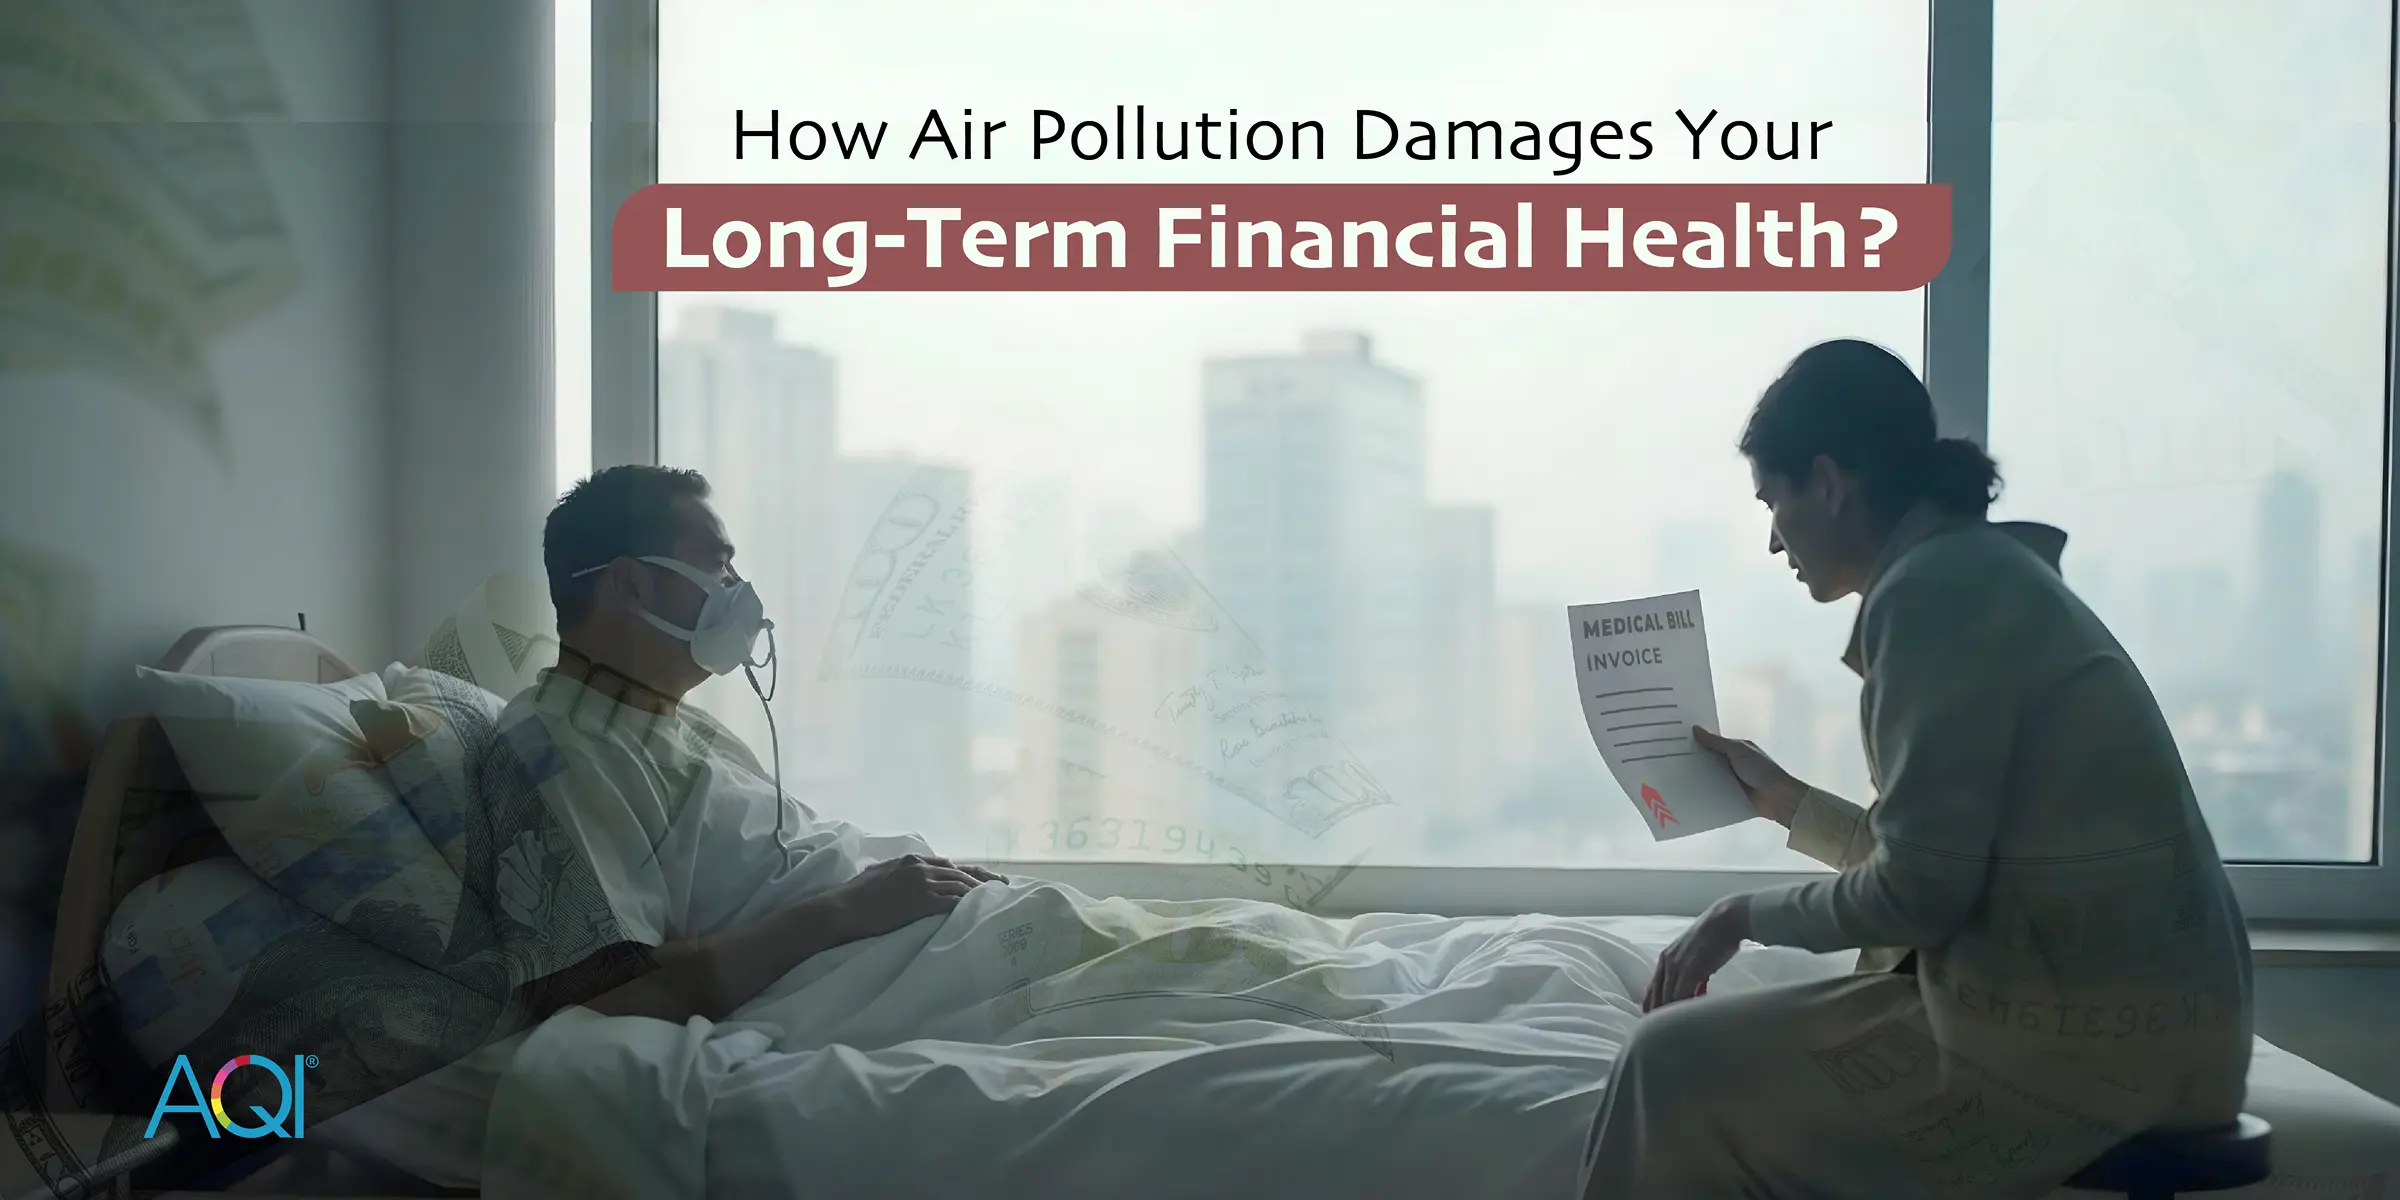
What’s the Connection Between Air Pollution and Blood Cancer?
AQI Graph
Historical Air Quality Data
India
Download 2024 Annual Data
World Air Quality Report

India's States
Real-time Air Pollution Level
India's Metro Cities
Air Quality Index


Most Polluted Cities 2025
India
Analyze the real-time most air polluted cities in the country.
Standard Value
1.
Siwani, India
2.
Pithampur, India
3.
Hapur, India
4.
Dharuhera, India
5.
Jaisalmer, India
6.
Bikaner, India
7.
Phalodi, India
8.
Betma, India
9.
Kishanganj, India
10.
Jodhpur, India
Last Updated: 14 Oct 2025, 06:00 AM
AQI City RankingsAir Quality Solutions For India
Explore the solutions of air quality monitoring & clean air.
Here are some applications that you can go through to find out the solutions.


India's AQI Data Analytics Solutions
Air quality data monitoring platforms

Your area’s real-time data with detailed parameters.
Personalized health advice as per current AQI.
Analytical data to identify trends and conditions.
Connect and control your air quality devices.
Air Quality FAQs
at India
Frequently Asked Questions About Air Quality
What is the current AQI level in India?
The current real-time AQI level in India is 138 (Poor) due to recent rainfall by 0.08mm/hr. This was last updated 2025-10-14 11:28:15 AM (Local Time).
When was the best AQI level in India in the last 24 hours?
The best AQI level was 124 (Poor) at 5:04 PM, Oct 13, 2025 (Local Time) during the last 24 hours.
When was the worst AQI level in India in the last 24 hours?
The worst AQI level was 149 (Poor) at 12:04 AM (Local Time) during the last 24 hours.
What is the current trend of AQI levels in India during last 24 hours?
The AQI levels in India have been fluctuating throughout the last 24 hours. The levels have increased by highest 149 at 12:04 AM (Local Time), lowest 124 at 5:04 PM, Oct 13, 2025 (Local Time).
What actions are recommended as per the current AQI level in India?
Current AQI levels are unhealthy for Sensitive individuals, they should reduce prolonged or heavy outdoor exertion.
Recent AQI Blogs
Read the latest news
Here are some latest blogs that you can go through to find out more air pollution.