New Delhi Air Quality Index (AQI) | Air Pollution
Real-time PM2.5, PM10 air pollution level in Delhi
Last Updated: 2025-08-12 09:40:50 PM (Local Time)


33 °C
MistNew Delhi
Trending in India
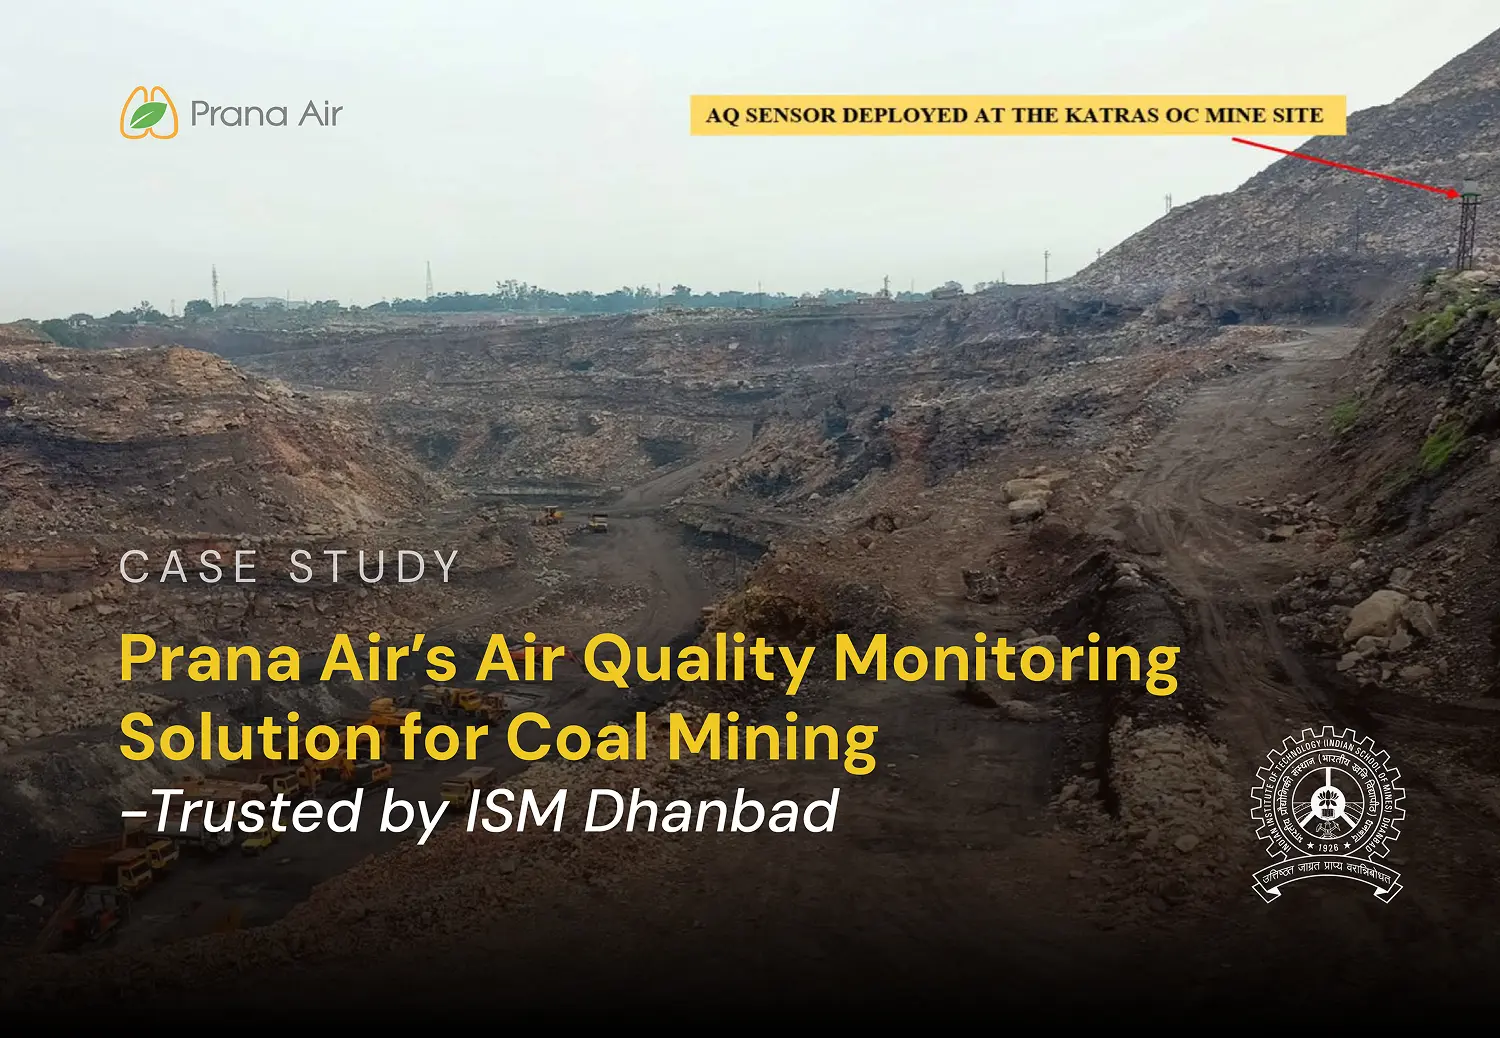
Case Study: Prana Air’s Air Quality Monitoring Solution for Coal Mining-Trusted by ISM Dhanbad

How Does the Best Air Quality Solution for Airport Improve Operations and Passenger Safety?

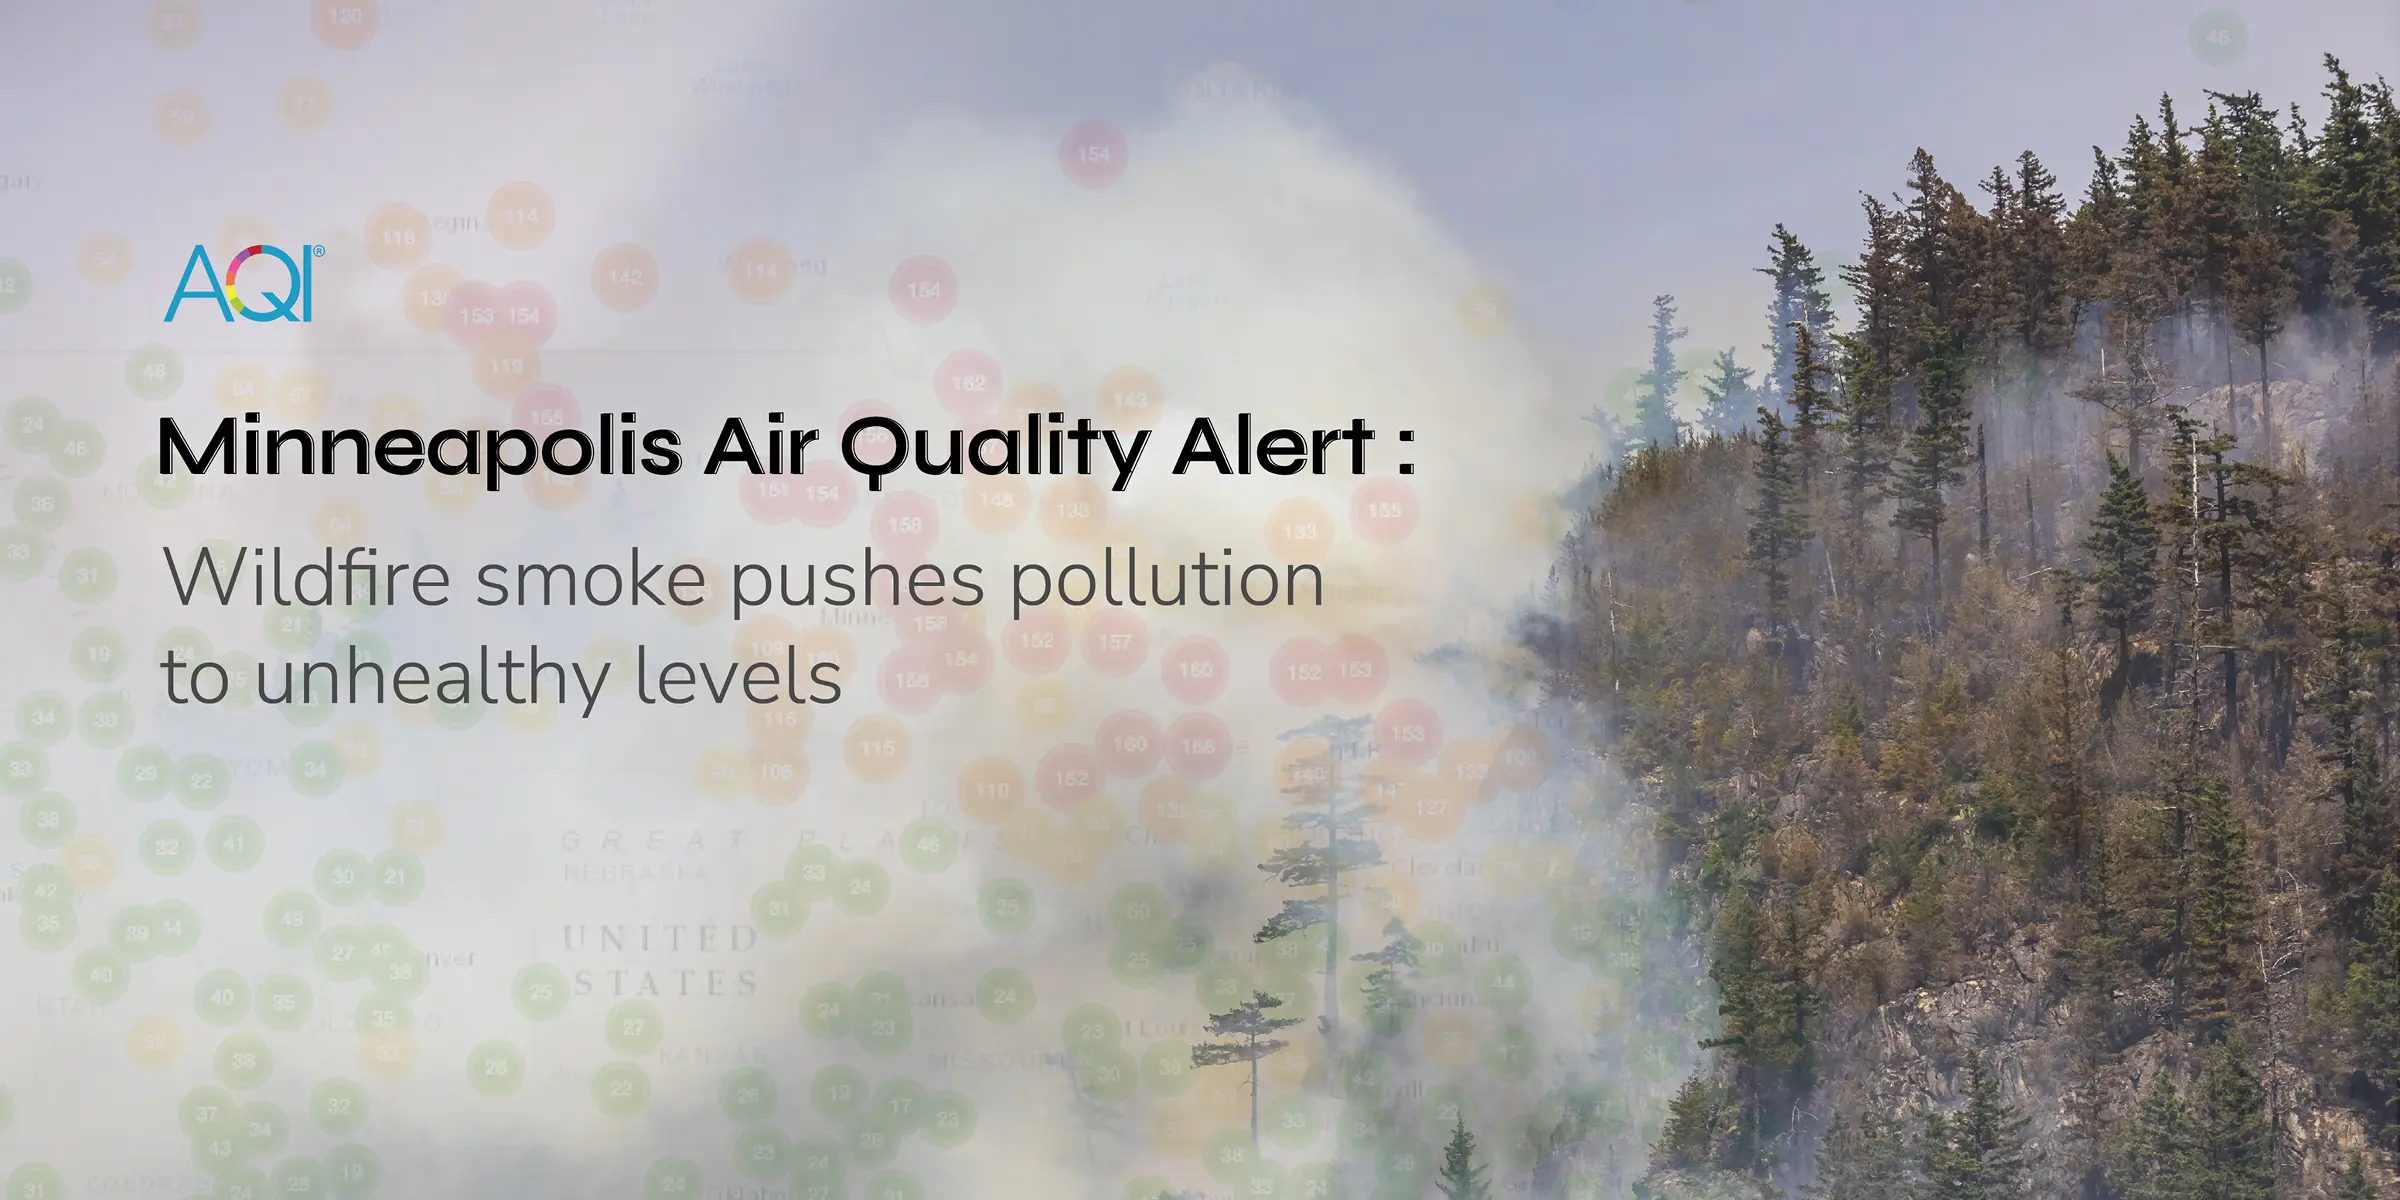
Biggest Wildfire in France’s History?What It Means for Air Quality, Health, and Climate
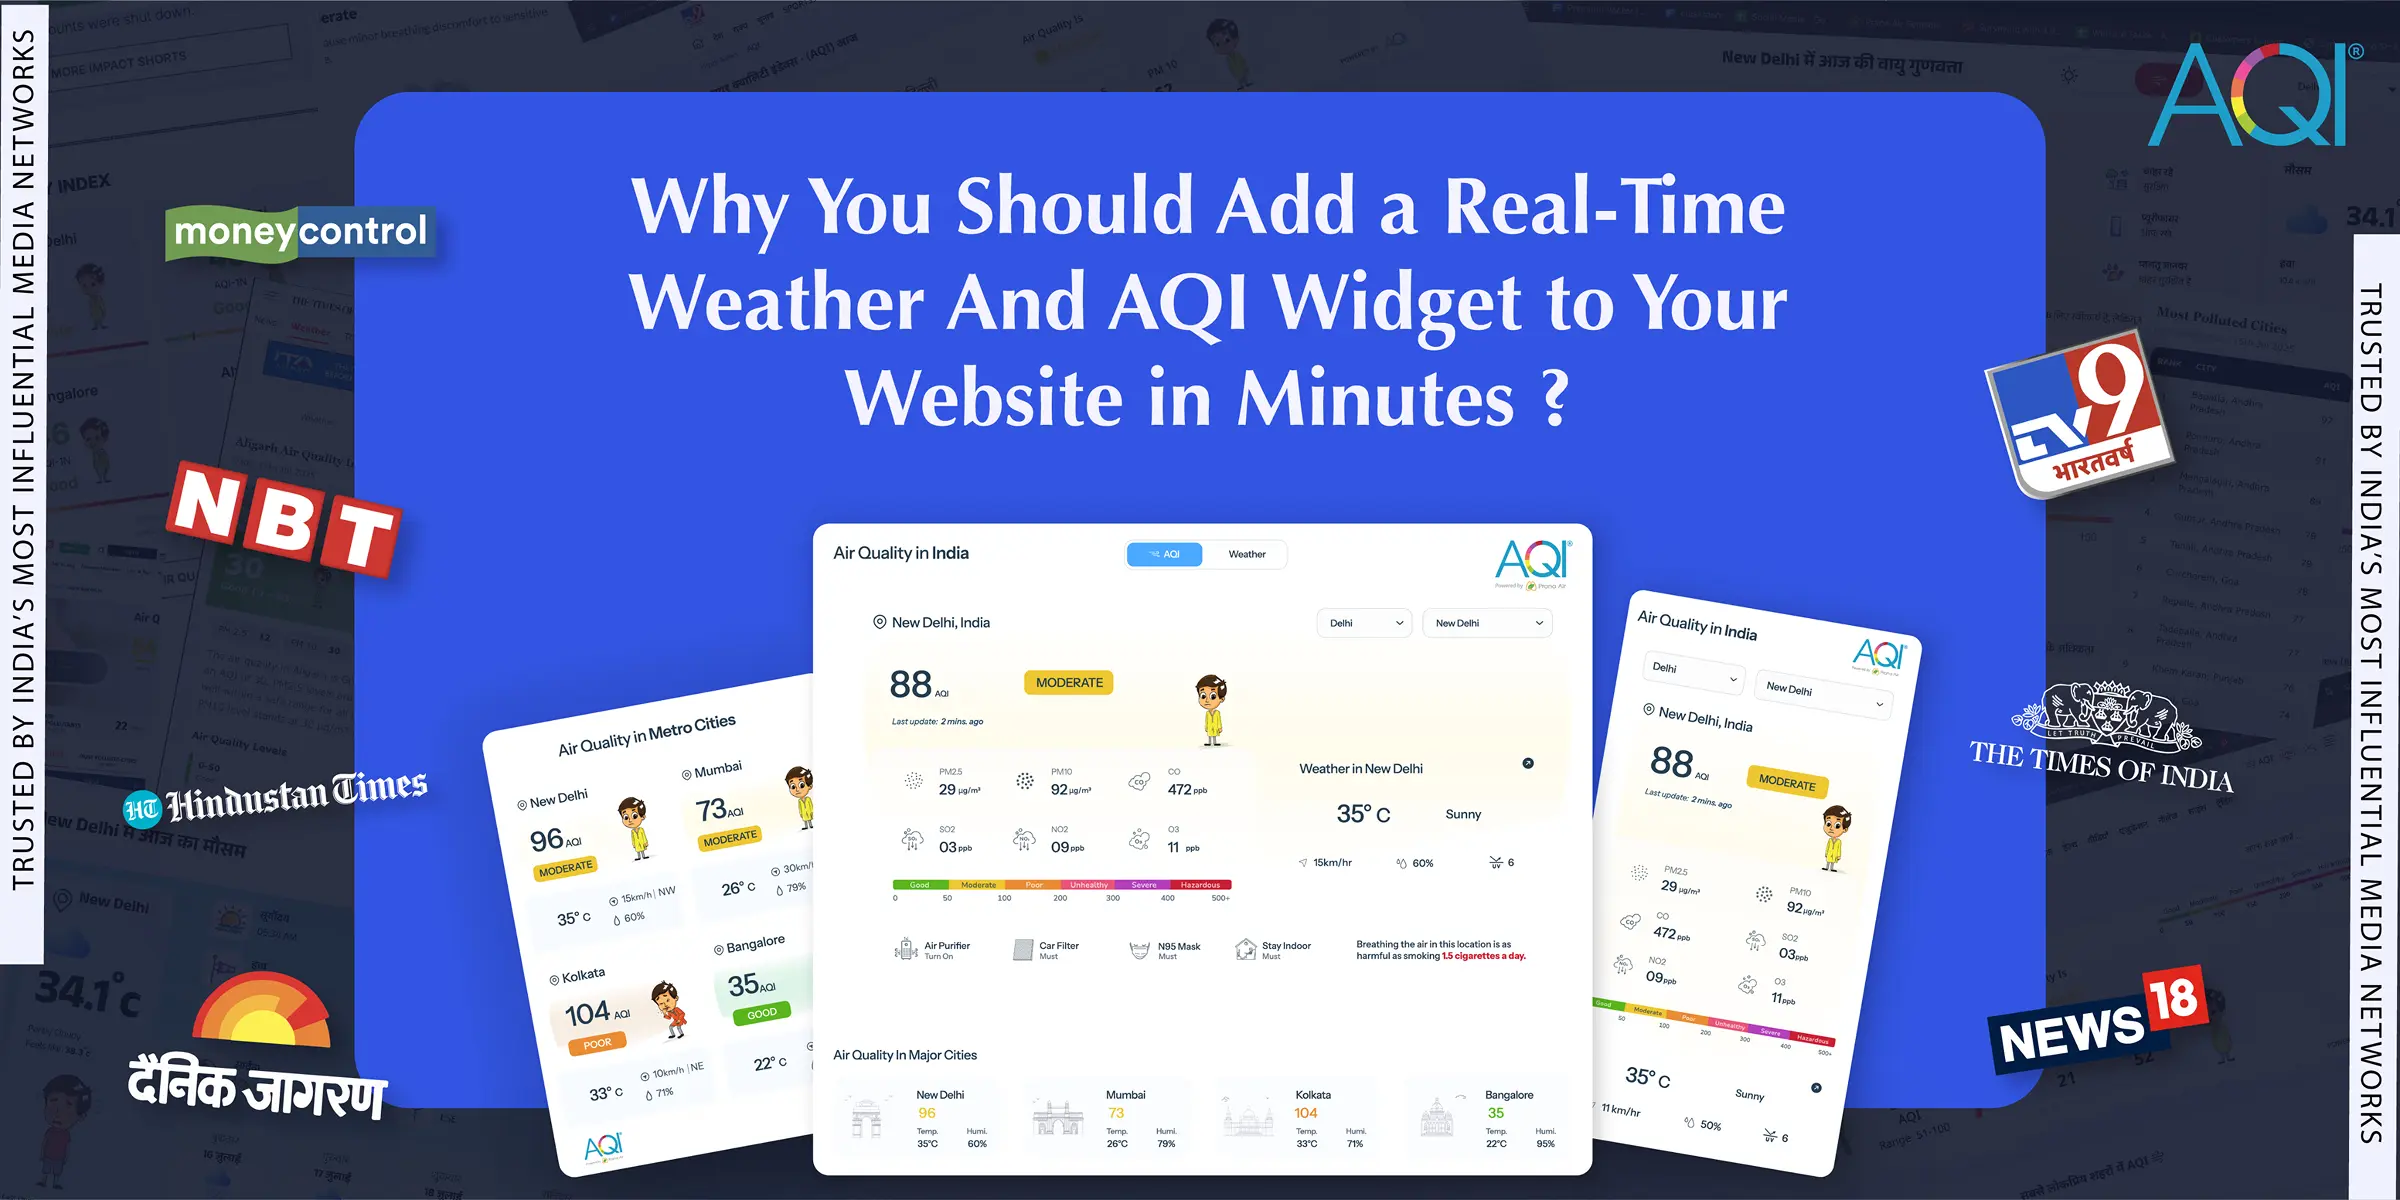
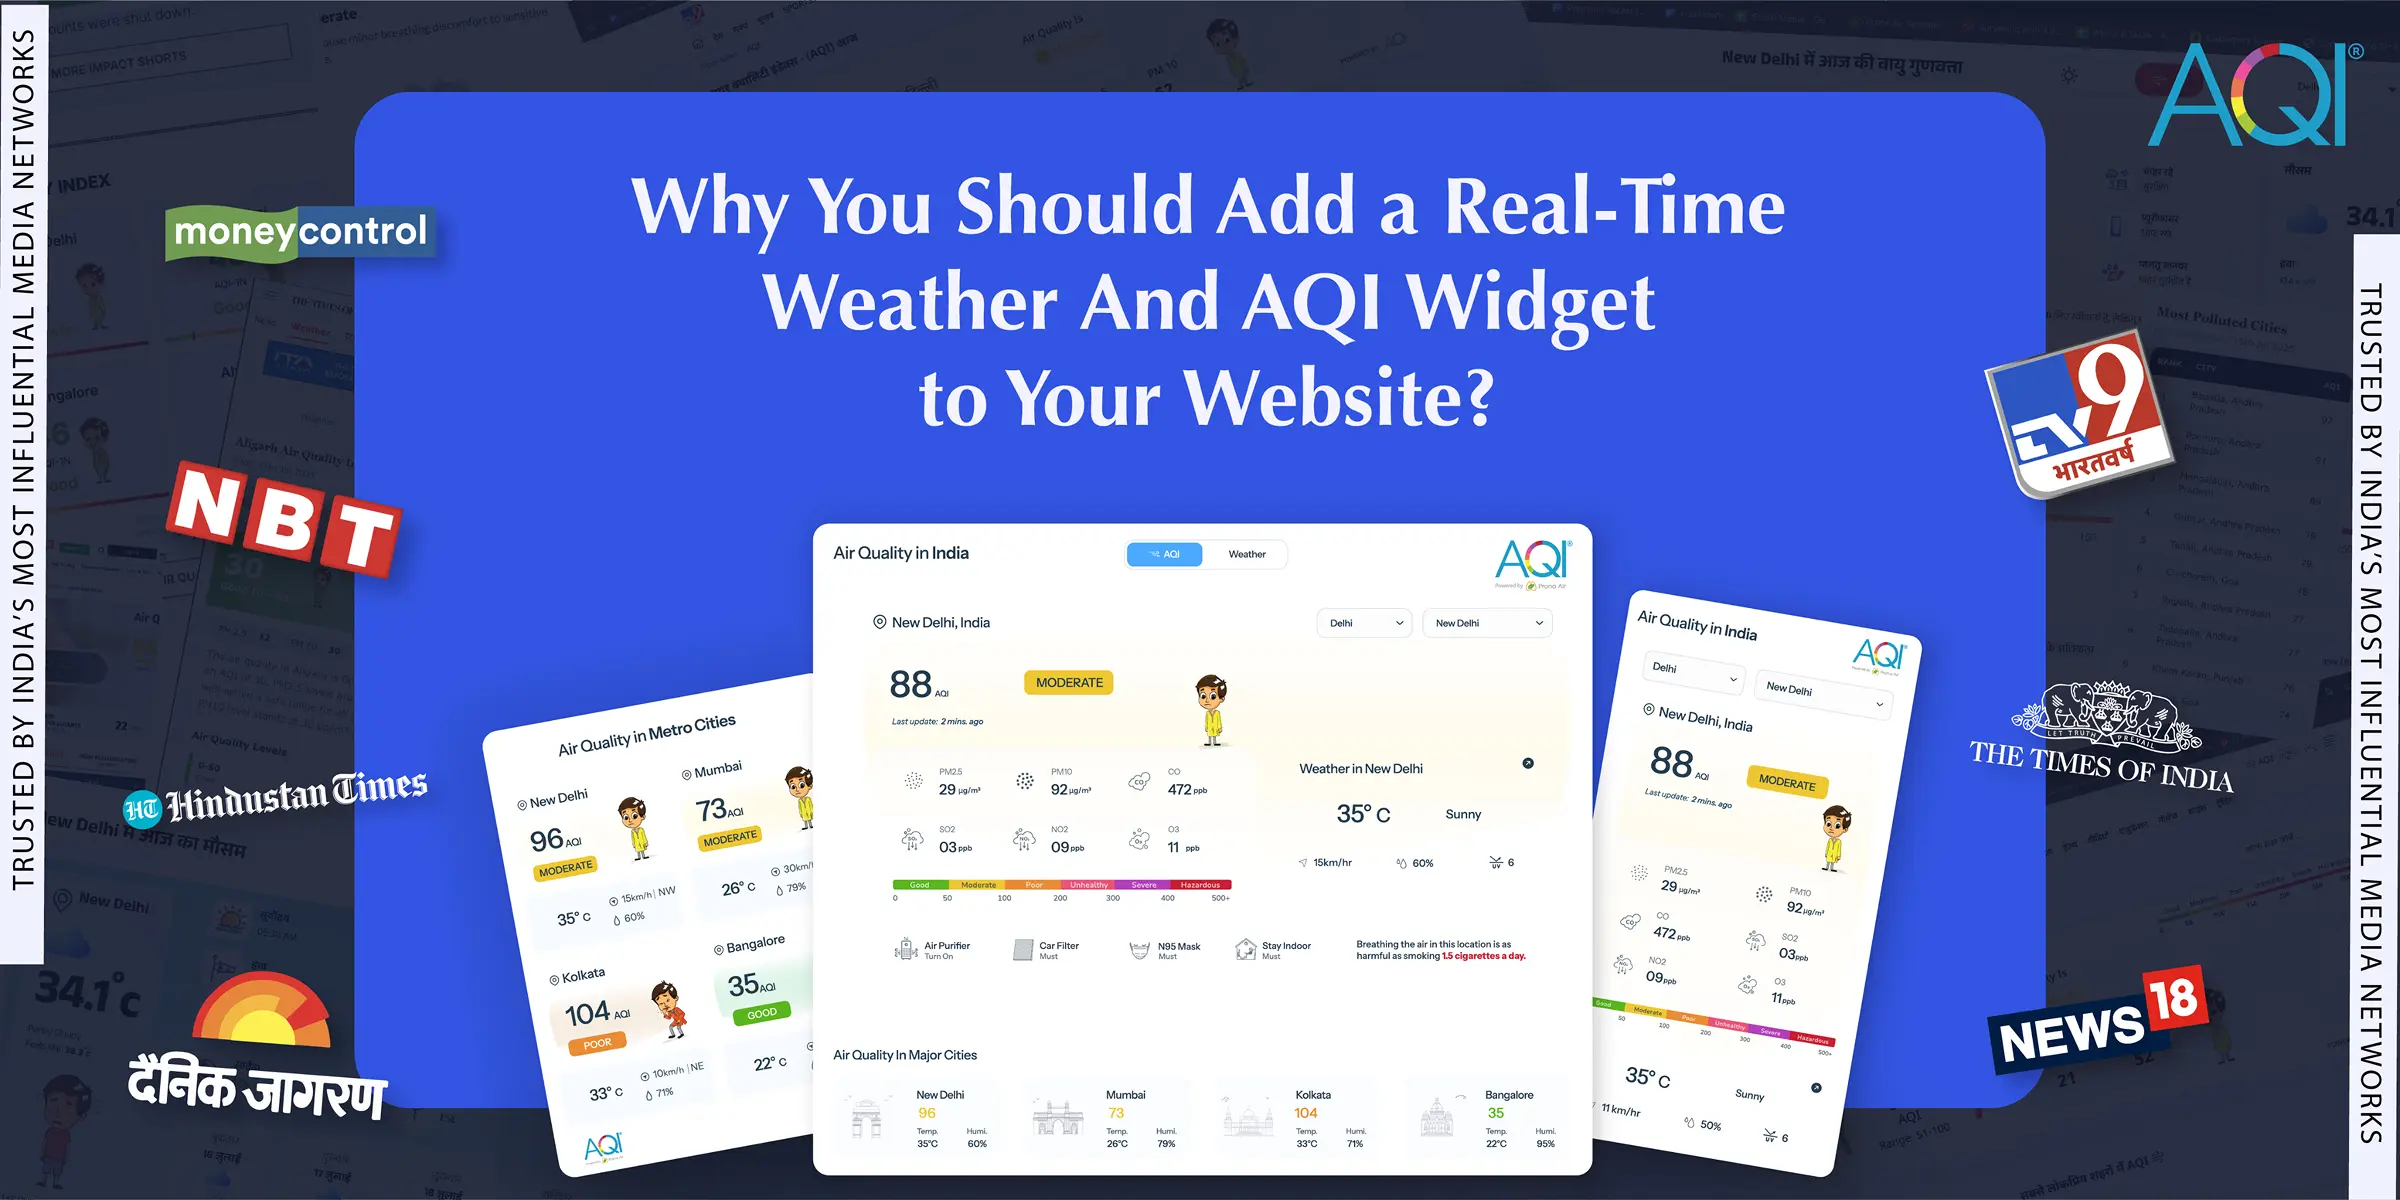
Why You Should Add a Real-Time Weather and AQI Widget to Your Website?

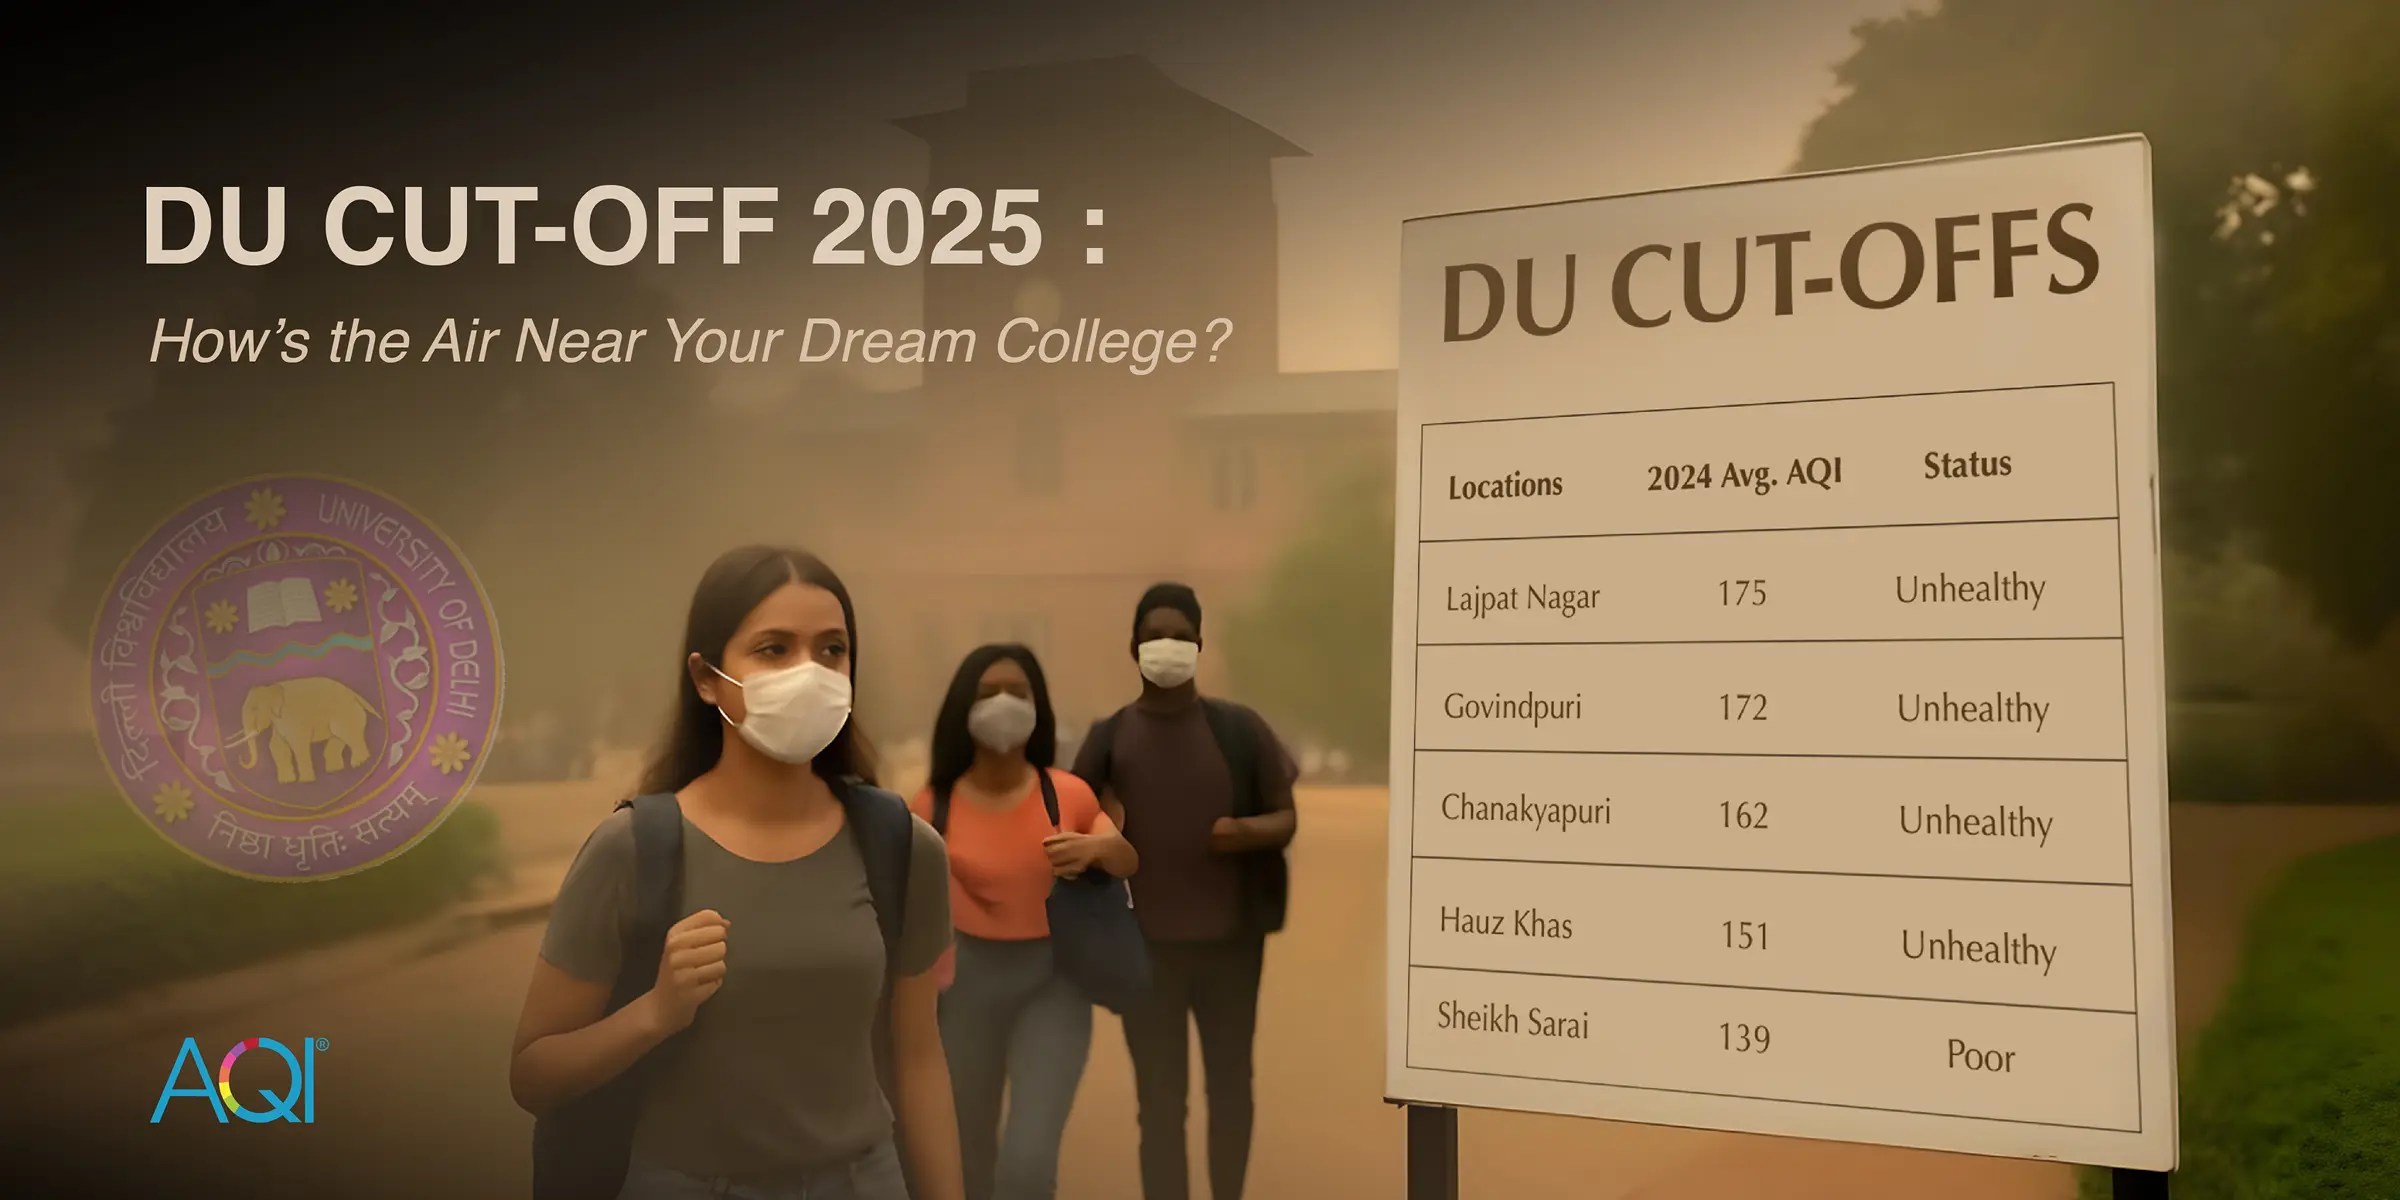
DU Cut-Off 2025: How’s the Air Near Your Dream College?
.webp)
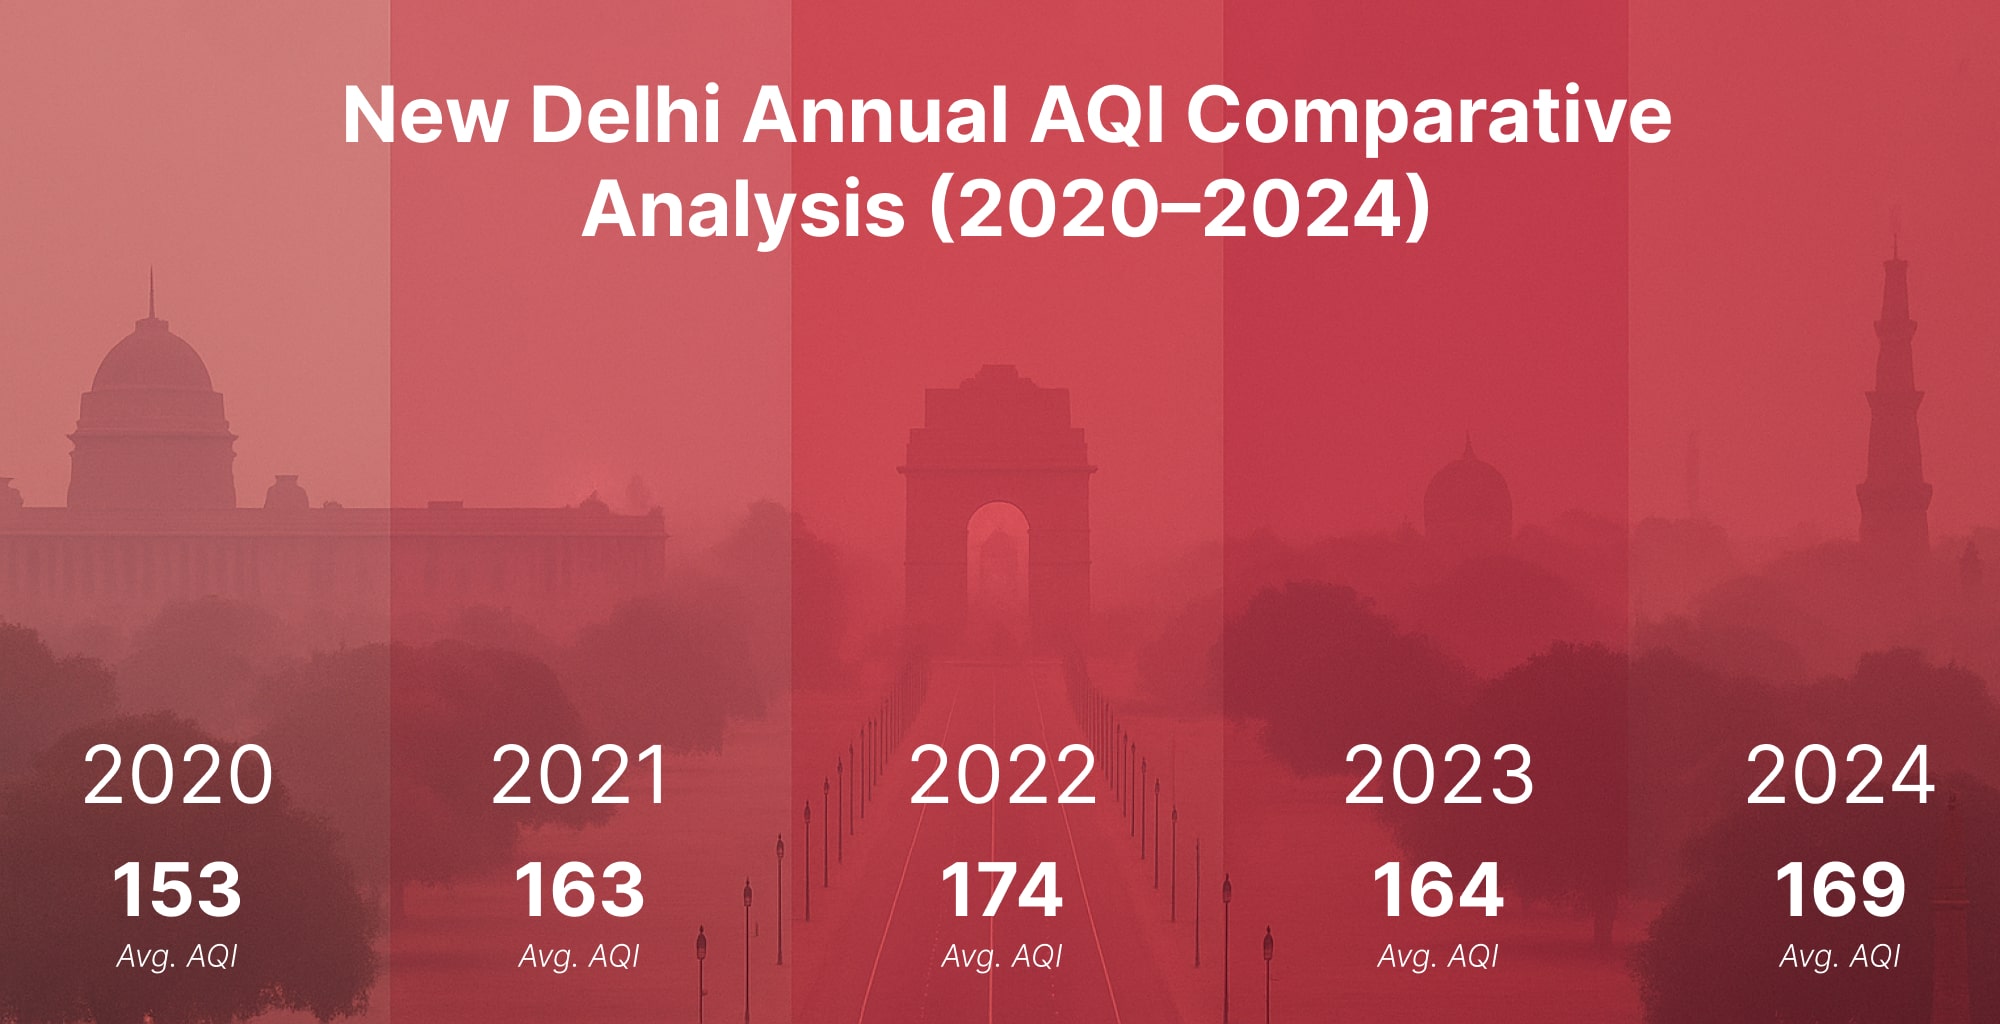
New Delhi Annual Air Quality: Comparative Analysis of AQI (2020–2025)
AQI.IN's Community Air Quality Monitoring Get a Free AQI Monitor by Joining AQI.IN's Community Initiative.
AQI Graph
Historical Air Quality Data
New Delhi
Download 2024 Annual Data
World Air Quality Report

AQI Trends - Annual Air Quality Changes
New Delhi, Delhi, India
Annual AQI Trends
Most & Least Polluted Months
* This data analysis is from year 2020 - 2025
Delhi Air Quality - Video Streaming
Watch the Real time changing of Air Quality in Delhi- PM2.5, PM10, Noise, Temperature and Humidity
New Delhi's Locations
Real-time Air Pollution Level
India's Metro Cities
Air Quality Index


Air Quality Calendar 2025
New Delhi
Health Advice For People Living In
New Delhi
1.1Cigarettes per day

Breathing the air in this location is as harmful as smoking 1.1 cigarettes a day.
Source:
Berkeley Earth
Solutions for Current AQI
 Air PurifierTurn On
 Car FilterMust
 N95 MaskMust
 Stay IndoorMust
Must turn on the air purifier to enjoy fresh air.
Get an Air PurifierPrevent Health Problems: Understand Your Risks
New Delhi
 Asthma
 Heart Issues
 Allergies
 Sinus
Sinus Cold/Flu
 Chronic (COPD)

Mid. Chances of Asthma
Asthma
Risk of Asthma symptoms is Mid. when AQI is Moderate (50-150)
Moderate symptoms including frequent wheezing, noticeable shortness of breath, chest tightness, and persistent cough.
Do's :
Limit outdoor activities when AQI is poor.
Clean indoor air with an air purifier to reduce exposure.
Soothe the respiratory tract with herbal teas or warm water to help alleviate symptoms.
Don'ts :
Exercise outdoors without a mask.
Stay in smoky areas with strong fumes.
Most Polluted Cities 2025
India
Analyze the real-time most air polluted cities in the country.
Standard Value
1.
Bharatpur, India
2.
Vrindavan, India
3.
Bulandshahr, India
4.
Fatehpur Sikri, India
5.
Mathura, India
6.
Ganganagar, India
7.
Mandikhera, India
8.
Sonipat, India
9.
Khedbrahma, India
10.
Abohar, India
Last Updated: 12 Aug 2025, 04:15 PM
AQI City RankingsAbout New Delhi Air Pollution
New Delhi Monthly AQI Analysis
Explore the AQI changes as a comparison from the past month, as well as how it differs from the same month last year
Aug. 2024 vs Aug. 2025
Compared to Aug. 2024, the AQI in Aug. 2025 remained in the same category.
Jul. 2025 vs Aug. 2025
AQI levels remained the same from Jul. 2025 to Aug. 2025 in the 'Moderate' category.
New Delhi's annual 2025 AQI (143) shows an average percentage change of -12.8% (improved AQI) compared to previous years: 2020 (153), 2021 (162), 2022 (174), 2023 (164), 2024 (169).


Air Quality Solutions For New Delhi
Explore the solutions of air quality monitoring & clean air.
Here are some applications that you can go through to find out the solutions.


New Delhi's AQI Data Analytics Solutions
Air quality data monitoring platforms

Your area’s real-time data with detailed parameters.
Personalized health advice as per current AQI.
Analytical data to identify trends and conditions.
Connect and control your air quality devices.
Air Quality FAQs
at New Delhi
Frequently Asked Questions About Air Quality
What is the current AQI level in New Delhi?
The current real-time AQI level in New Delhi is 86 (Moderate). This was last updated 2025-08-12 09:40:50 PM (Local Time).
When was the best AQI level in New Delhi in the last 24 hours?
The best AQI level was 55 (Moderate) at 7:09 AM (Local Time) during the last 24 hours.
When was the worst AQI level in New Delhi in the last 24 hours?
The worst AQI level was 107 (Poor) at 11:09 PM, Aug 11, 2025 (Local Time) during the last 24 hours.
What is the current trend of AQI levels in New Delhi during last 24 hours?
The AQI levels in New Delhi have been fluctuating throughout the last 24 hours. The levels have increased by highest 107 at 11:09 PM, Aug 11, 2025 (Local Time), lowest 55 at 7:09 AM (Local Time).
What actions are recommended as per the current AQI level in New Delhi?
Current AQI levels are acceptable; however, some pollutants may be a concern for a small number of sensitive individuals.
Recent AQI Blogs
Read the latest news
Here are some latest blogs that you can go through to find out more air pollution.