 Gyane Haobijam
A historic and deeply concerning meteorological trend has solidified into the climate record books. When looking at global temperature tracking, one geographical region completely dominates the data. Mirroring the extraordinary numbers we observed in the April 2026 global weather charts—where Indian cities like Banda, Amravati, and Kanpur entirely swept the world’s top rankings—every single city on the global top 50 hottest list for May 2026 belonged exclusively to India, which highlights the prevalence of the hottest cities in India, including the top 10 Hottest cities. Indeed, these cities reaffirm the dominance of the top 10 Hottest cities worldwide.
What makes the May 2026 data particularly fascinating is that while India maintained its 100% chokehold on the global charts, the specific cities shifted significantly from April. As the heat shifted focus, a massive, stubborn thermal dome trapped an entirely new set of regions in a relentless vice grip.
To understand the true magnitude of this localized climate event, we must look beyond a single hot afternoon. By pulling data from AQI.IN dataset and factoring in the overall daily average temperature for the month and the number of extreme heat days, we can accurately measure the duration and intensity of the thermal stress. Below is the definitive, data-backed ranking of the top 10 hottest cities on Earth for May 2026—all located in India—alongside vital analytics revealing just how long these cities baked.
World Top 10 Hottest Cities – May 2026 (Ranked by Absolute Peak High)
Focusing on the data from the top 10 Hottest cities is crucial to developing strategies to combat rising temperatures.
The following data table outlines the extreme environment these Indian cities faced, showcasing the absolute maximum high, the overall daily average temperature, and the lowest recorded minimum for the month.
As we analyze the top 10 Hottest cities, it becomes evident that their climatic challenges are shared with other global regions.
For instance, comparing the conditions in Etawah to other cities worldwide reveals patterns that are significant for understanding future climate scenarios.
| Rank | City | State | Avg Temp (°C) | Max Temp (°C) | Min Temp (°C) |
| 1 | Etawah | Uttar Pradesh | 36.9°C | 48.3°C | 23.8°C |
| 2 | Abohar | Punjab | 36.8°C | 48.2°C | 24.0°C |
| 3 | Sambalpur | Odisha | 34.4°C | 48.2°C | 23.3°C |
| 4 | Raurkela | Odisha | 33.0°C | 48.2°C | 21.6°C |
| 5 | Ganganagar | Rajasthan | 36.8°C | 48.2°C | 24.0°C |
| 6 | Mathura | Uttar Pradesh | 36.8°C | 48.0°C | 19.9°C |
| 7 | Jaisalmer | Rajasthan | 36.1°C | 48.0°C | 25.4°C |
| 8 | Bharatpur | Rajasthan | 37.0°C | 48.0°C | 21.6°C |
| 9 | Bilaspur | Chhattisgarh | 36.4°C | 48.0°C | 24.3°C |
| 10 | Sirsa | Haryana | 36.7°C | 47.9°C | 24.2°C |
Deep-Dive Analysis and Duration Analytics of the Top 10 Indian Cities
In summary, the focus on the top 10 Hottest cities has brought significant attention to the alarming climate conditions in these areas. The implications of their data extend far beyond national borders, as they form a critical part of the global conversation on climate change.
These findings underline the significance of understanding the hottest cities in India, as they reflect broader climatic changes affecting the region.
1. Etawah, Uttar Pradesh
- Absolute Peak Temperature: 48.3°C
- Monthly Average Temperature: 36.9°C
- Heatwave Duration Analytics: Out of the 31 days in May, Etawah recorded an astonishing 16 days at or above 45°C, and 24 days at or above 40°C.
- The Climate Drivers: Etawah sits in a geographic bowl highly susceptible to the dry, searing Loo winds sweeping across northern India. Spending more than half the month above the 45-degree mark meant that topsoil baked completely dry, pumping intense sensible heat right back into the lower atmosphere and driving the mercury to a lethal localized peak of 48.3°C on May 28th.

2. Abohar, Punjab
- Absolute Peak Temperature: 48.2°C
- Monthly Average Temperature: 36.8°C
- Heatwave Duration Analytics: Abohar was an unrelenting furnace, enduring 15 days at or above 45°C and a staggering 29 out of 31 days exceeding 40°C.
- The Climate Drivers: Located in the semi-arid southwestern pocket of Punjab, the city suffered from a complete lack of convective cloud cover. The fact that only two days all month stayed below 40°C showcases a stagnant atmospheric block that effectively locked the municipality inside a month-long meteorological kiln.

3. Sambalpur, Odisha
- Absolute Peak Temperature: 48.2°C
- Monthly Average Temperature: 34.4°C
- Heatwave Duration Analytics: Sambalpur experienced 12 days at or above 45°C and 26 days at or above 40°C.
- The Climate Drivers: Sambalpur represents one of the most alarming shifts in modern heatwave trends. Historically, highest global temperature spikes were confined to hyper-arid desert terrains. However, western Odisha features a much higher baseline relative humidity. Enduring 12 days above 45°C in a humid zone creates a catastrophic, recurring wet-bulb scenario where sweat evaporation fails, posing an immediate public health hazard.

4. Raurkela, Odisha
- Absolute Peak Temperature: 48.2°C
- Monthly Average Temperature: 33.0°C
- Heatwave Duration Analytics: The city spent 11 days at or above 45°C and 26 days at or above 40°C.
- The Climate Drivers: Tying with its regional neighbor, Raurkela is a heavily urbanized, industrial steel-producing hub. This industrial footprint heavily exacerbates extreme weather via the Urban Heat Island (UHI) effect. Interestingly, Raurkela saw a lower overall monthly average (33.0°C), showing sharper diurnal swings where heat successfully radiated back into space after sunset on non-peak days.

5. Ganganagar, Rajasthan
- Absolute Peak Temperature: 48.2°C
- Monthly Average Temperature: 36.8°C
- Heatwave Duration Analytics: Identical to Abohar’s grueling endurance run, Ganganagar saw 15 days at or above 45°C and 29 days at or above 40°C.
- The Climate Drivers: Positioned directly on the fringes of the Thar Desert, Ganganagar is a classic epicenter for desert heat dynamics. With virtually zero soil moisture to trigger evaporative cooling, nearly 100% of incoming solar radiation went directly into heating the ground for 29 sweltering days.

6. Mathura, Uttar Pradesh
- Absolute Peak Temperature: 48.0°C
- Monthly Average Temperature: 36.8°C
- Heatwave Duration Analytics: Mathura faced severe chronic exposure, recording the highest number of ultra-extreme days with 17 days at or above 45°C, alongside 27 days at or above 40°C.
- The Climate Drivers: While Mathura’s 17 days above 45°C is hazardous, its nighttime data tells the real story. During the peak of this heatwave, the mercury refused to drop below a stifling 36.5°C at night. Without a break in the daytime extremes or nighttime lows, residents were denied any natural thermal recovery window.

7. Jaisalmer, Rajasthan
- Absolute Peak Temperature: 48.0°C
- Monthly Average Temperature: 36.1°C
- Heatwave Duration Analytics: Jaisalmer saw fewer ultra-extreme spikes with only 5 days at or above 45°C, but maintained intense baseline heat with 29 days at or above 40°C.
- The Climate Drivers: Deep within the core of the Thar Desert, Jaisalmer’s thermal profile is dictated by high surface albedo. While it only crested 45°C five times, the constant baseline heat over 40°C highlights the unyielding nature of subtropical desert sun exposure during the pre-monsoon phase.

8. Bharatpur, Rajasthan
- Absolute Peak Temperature: 48.0°C
- Monthly Average Temperature: 37.0°C
- Heatwave Duration Analytics: Bharatpur recorded the highest overall monthly average temperature on this top 10 list (37.0°C), fueled by 16 days at or above 45°C and 28 days at or above 40°C.
- The Climate Drivers: Sharing a heavily urbanized atmospheric column with nearby Mathura, Bharatpur experienced intense atmospheric stagnation. This acted like a thermal blanket, trapping concrete-radiated heat and driving the daily baseline average to the highest level among the flash-spike cities.

9. Bilaspur, Chhattisgarh
- Absolute Peak Temperature: 48.0°C
- Monthly Average Temperature: 36.4°C
- Heatwave Duration Analytics: Bilaspur holds a uniquely punishing profile: 13 days at or above 45°C and a staggering 30 out of 31 days above 40°C.
- The Climate Drivers: Missing the 40°C mark on only a single day in May proves that Bilaspur’s spike to 48.0°C was not an isolated event. It was the explosive apex of an unrelenting, multi-week thermal assault that strained regional water tables and power grids to their absolute breaking points.

10. Sirsa, Haryana
- The Climate Drivers: Located in India’s northwestern agricultural heartland, enduring nearly a month above 40°C creates severe atmospheric drought. This extreme heat causes rapid agricultural evapotranspiration, stripping moisture from crops and topsoil and threatening pre-monsoon food security.
- Absolute Peak Temperature: 47.9°C
- Monthly Average Temperature: 36.7°C
- Heatwave Duration Analytics: Sirsa rounded out the list with 12 days at or above 45°C and 27 days at or above 40°C.

Why Did India Sweep the Global Charts Two Months in a Row? The Top 10 Hottest Cities Hold the Key
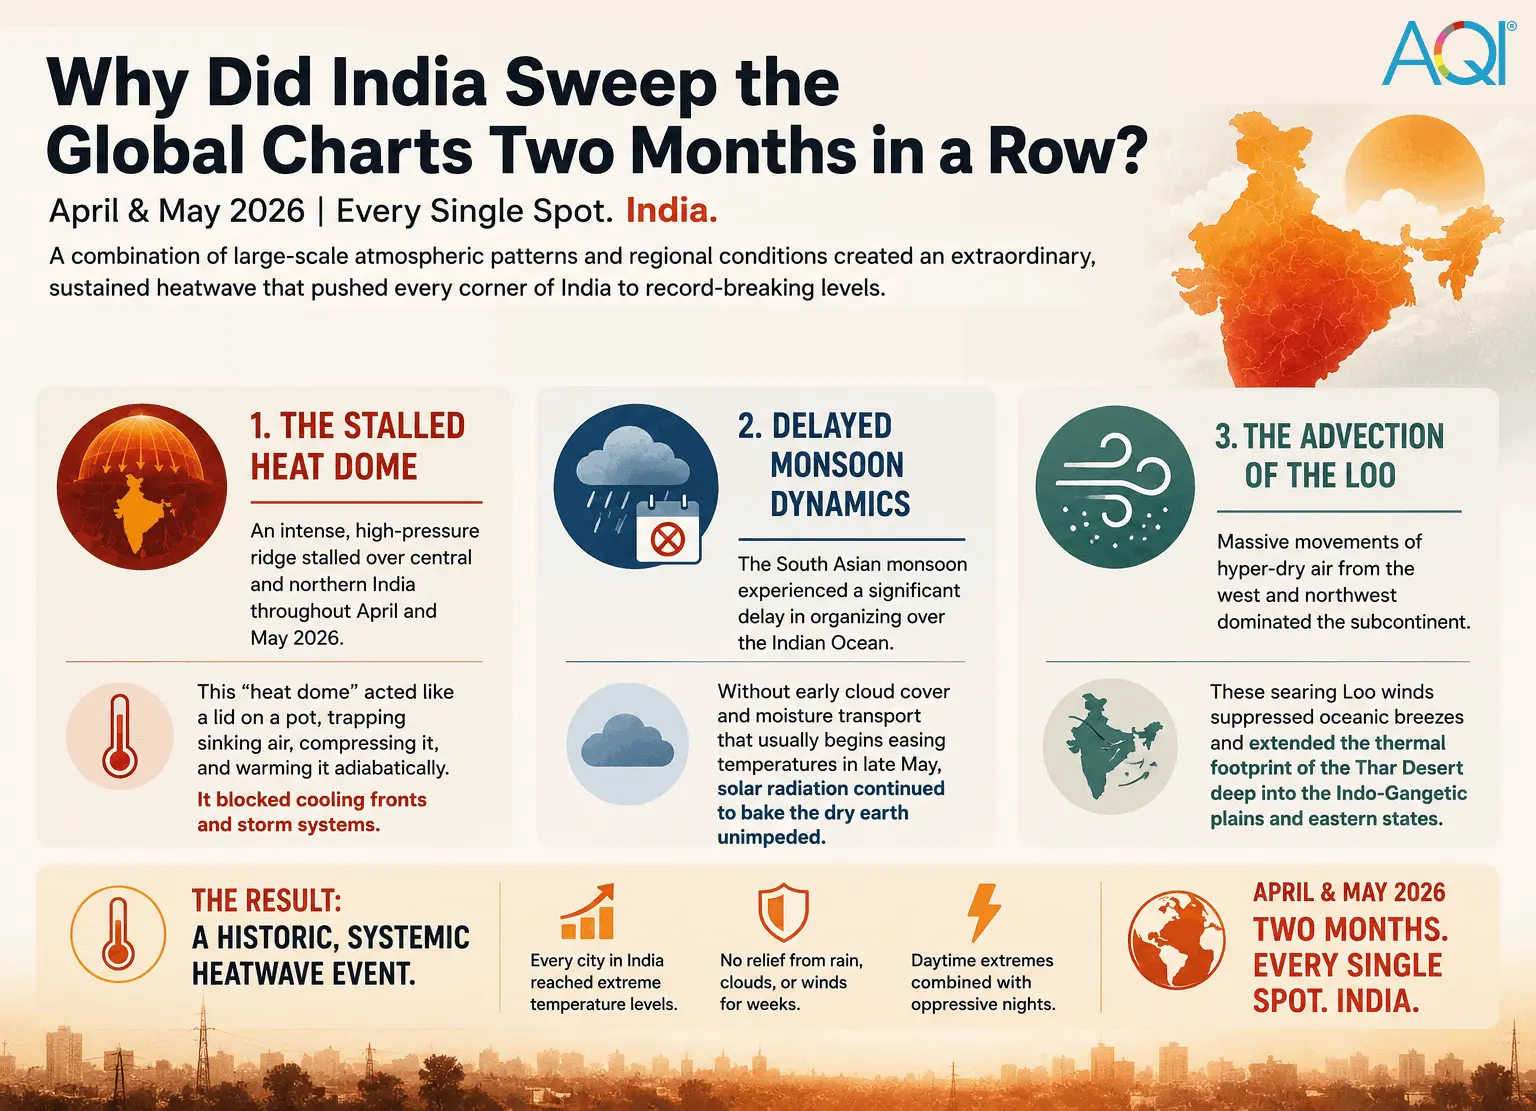
To see a single country claim every single spot on a global top hottest city list for two consecutive months (April and May 2026) points to a monumental, systemic shift in regional climate patterns. Even though the specific cities shifted geographically from April to May, this sustained macro-crisis was driven by three major compounding factors:
- The Stalled Heat Dome: Throughout April and May 2026, an intense, high-pressure ridge stalled over central and northern India. This “heat dome” acted like a lid on a pot, trapping sinking air, compressing it, and warming it adiabatically. This high pressure successfully repelled any incoming cooling fronts or localized storm systems.
- Delayed Monsoon Dynamics: The South Asian monsoon is the natural relief valve for the subcontinent’s summer heat. In May 2026, the cross-equatorial monsoon winds experienced a significant organizational delay over the Indian Ocean. Without the early convective cloud cover and moisture transport that typically begins easing temperatures in late May, solar radiation continued to bake the dry earth unimpeded.
- The Advection of the Loo: Massive, continental-scale movements of hyper-dry air masses from the west and northwest consistently suppressed any oceanic breeze from reaching deep inland. This extended the thermal footprint of the Thar desert all the way across the Indo-Gangetic plains into eastern states like Odisha.
As June begins, the entire subcontinent remains in an anxious waiting game for monsoon currents to break what has become an unprecedented, record-shattering chapter in global climate history.
 Shakshi
 AQI Team
 Manasvi Kumar