Download 2024 Annual Data
World Air Quality Report

Air Quality Index (AQI) Scale
Know about the category of air quality index (AQI) your ambient air falls in and what it implies.
Good(0 to 50)
The air is fresh and free from toxins. Enjoy outdoor activities without any health concerns.

Moderate(51 to 100)
Air quality is acceptable for most, but sensitive individuals might experience mild discomfort.

Poor(101 to 150)
Breathing may become slightly uncomfortable, especially for those with respiratory issues.

Unhealthy(151 to 200)
This air quality is particularly risky for children, pregnant women, and the elderly. Limit outdoor activities.

Severe(201 to 300)
Prolonged exposure can cause chronic health issues or organ damage. Avoid outdoor activities.

Hazardous(301+)
Dangerously high pollution levels. Life-threatening health risks with prolonged exposure. Stay indoors and take precautions.


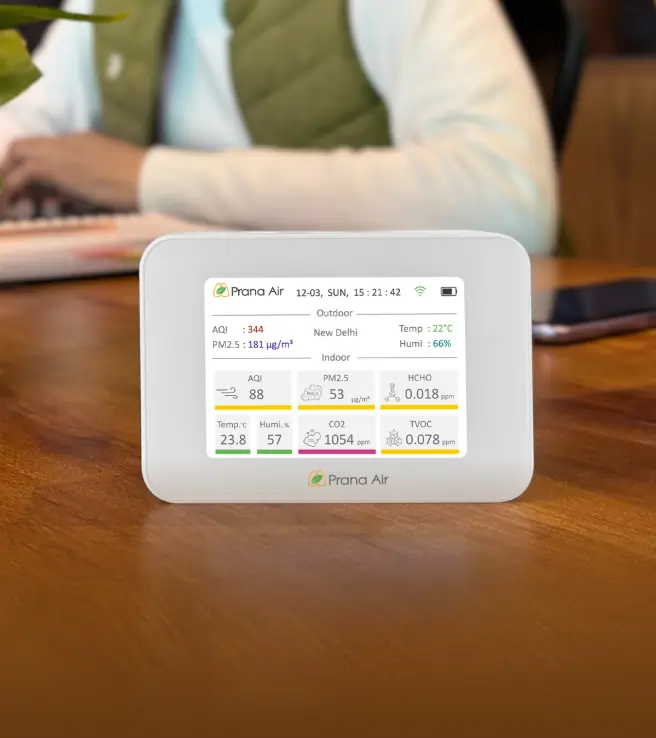
Cair +
Indoor Air Quality Monitor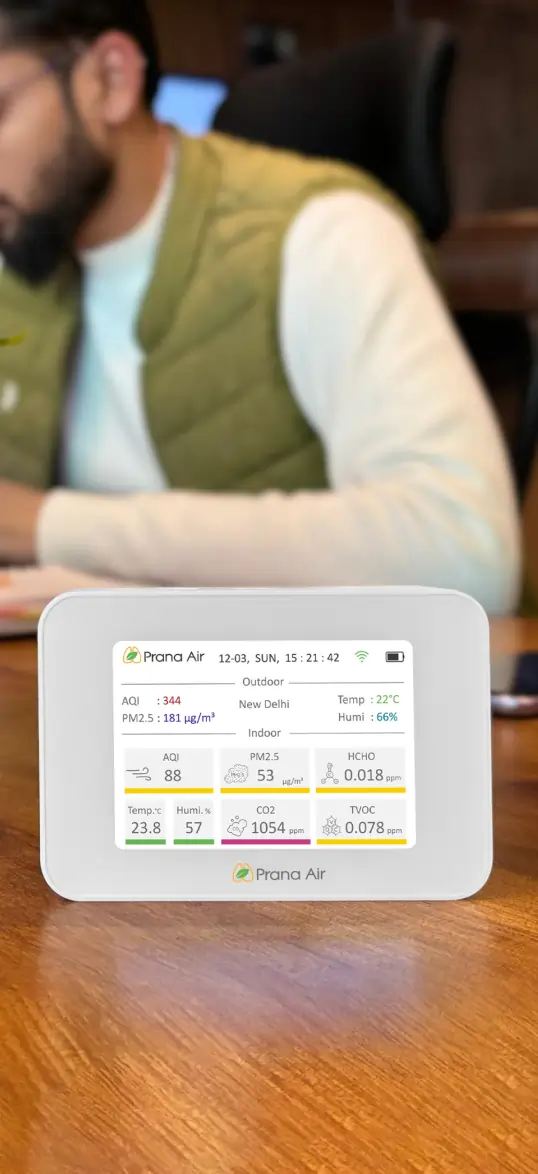
AQI Data Analytics Solutions
Air quality data monitoring platforms

Your area’s real-time data with detailed parameters.
Personalized health advice as per current AQI.
Analytical data to identify trends and conditions.
Connect and control your air quality devices.
Air Quality Solutions
Explore the solutions of air quality monitoring & clean air.
Here are some applications that you can go through to find out the solutions.


Recent AQI Blogs
Read the latest news
Here are some latest blogs that you can go through to find out more air pollution.

Editor's Pick
AQI.in is India’s leading platform for air quality monitoring, as featured in The Economic Times. Discover our journey from humble beginnings to becoming the nation's sole provider of comprehensive air pollution data and solutions. Learn how we started from scratch and now offer top-tier tools and services to combat air pollution effectively.
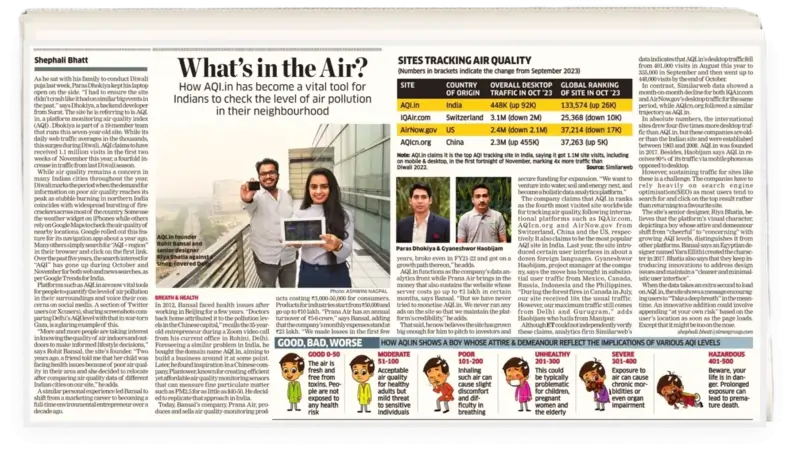
Media Coverage
AQI has been featured in media for its remarkable growth and innovation

Trusted by
Some of the Industry’s Top Organisations


Air Quality Around The World
Real-time air quality monitoring around the world.
