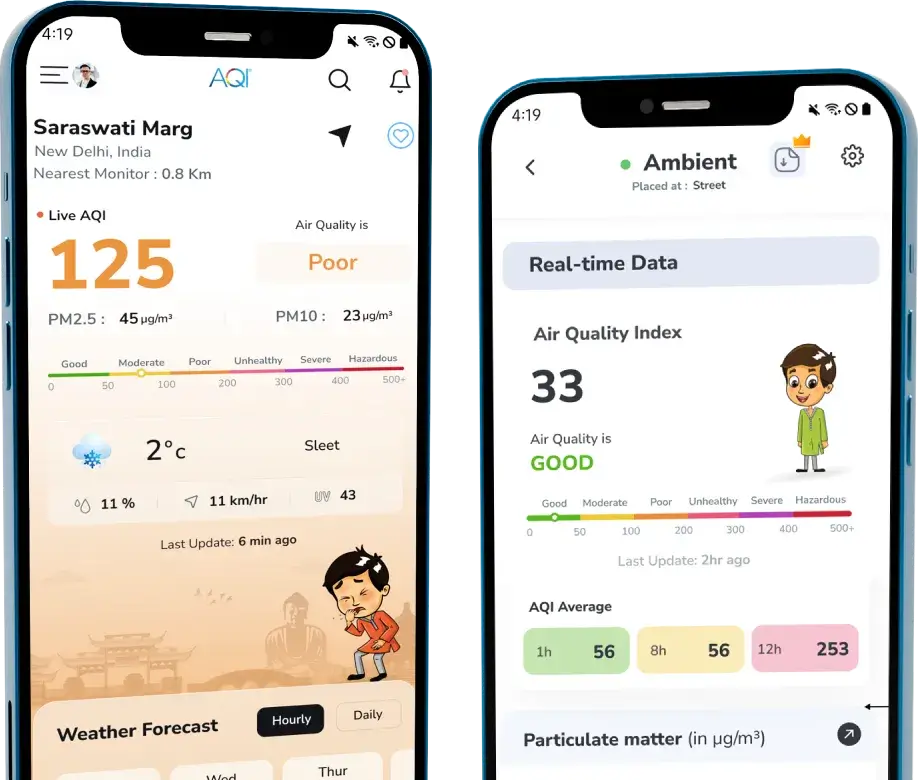
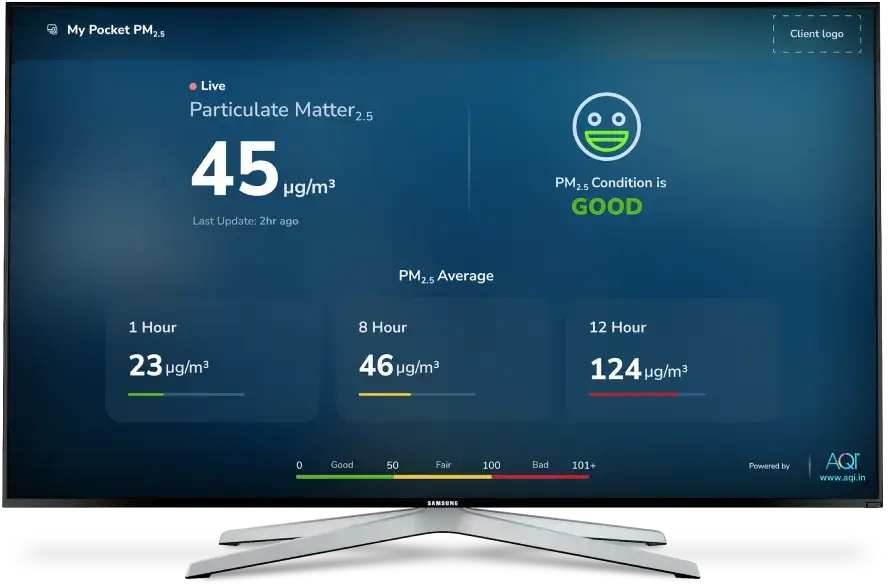
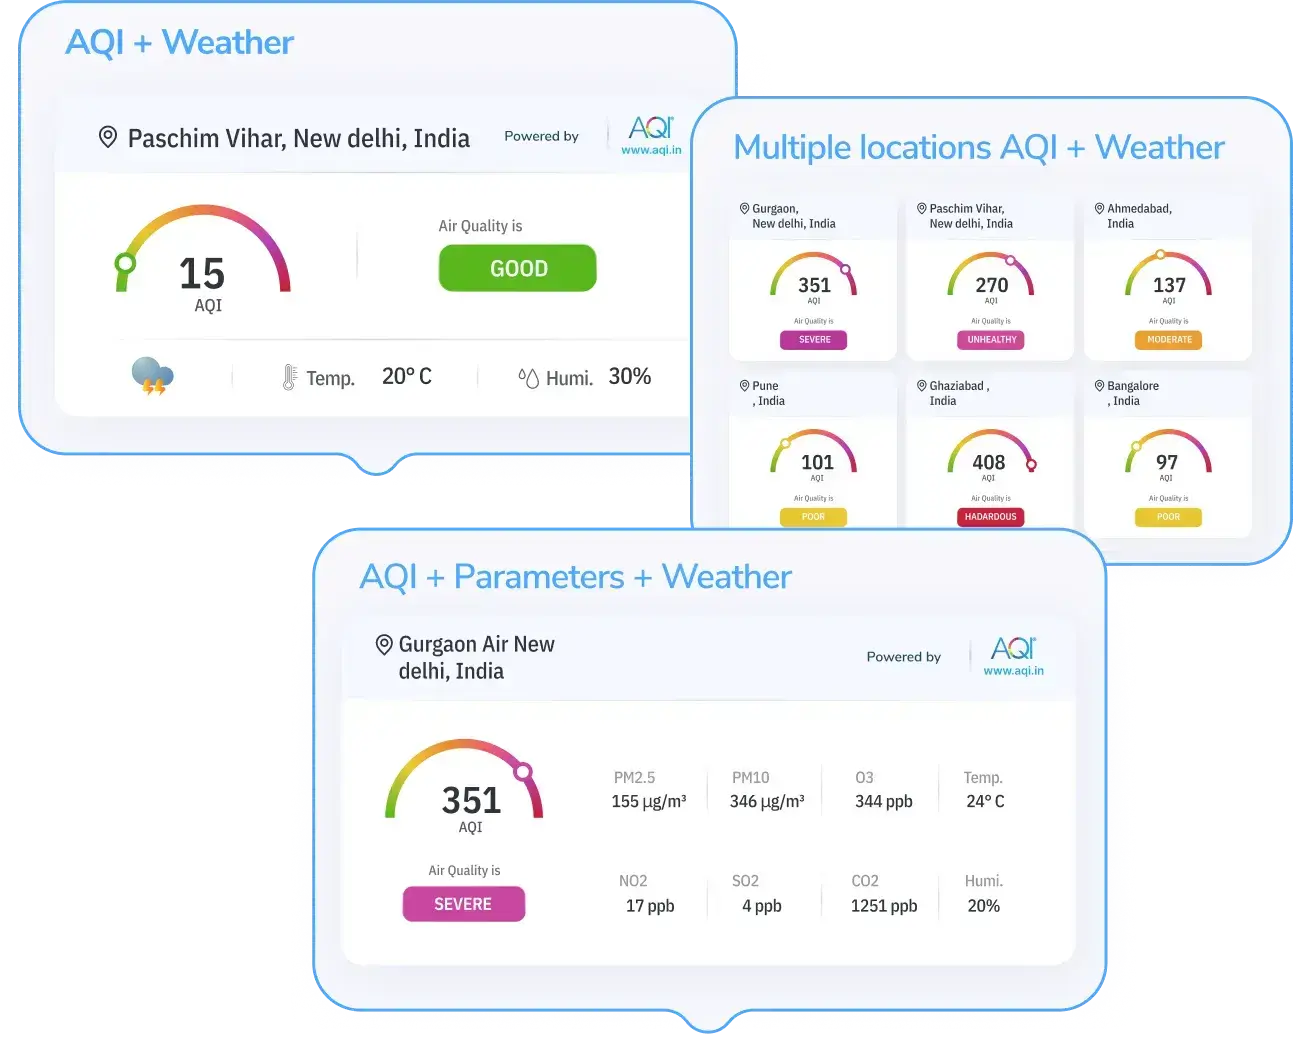
Real-time Air Quality Index (AQI)
Air Quality Index (AQI) Scale
Know about the category of air quality index (AQI) your ambient air falls in and what it implies.


Cair +
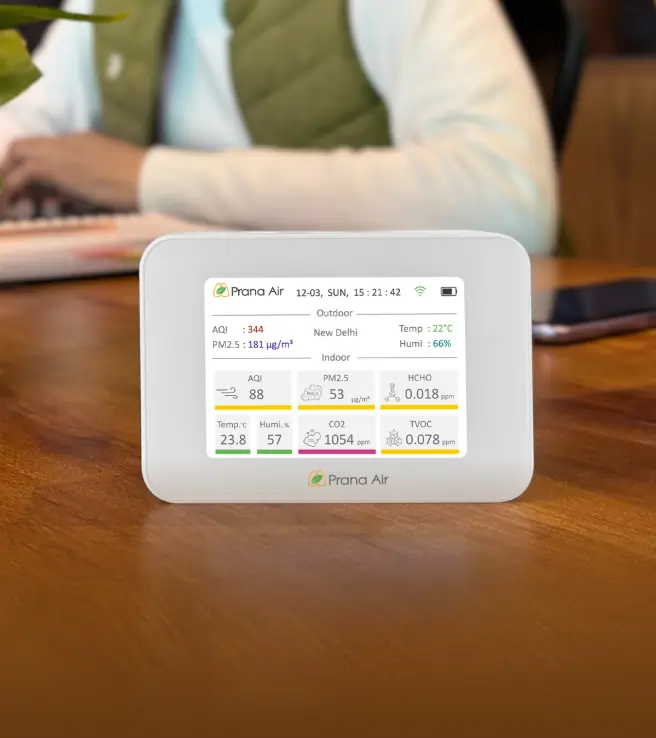
Indoor Air Quality Monitor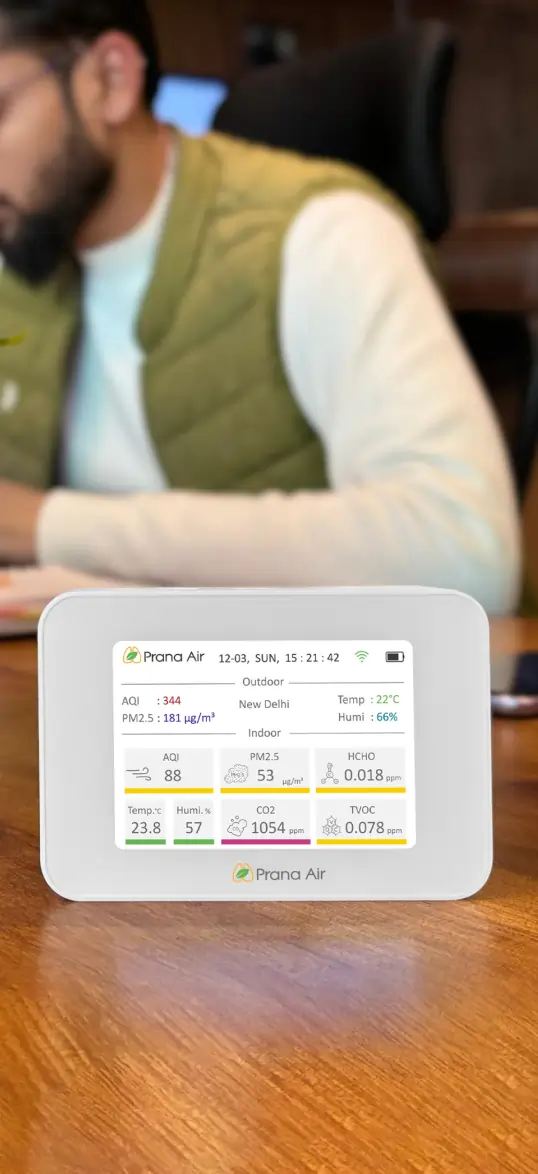
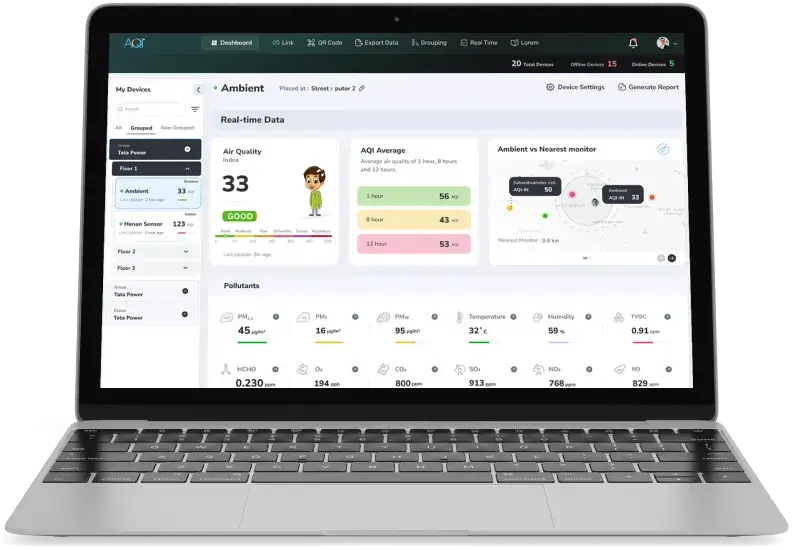
AQI Data Analytics Solutions
Air quality data monitoring platforms
Air Quality Solutions
Explore the solutions of air quality monitoring & clean air.
Here are some applications that you can go through to find out the solutions.


Recent AQI Blogs
Read the latest news
Here are some latest blogs that you can go through to find out more air pollution.


Editor's Pick
AQI.in is India’s leading platform for air quality monitoring, as featured in The Economic Times. Discover our journey from humble beginnings to becoming the nation's sole provider of comprehensive air pollution data and solutions. Learn how we started from scratch and now offer top-tier tools and services to combat air pollution effectively.
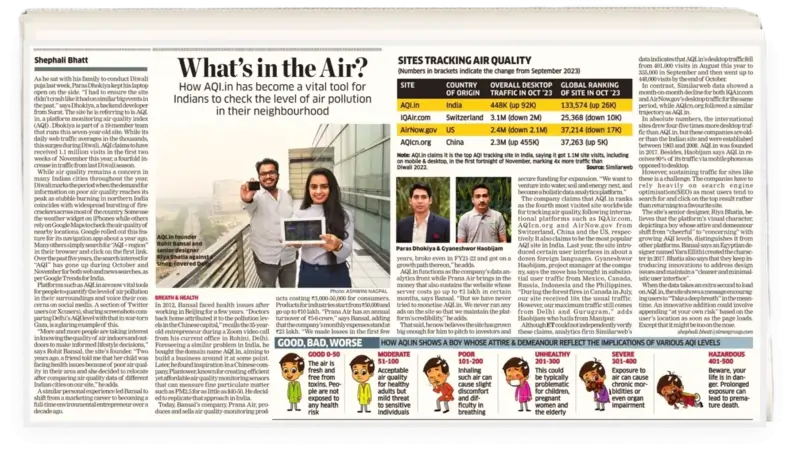
Media Coverage
AQI has been featured in media for its remarkable growth and innovation

Trusted by
Some of the Industry’s Top Organisations


Air Quality Around The World
Real-time air quality monitoring around the world.
