24 hrs avg AQI
PM2.5 6.5X
The current PM2.5 concentration in Gurgaon is 6.5 times above the recommended limit given by the WHO 24 hrs air quality guidelines value.
| LOCATIONS | Status | AQI-US | AQI-IN | PM2.5 | PM10 | Temp | Humid |
|---|---|---|---|---|---|---|---|
| Vikas Sadan Gurgaon | POOR | 170 | 209 | 93 | 240 | 35 | 19 |
| Dwarka | POOR | 156 | 206 | 66 | 256 | 31 | 28 |
| Nise Gwal Pahari | POOR | 176 | 248 | 104 | 242 | 35 | 19 |
| Bramprakash Ayurvedic Hospital | MODERATE | 100 | 135 | 28 | 153 | 31 | 28 |
| Arya Nagar | POOR | 165 | 174 | 82 | 135 | 31 | 28 |
| Teri Gram | POOR | 169 | 198 | 90 | 222 | 35 | 19 |
| National Institute Of Malaria Research | POOR | 152 | 178 | 57 | 217 | 35 | 19 |
| Sector 51 | POOR | 200 | 323 | 150 | 215 | 35 | 19 |
| Sector 2 Imt | POOR | 169 | 203 | 91 | 150 | 36 | 21 |
| Municipal Corporation Office | POOR | 165 | 221 | 83 | 271 | 36 | 20 |
| Masani | POOR | 190 | 308 | 131 | 211 | 35 | 20 |
| Ruchi Vihar | POOR | 151 | 139 | 56 | 158 | 35 | 19 |
| Aerocity | POOR | 153 | 152 | 60 | 178 | 35 | 19 |
| Najafgarh | POOR | 156 | 185 | 66 | 227 | 35 | 19 |
| Vasant Kunj Sector C | POOR | 144 | 137 | 53 | 156 | 35 | 19 |
| Radhey Mohan Drive 2 | POOR | 170 | 210 | 93 | 218 | 35 | 19 |
| Mata mandir Road | POOR | 155 | 145 | 64 | 168 | 35 | 19 |
| DLF Phase 2 Sector 25 | POOR | 167 | 187 | 86 | 182 | 35 | 19 |
| DLF Phase 2 | POOR | 172 | 220 | 96 | 190 | 35 | 19 |
| DLF Phase 1 | POOR | 163 | 160 | 78 | 171 | 35 | 19 |
| Sushant Lok Phase 1 | POOR | 165 | 177 | 83 | 172 | 35 | 19 |
| Sector 6 Manesar | POOR | 188 | 306 | 128 | 200 | 35 | 19 |
| Sector 31 | POOR | 188 | 306 | 128 | 208 | 35 | 19 |
| Sector 42 | POOR | 165 | 173 | 82 | 169 | 35 | 19 |
| DLF Phase 5 | POOR | 162 | 157 | 77 | 162 | 35 | 19 |
| Sector 14 | POOR | 182 | 283 | 115 | 199 | 35 | 19 |
| Sector 59 | POOR | 197 | 319 | 145 | 235 | 35 | 20 |
| DLF Park Place | POOR | 161 | 150 | 75 | 159 | 35 | 19 |
| Sector 49 | POOR | 196 | 317 | 142 | 209 | 35 | 19 |
| Kanahi | POOR | 162 | 157 | 77 | 162 | 35 | 19 |
| Sector 57 | UNHEALTHY | 205 | 327 | 155 | 220 | 35 | 20 |
| Vatika City | POOR | 198 | 321 | 147 | 209 | 35 | 19 |
| Sector 47 | POOR | 195 | 315 | 140 | 201 | 35 | 19 |
| Tikri | POOR | 193 | 312 | 136 | 196 | 35 | 19 |
| Sector 65 | UNHEALTHY | 201 | 324 | 151 | 213 | 35 | 19 |
| Aravalli Park Nursery End | POOR | 160 | 143 | 72 | 165 | 35 | 19 |
| Aravalli Park Radhakrishna Mandir | POOR | 154 | 137 | 61 | 156 | 35 | 19 |
| Old sector 62 | POOR | 196 | 317 | 142 | 212 | 35 | 19 |
| Sector 28 | POOR | 166 | 180 | 84 | 172 | 35 | 19 |
| Sector 43 | POOR | 161 | 150 | 75 | 156 | 35 | 19 |
| Heritage One Tower A | POOR | 194 | 315 | 139 | 209 | 35 | 19 |
| Sector 56 | POOR | 172 | 223 | 97 | 171 | 35 | 19 |
| Belvedere Towers | POOR | 163 | 160 | 78 | 171 | 35 | 19 |
| The Laburnum | POOR | 166 | 180 | 84 | 169 | 35 | 19 |
| DLF 1 | POOR | 161 | 150 | 75 | 159 | 35 | 19 |
| The Aralias | POOR | 161 | 147 | 74 | 158 | 35 | 19 |
| Aravali Park Entrance | POOR | 157 | 140 | 67 | 160 | 35 | 19 |
| Sector 72 | POOR | 192 | 312 | 135 | 195 | 35 | 19 |
| Aravalli Park Middle | POOR | 155 | 137 | 63 | 155 | 35 | 19 |
| Sector 62 | POOR | 193 | 313 | 137 | 200 | 35 | 20 |
| HUDA Office GMDA | POOR | 191 | 310 | 133 | 209 | 35 | 19 |
| Tau Devilal Bio diversity Park GMDA | POOR | 176 | 247 | 104 | 174 | 35 | 20 |
| GMDA Leisure Valley Park | POOR | 164 | 167 | 80 | 162 | 35 | 20 |
| Sector 5 | POOR | 187 | 305 | 126 | 208 | 35 | 19 |
| Carterpuri GMDA | POOR | 175 | 240 | 102 | 180 | 35 | 19 |
| Cremeation Ground | POOR | 105 | 70 | 37 | 70 | 37 | 13 |
| NASA AQCS 121 | UNHEALTHY | 216 | 335 | 166 | 231 | 35 | 19 |
Local Time
Wind speed
33 km/h
UV Index
16
Pressure
800 mb
Wear Mask
Stay Indoor
Windows
Use Purifier
Family
AQI
AQI
AQI
AQI
AQI
AQI
AQI
Gurgaon
24 hrs avg AQI
Quick answers to some commonly asked questions about the air pollution of Gurgaon.
The real-time air quality in Gurgaon is 220 (POOR) AQI now. This was last updated 3 minutes ago .
The current concentration of PM2.5 in Gurgaon is 97 (µg/m³). The World Health Organisation (WHO) recommends 15 µg/m³ as the threshold concentration of PM2.5 for 24 hrs mean. Currently, the concentration is 3.88 times the recommended limit.
Generally, the air quality at Gurgaon starts deteriorating in late October. The winters are the worst-hit season in terms of air pollution.
You should wear a good N95 mask when you go outdoor in Gurgaon until the AQI is improving upto moderate range.
Office going people should avoid personal vehicles and use public transportations or carpooling.
(i) The primary causes of outdoor air pollution are solid, liquid particles called aerosols & gase from vehicles emissions, construction activities, factories, burning stubble & fossil fuels and wildfire, etc.
(ii) Main causes of indoor air pollution are harmful gases from cooking fuels (such as wood, crop wastes, charcoal, coal and dung), damp, mould smoke, chemicals from cleaning materials, etc.
Indoor air pollution in Gurgaon is as dangerous as outdoor pollution, because the air pollutants come inside the houses or buildings through doors, windows and ventilation.
In Gurgaon , you must use an air purifier or fresh air machine at home or office indoor and close all the doors, windows and ventilations when the outdoor air quality index (aqi) in Gurgaon is very high. Proper ventilation is highly recommended only when outdoor air quality is improving and moderate AQI range.
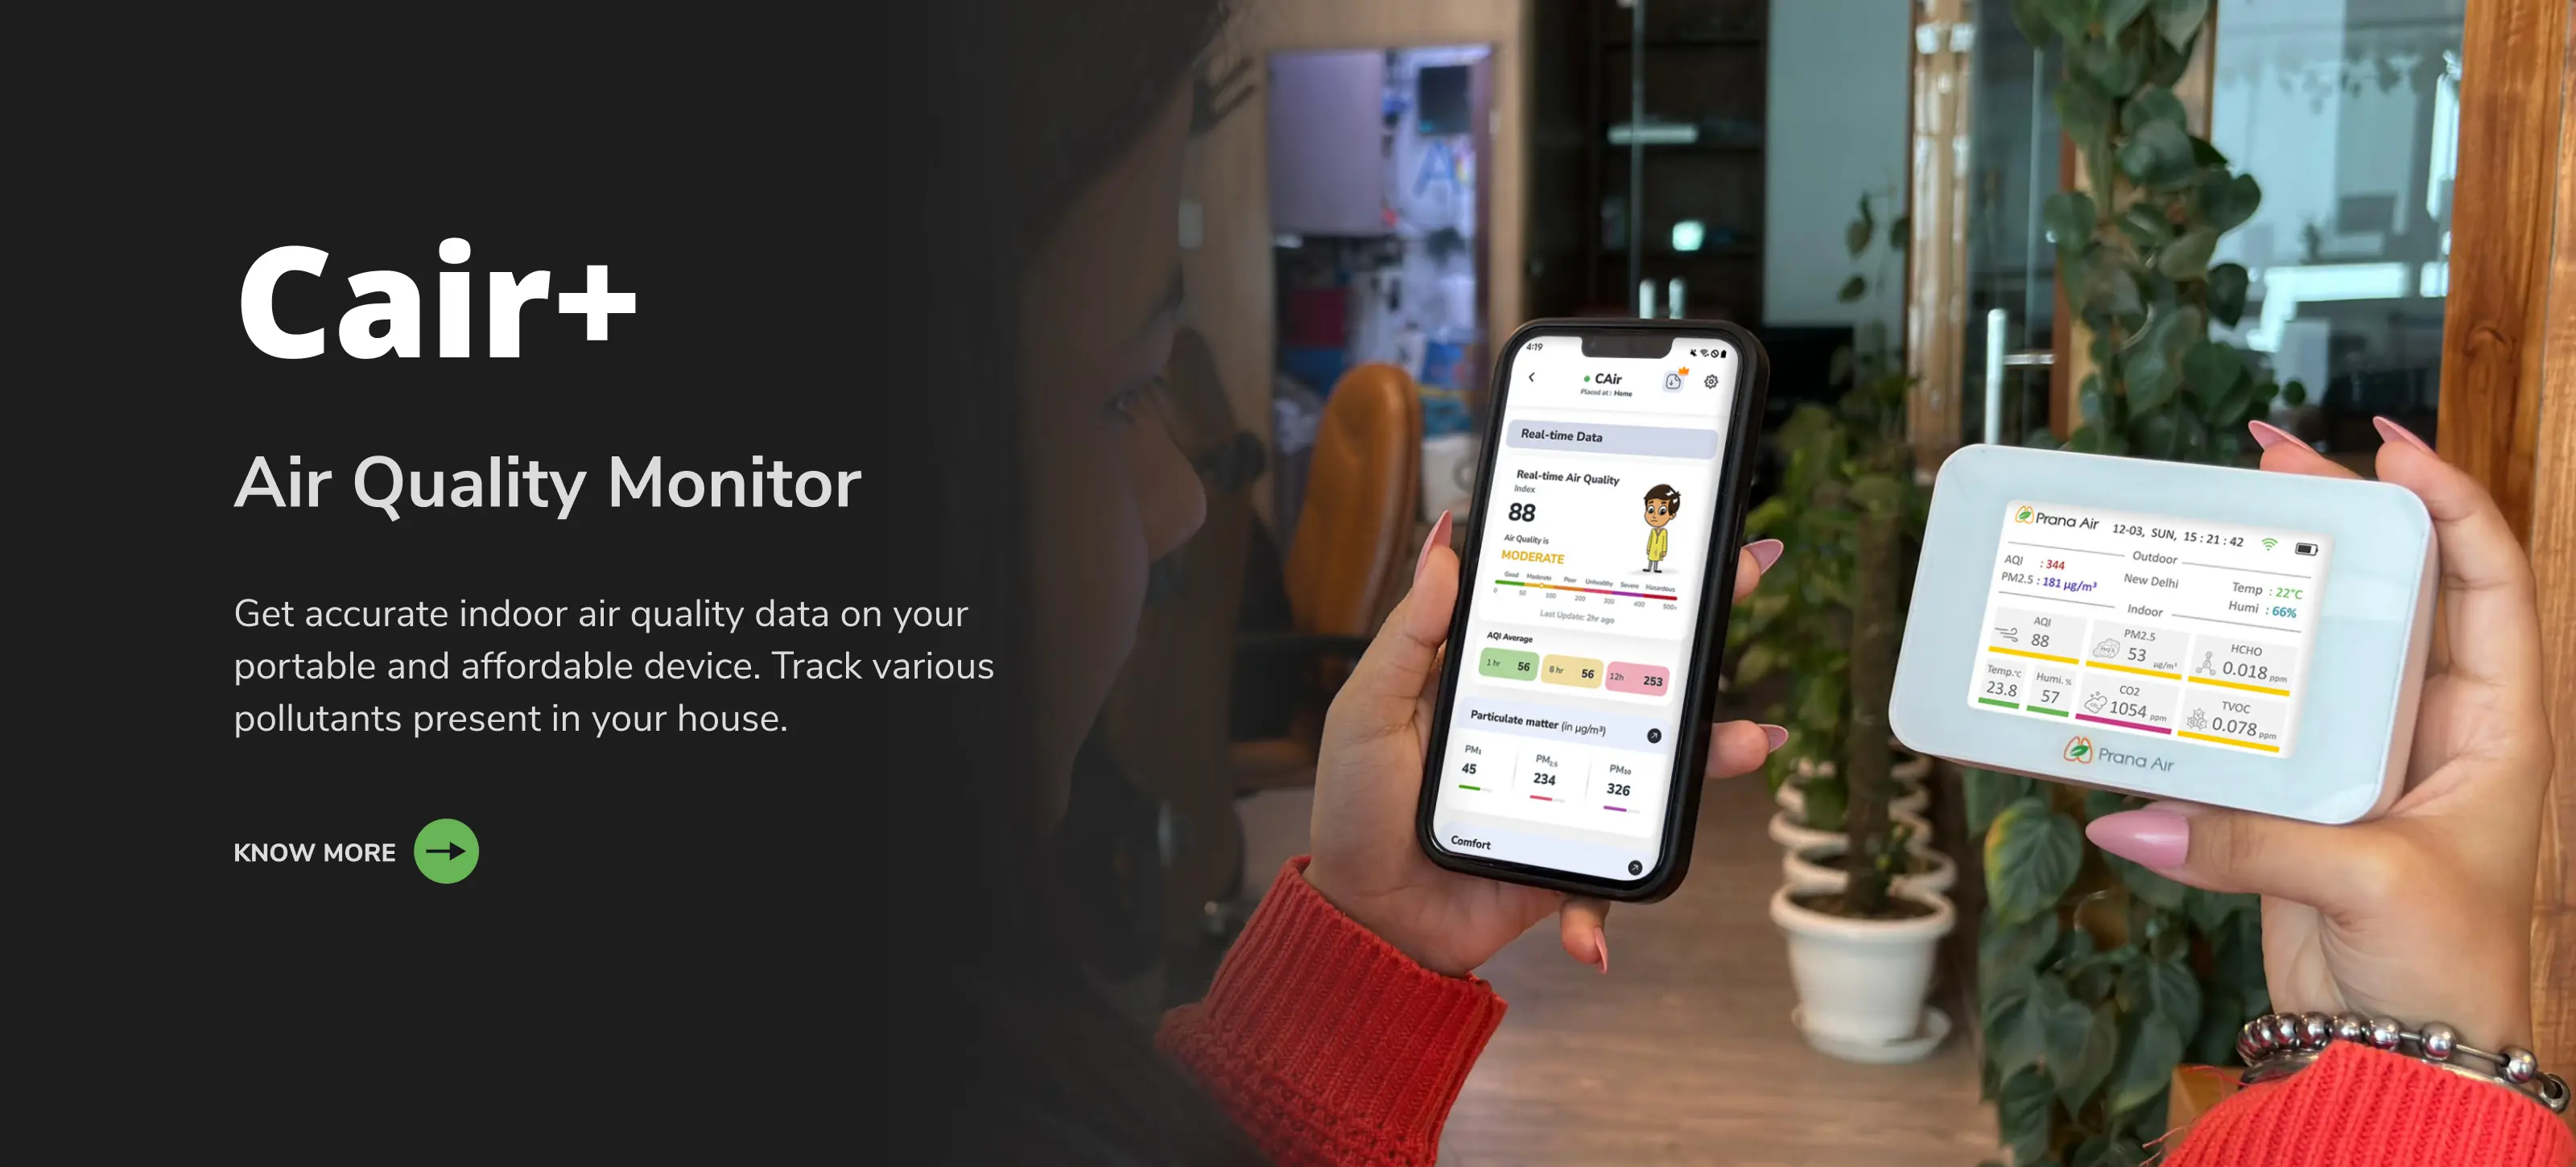
Find out Prana Air's air quality monitors & solutions to fight air pollution in your city.

Know what the quality your are breathing with Prana Air monitors (low-cost & accurate).

Analyze the quality of air anywhere with accurate & compact gas & pm sensors.

Purify your indoor air & make it free from air pollution and toxins with our air purifier.

Make sure you breathe fresh inside your car with a highly efficient car cabin filter.

Breathe pure air with Prana Air motorized masks of multi-layer hepa filter purification.
Gurgaon, sometimes known as Gurugram, is a city in India's National Capital Region, near the Delhi-Haryana border. With an estimated population of 11,53,000, according to the 2011 Census of India, it is India's second-largest IT center and third-largest financial hub. Gurgaon is one of India's top five most polluted cities, as well as one of the world's top 30 most polluted cities. Air pollution has resulted from rapid population increase, and the situation is still deteriorating.
Gurgaon is one of India's most polluted cities due to a variety of air pollution sources. Listed below are a handful of them:
1. Vehicle Emissions: Gurgaon has the largest percentage of people who own a vehicle. The main source of air pollution in the city is vehicular emissions and traffic congestion. Pollutants such as ozone (which is created when hydrocarbons and nitrogen oxides react with sunlight and heat), carbon monoxide, particulates, hydrocarbons, nitrogen oxides, sulfur dioxide, and volatile organic compounds can be released.
2. Emissions from industries: Industrial emissions contribute 7%-9% of Gurgaon's air pollution. Oil burning produces major pollutants such as nitrogen oxides and sulfur, whereas coal combustion produces particle air pollution. When coal is utilized for combustion, the main pollutants created are nitrogen oxides, sulfur dioxide, and coal ash.
3. Diesel generator sets: Haryana government officials estimated that over 14,000 diesel generator sets are currently operational in Gurugram (2019). They contain carcinogens such as benzene, arsenic, and formaldehyde, which can cause cancer. There are also other severe environmental toxins present, such as nitrogen oxide, which depletes the ozone layer. According to a study published in 2018 by the Centre for Science and Environment (CSE), the usage of diesel generator sets enhances the concentration of Particulate matter in Gurgaon by 30%.
4. Thermal power plants: Coal-fired power plants are the most polluting industry in terms of SO2, accounting for around 67 percent of SO2 emissions in Delhi NCR. Thermal power plants emit pollutants such as nitrogen oxides, methane, sulfur oxides, co2, CFCs, and aerosols such as wood ash and soot.
5. Residential sources: Recent studies have found that residential emissions can contribute up to 50% of the measured particulate matter concentrations in an urban setting, resulting in significant annual mortalities in cities like Gurugram. Construction materials (insulation, roofing shingles, fire retardants, and so on), Biological Pollutants (bacteria, viruses, pet dander, mold, and so on), carbon monoxide, formaldehyde, nitrogen dioxide, lead, radon, particulate matter, smoke (wood and tobacco), volatile organic compounds (VOCs), and so on are some of the sources.
Exposure to air pollution leads to various short-term and long-term impacts on citizens' health. Air pollution also contributes to several mental health issues, including cognitive impairment, a higher risk of dementia, and a negative impact on baby neurogenesis.
● Gurgaon is one of the cities with a high ratio of people owning a car or vehicle to the total number of people. Vehicle emissions make people more vulnerable to respiratory ailments like pneumonia and bronchitis, aggravate asthma, and impair lung capacity.
● Birth defects, cancer, immune function abnormalities, kidney and liver dysfunction, lung and respiratory ailments, and neurotoxic disorders are all linked to industrial pollution.
● Irritation in the eyes, skin, and lungs, blood disorders, cancer, and skin lesions.
● Emissions from thermal power plants may lead to chest pain, lung damage, coughing, shortness of breath, throat irritation, worsen asthma, sleepiness, drowsiness, etc.
● Exposure to residential sources can increase one’s risk of developing lung disease, skin, eye, nose, and throat irritation, health issues with the nervous, cardiovascular, and reproductive systems, dizziness, unconsciousness, learning, and behavioral issues in children, respiratory diseases, central nervous system damage, health issues with the nervous, cardiovascular systems, and even deaths.
A study done by ARAI and TERI (2018) indicates that the transportation sector contributes 16-27 % and 14-23 % of PM2.5 and PM10 pollution, respectively, while the industrial sector contributes 13-30 % and 13-26 %, respectively. Dust, on the other hand, has a higher contribution to PM2.5 and PM10 pollution, ranging from 20 to 49 % and 23 to 52 %, respectively. Residential and other sources make up the rest of the contribution. This emphasizes the necessity for a multi-sectoral strategy for Gurgaon's air pollution problem.
The Central and State governments have issued numerous action plans and rules that apply to the air pollution in Gurgaon. At the city level, the Pollution Control Board plays an important role in pollution prevention and control. The following are some of the measures that aid in the reduction of air pollution:
1. The Ministry of Environment, Forests, and Climate Change (MOEFCC) has launched the National Clean Air Program (NCAP) across India.
2. The Gurgaon district administration recently drafted an action plan to reduce air pollution, which was implemented in October 2020.
3. Gurugram has joined up for the Cycles4Change Challenge organized by the Centre.
4. In 2017, the Graded Response Action Plan (GRAP) was notified for emergency action during periods of heavy pollution.
5. The Environment Pollution (Prevention and Control) Authority had been tasked by the Central Government with implementing GRAP in the NCR region (EPCA).
6. Pet-coke and Furnace Oil Bans: In 2017, the Supreme Court in Delhi, Haryana, Rajasthan, and Uttar Pradesh banned the use of petroleum coke and furnace oil for combustion.
7. NOx and SOx limits have been established.
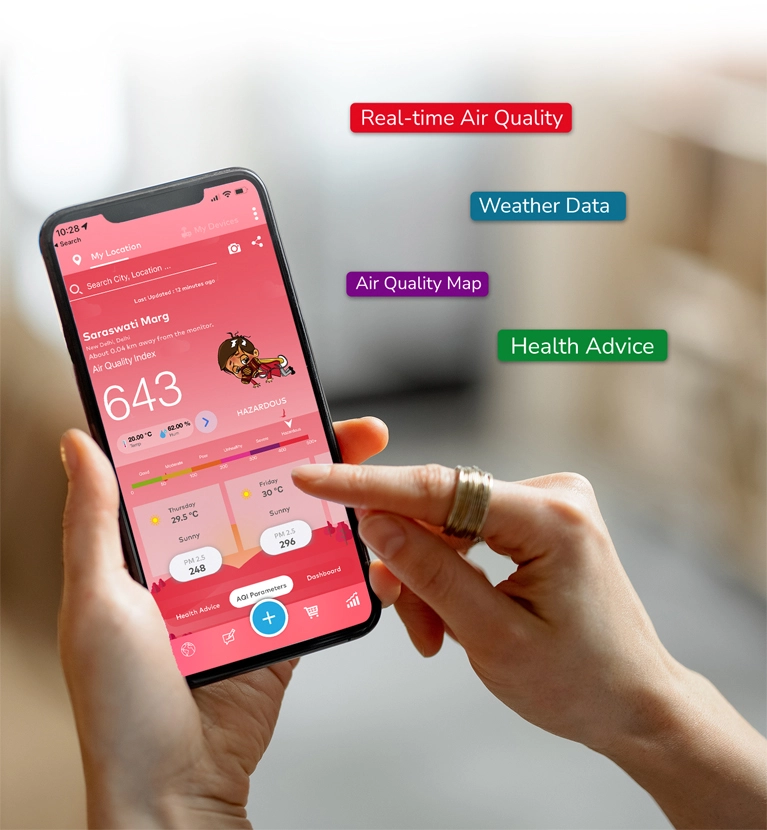
Know what you breathe and the quality of air in your city and nearby locations. Real-time AQI, map, weather & fire data, health advice with insightful & anlytical dasbboards.