Thunder Bay空气质量指数(AQI) | 空气污染
Thunder Bay实时PM2.5、PM10空气污染水平
最后更新:2026-09-29 16:31 (本地时间)



17 °C
Rain Shower


目前Thunder Bay的空气质量在全球城市中排名较好。
 Map
MapThunder Bay


Canada 的热门趋势

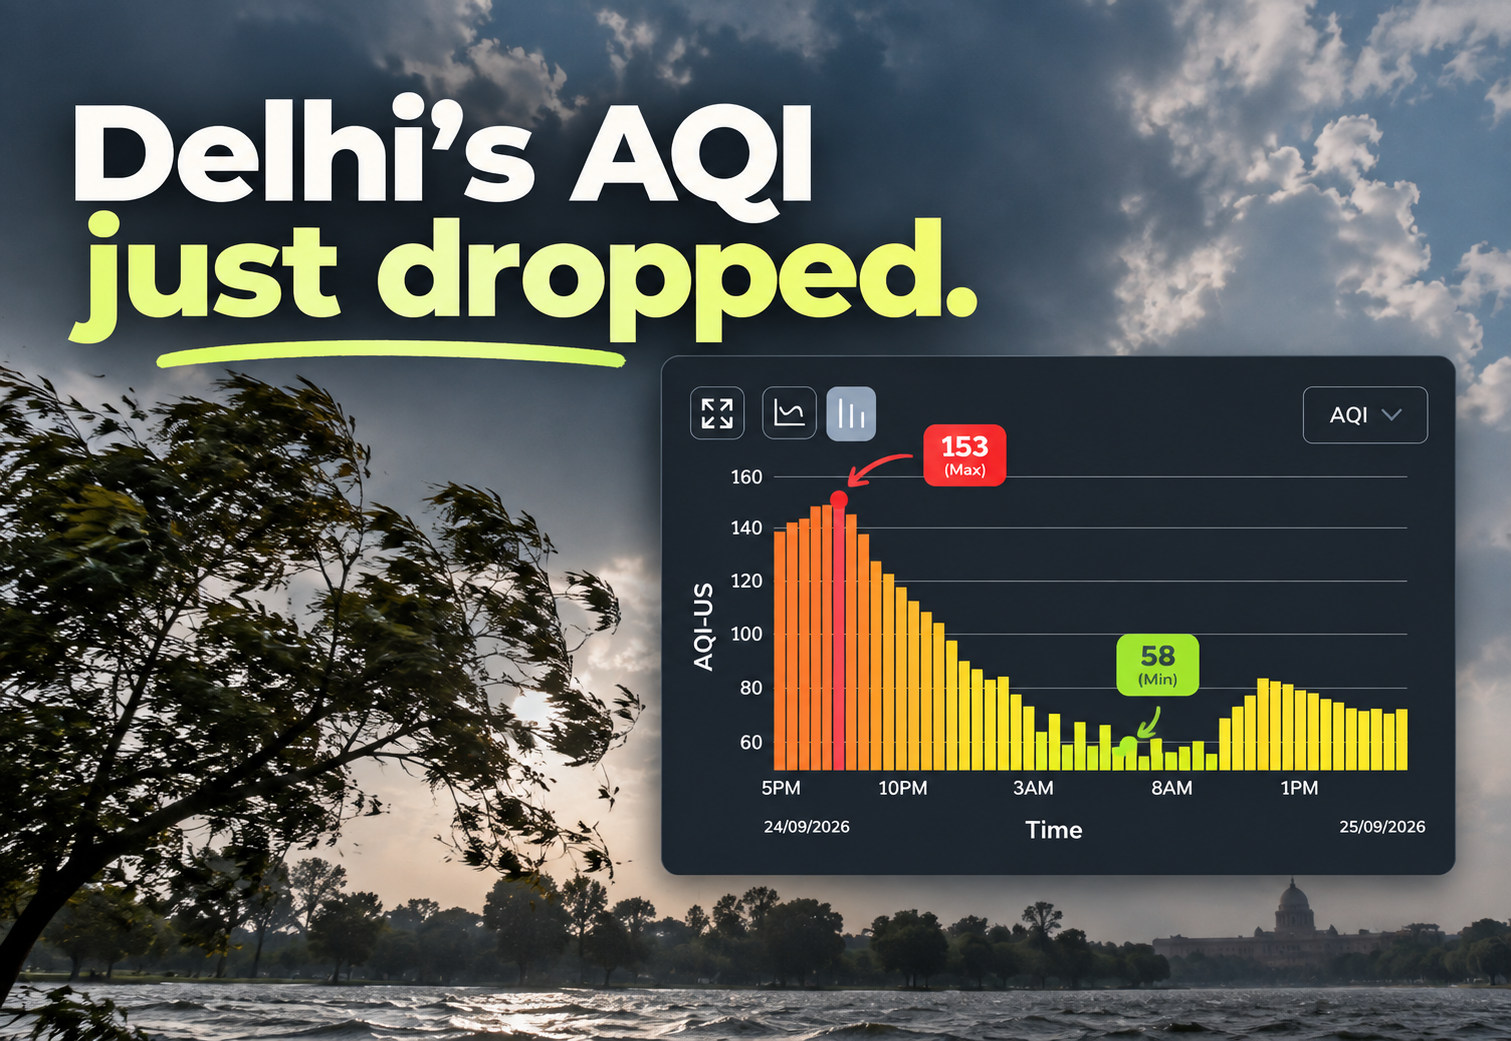
Delhi’s AQI Dropped Overnight. But Why? 🌬️
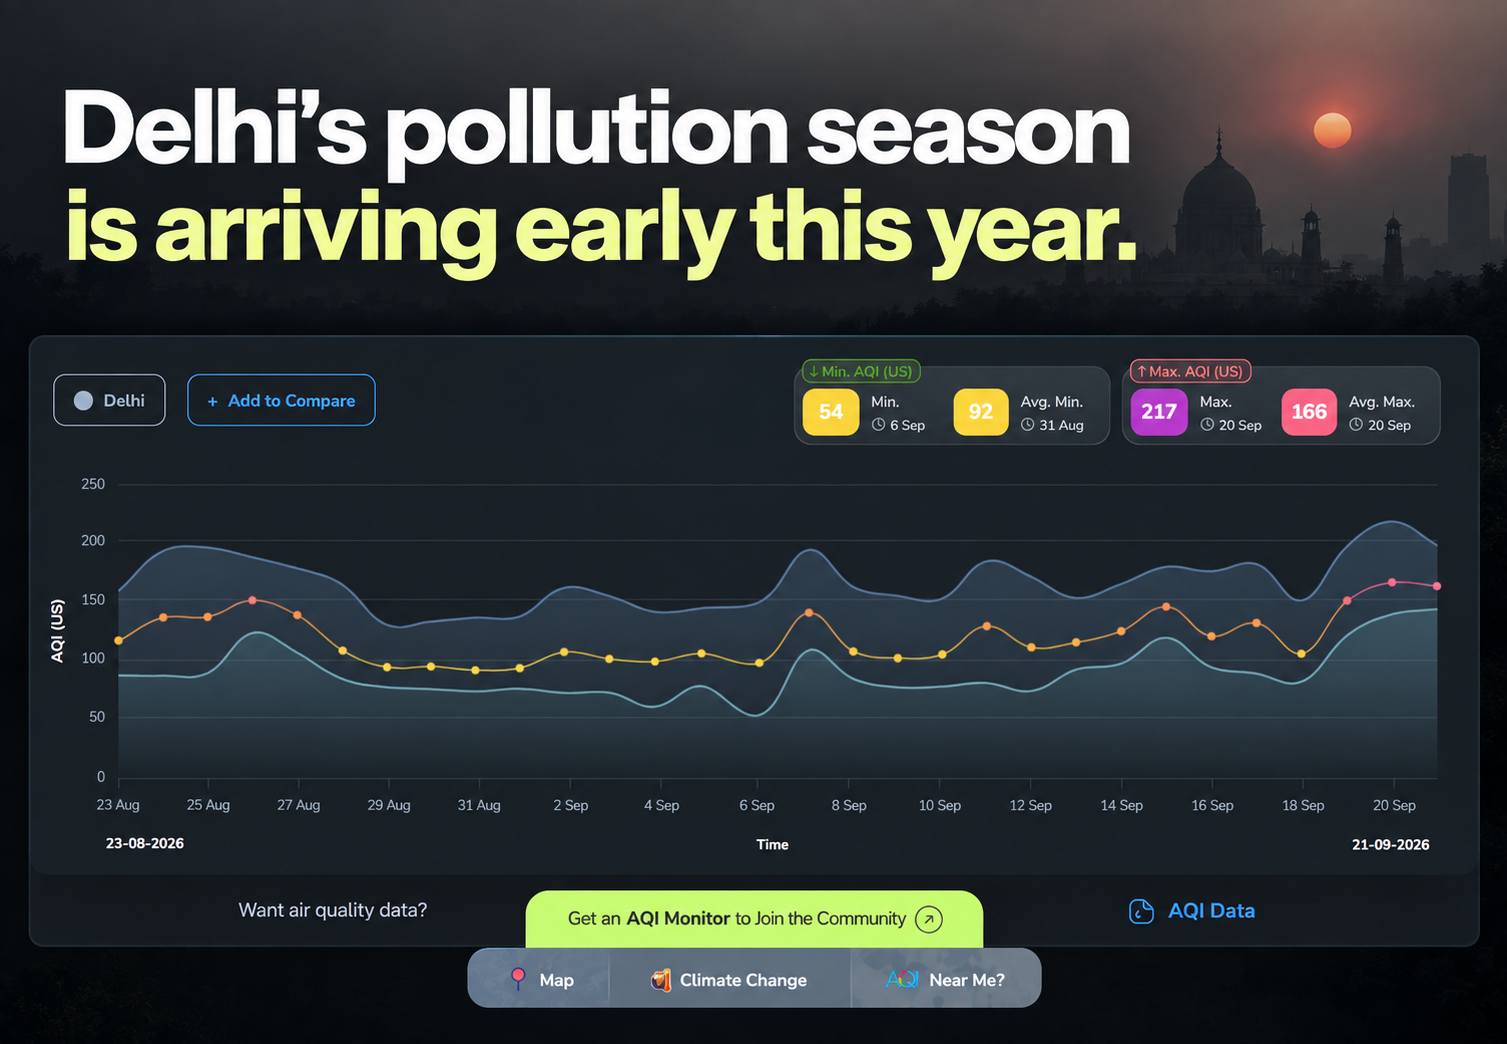
Delhi’s Pollution Season Is Arriving Early This Year
AQI图表
历史空气质量数据
Thunder Bay
AQI (US) 趋势 - 年度空气质量变化
Thunder Bay, Ontario, Canada
Thunder Bay的位置
实时空气污染水平
Canada的大城市
空气质量指数


空气质量日历 2026
Thunder Bay
为生活在此地的人提供健康建议
Thunder Bay
0Cigarettes per day
呼吸顺畅,保持活跃!空气质量非常适合享受户外活动。
来源:
Berkeley Earth
针对当前AQI (US)的解决方案


预防健康问题:了解您的风险
Thunder Bay
 哮喘
哮喘 心脏问题
心脏问题 过敏
过敏 鼻窦炎
鼻窦炎 感冒/流感
感冒/流感 慢性阻塞性肺疾病(COPD)


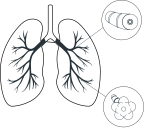
2026年污染最严重的城市
Canada
分析该国实时空气污染最严重的城市。
标准值
1.
Nanaimo, British Columbia
适中
2xabove Standard
2.
New Westminster, British Columbia
适中
2xabove Standard
3.
Delta, British Columbia
适中
2xabove Standard
4.
Chilliwack, British Columbia
适中
2xabove Standard
5.
Pitt Meadows, British Columbia
适中
2xabove Standard
6.
Sooke, British Columbia
适中
2xabove Standard
7.
Duncan, British Columbia
适中
2xabove Standard
8.
Richmond, British Columbia
适中
2xabove Standard
9.
Victoria, British Columbia
适中
2xabove Standard
10.
Abbotsford, British Columbia
适中
2xabove Standard
最后更新:29 Sept 2026, 08:36 PM
AQI城市排名Air Quality Solutions For Thunder Bay
探索空气质量监测与清洁空气的解决方案。
以下是一些应用,您可以查看以了解解决方案。
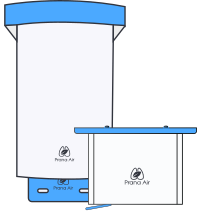

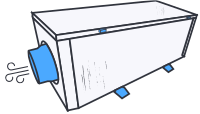
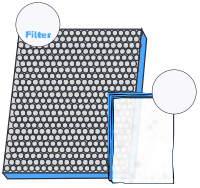


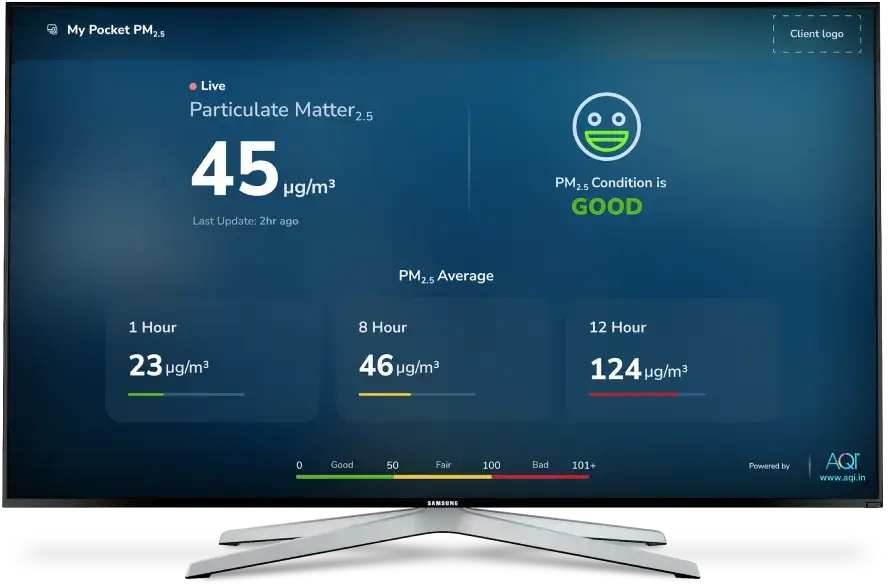
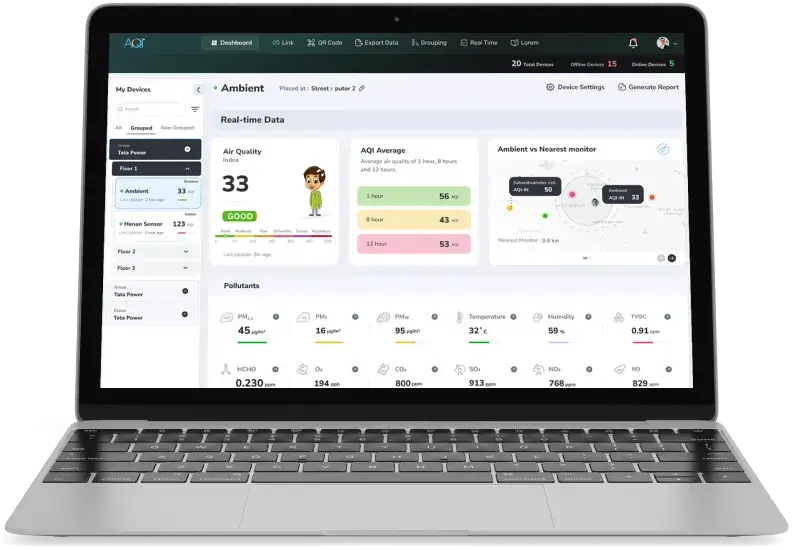
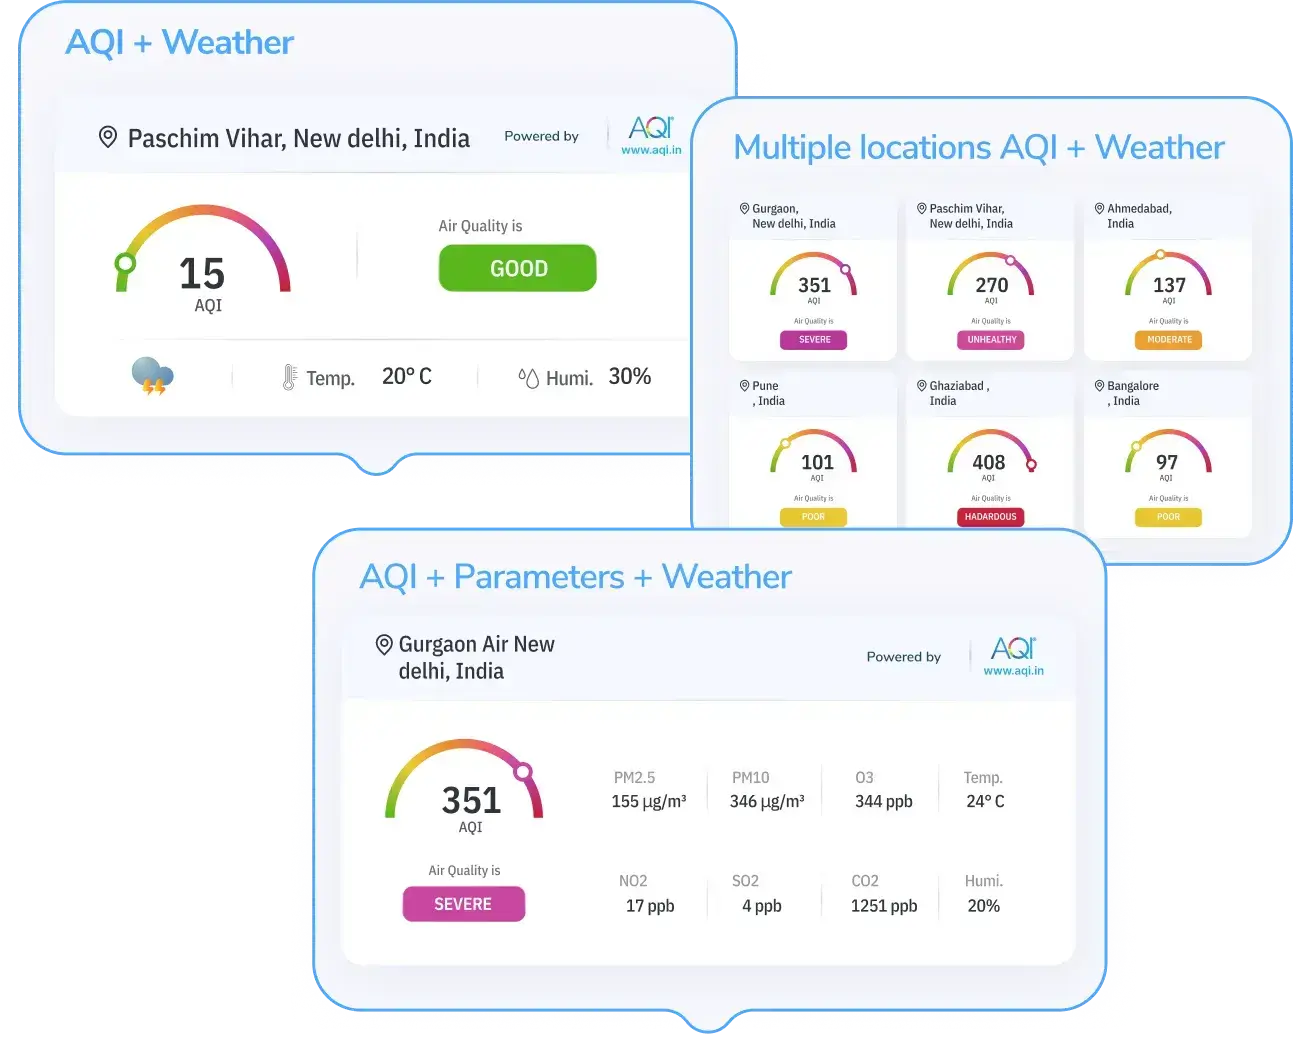
Thunder Bay的空气质量指数数据分析解决方案
空气质量数据监测平台
 移动应用
移动应用 智能电视应用
 网络仪表板
网络仪表板 API
API 小部件
小部件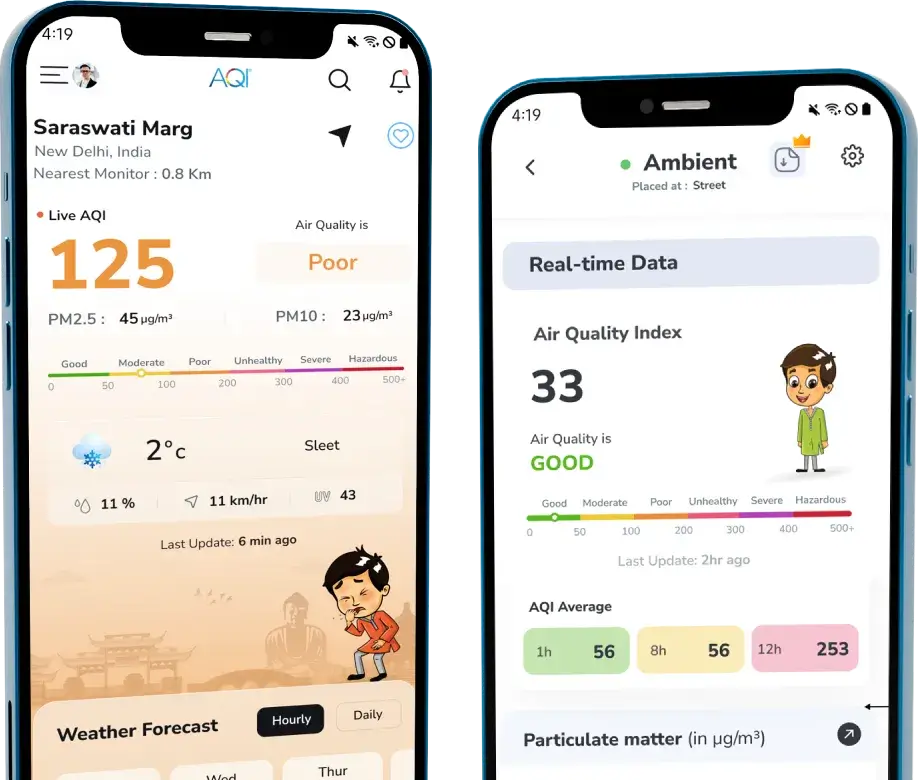











空气质量常见问题
在 Thunder Bay
关于空气质量的常见问题
1. 当前Thunder Bay的AQI (US)水平是多少?
1. 当前Thunder Bay的AQI (US)水平是多少?
Thunder Bay当前的实时AQI (US)水平由于0.19mm/hr的降雨而为33 (Good)。最后更新于2026-09-29 16:31 (本地时间)。
2. 过去24小时内Thunder Bay的最佳AQI (US)水平是什么时候?
2. 过去24小时内Thunder Bay的最佳AQI (US)水平是什么时候?
过去24小时内,最佳AQI (US)水平是18 (良好),时间为5:01 PM, Sep 28, 2026 (本地时间)。
3. 过去24小时内Thunder Bay的最差AQI (US)水平是什么时候?
3. 过去24小时内Thunder Bay的最差AQI (US)水平是什么时候?
过去24小时内,最差的AQI (US)水平是50 (良好),时间为3:31 PM (本地时间)。
4. Thunder Bay在过去24小时内AQI (US)水平的当前趋势是什么?
4. Thunder Bay在过去24小时内AQI (US)水平的当前趋势是什么?
Thunder Bay的AQI (US)水平在过去24小时内波动。最高水平是3:31 PM (本地时间)的50 ,最低水平是5:01 PM, Sep 28, 2026 (本地时间)的18 。
5. 根据Thunder Bay当前AQI (US)水平,建议采取哪些措施?
5. 根据Thunder Bay当前AQI (US)水平,建议采取哪些措施?
空气质量令人满意,空气污染对健康的风险较低或没有风险。不需要特别的预防措施,可以自由享受户外活动。
最新AQI博客
阅读最新新闻
以下是一些最新博客,您可以阅读更多关于空气污染的信息。