Indeks Kualitas Udara (AQI) New Delhi | Polusi Udara
Tingkat polusi udara PM2.5, PM10 real-time di Delhi
Terakhir Diperbarui: 2025-08-28 01:55:49 PM (Waktu Lokal)


34 °C
MistNew Delhi
Sedang Tren di India

Top CO₂ Emitting Industries in the World and Why It Matters to Everyone?
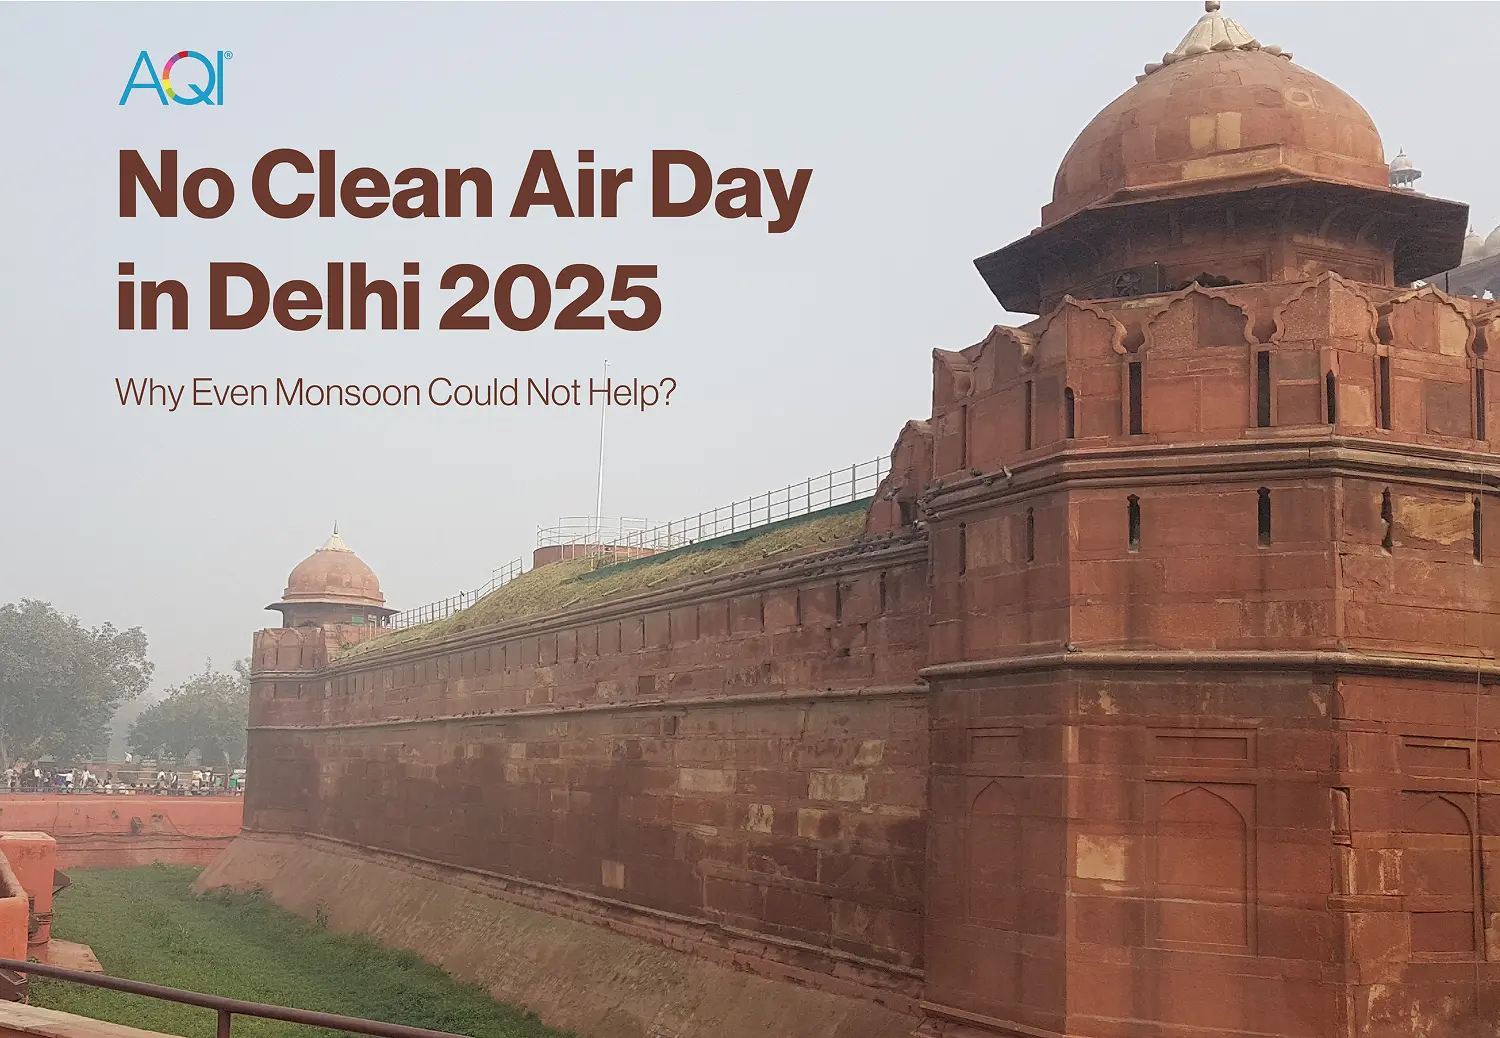
No Clean Air Day in Delhi 2025: Why Even Monsoon Could Not Help?
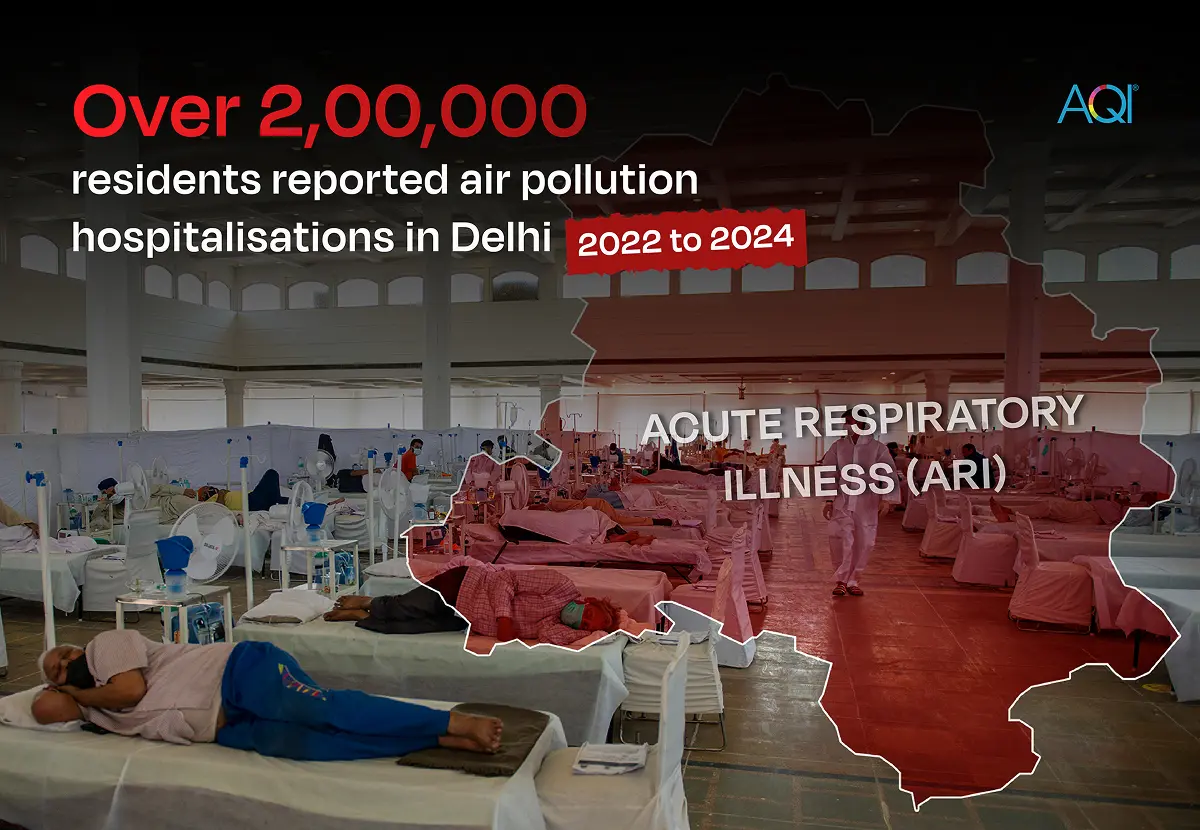
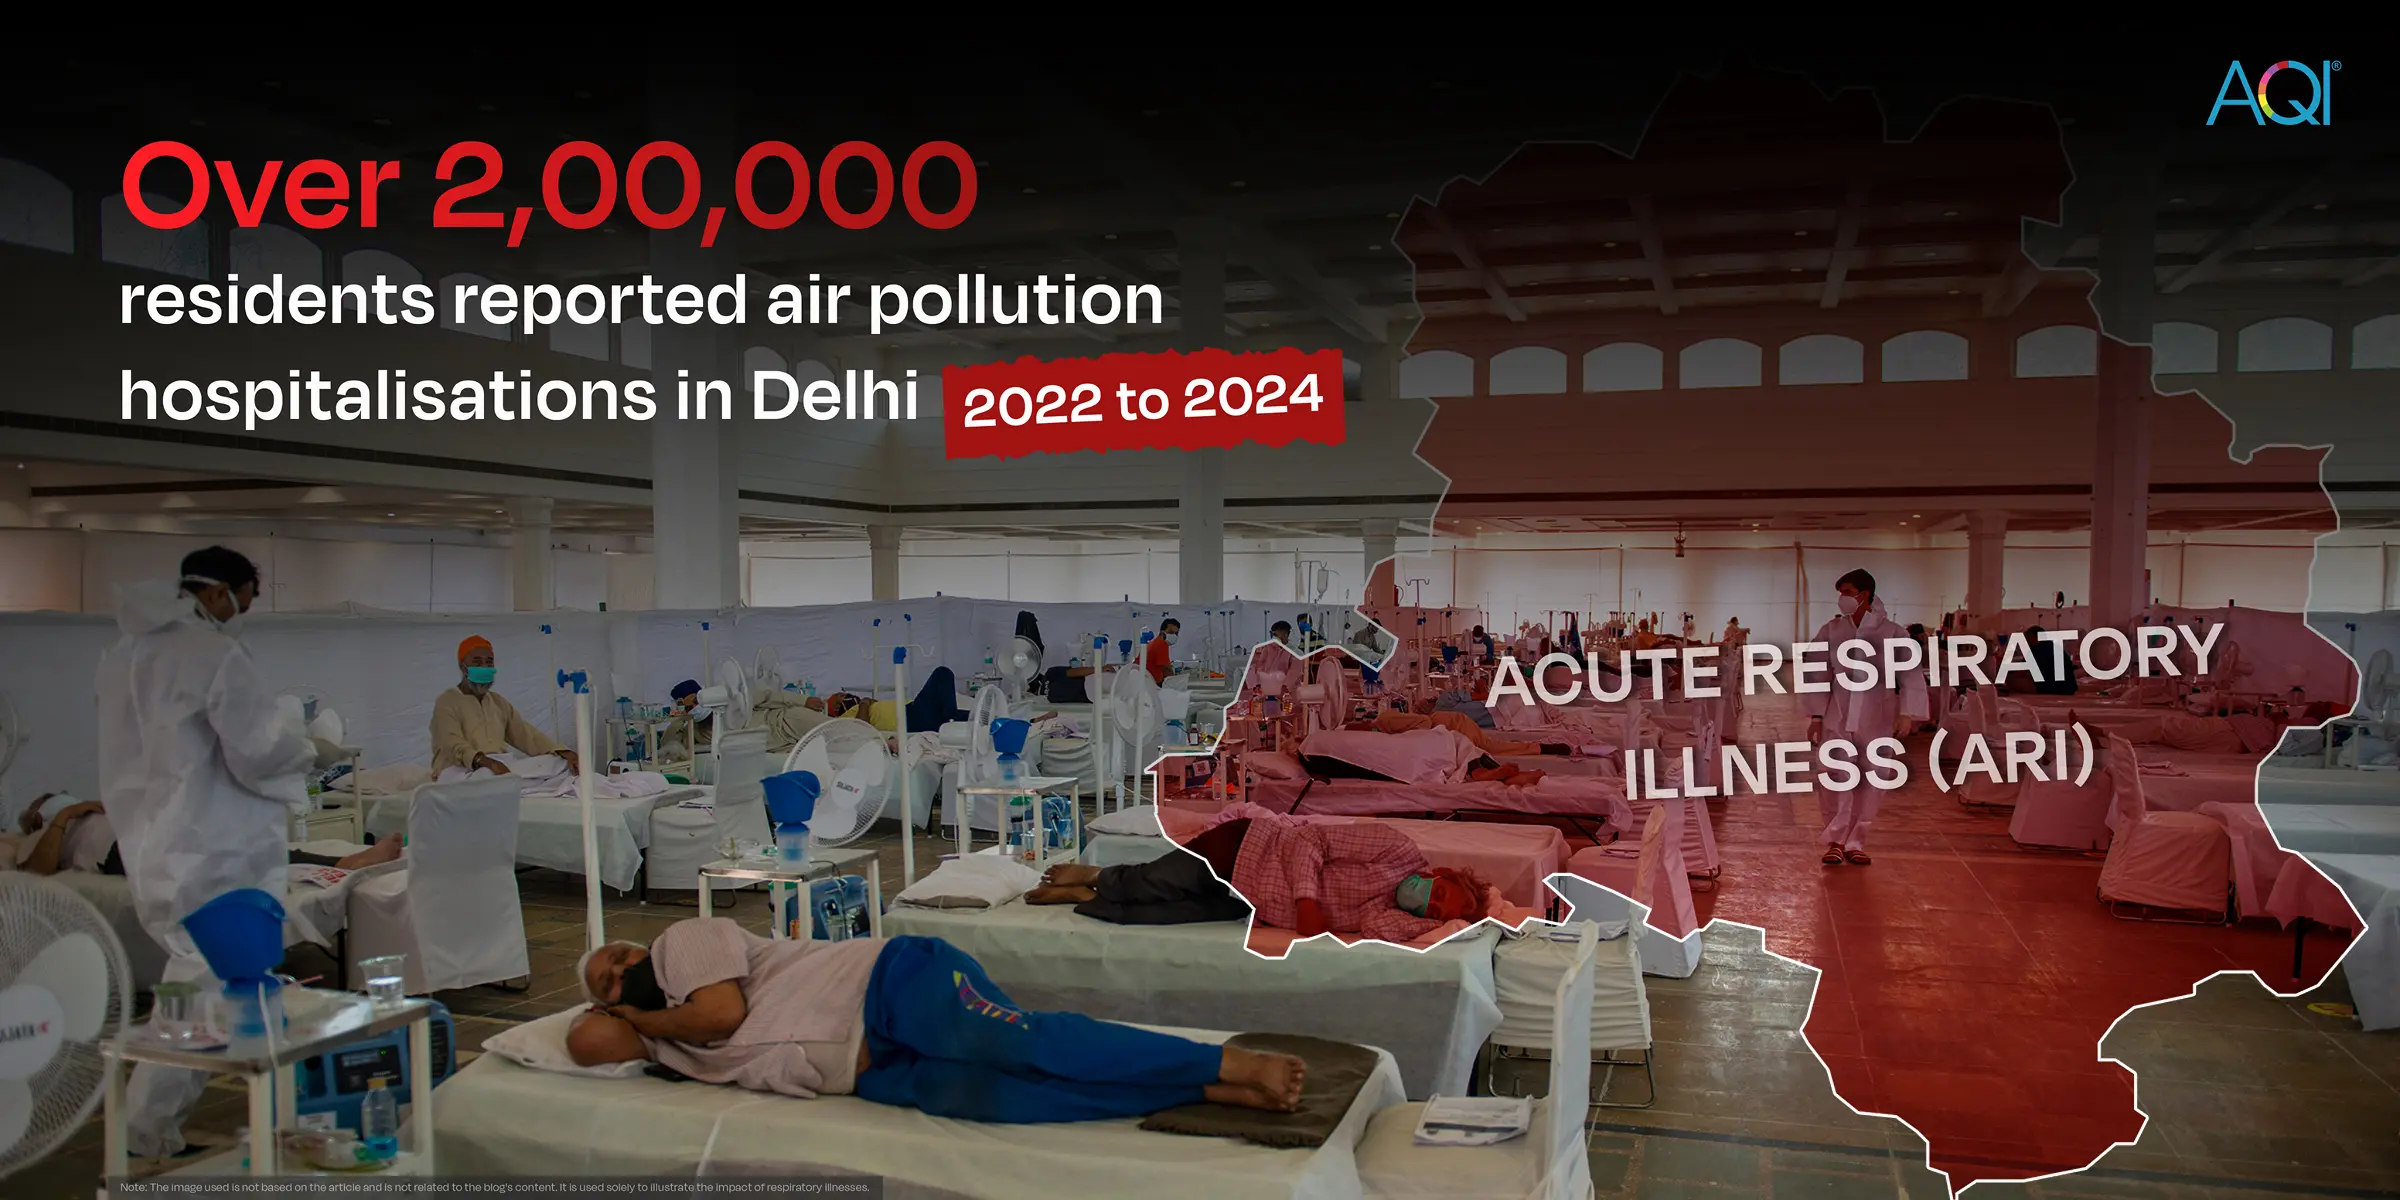
Over 2 lakh residents reported air pollution hospitalisations in Delhi from 2022 to 2024.

Why Air Quality Monitoring and Clean Air is Necessary for Schools?
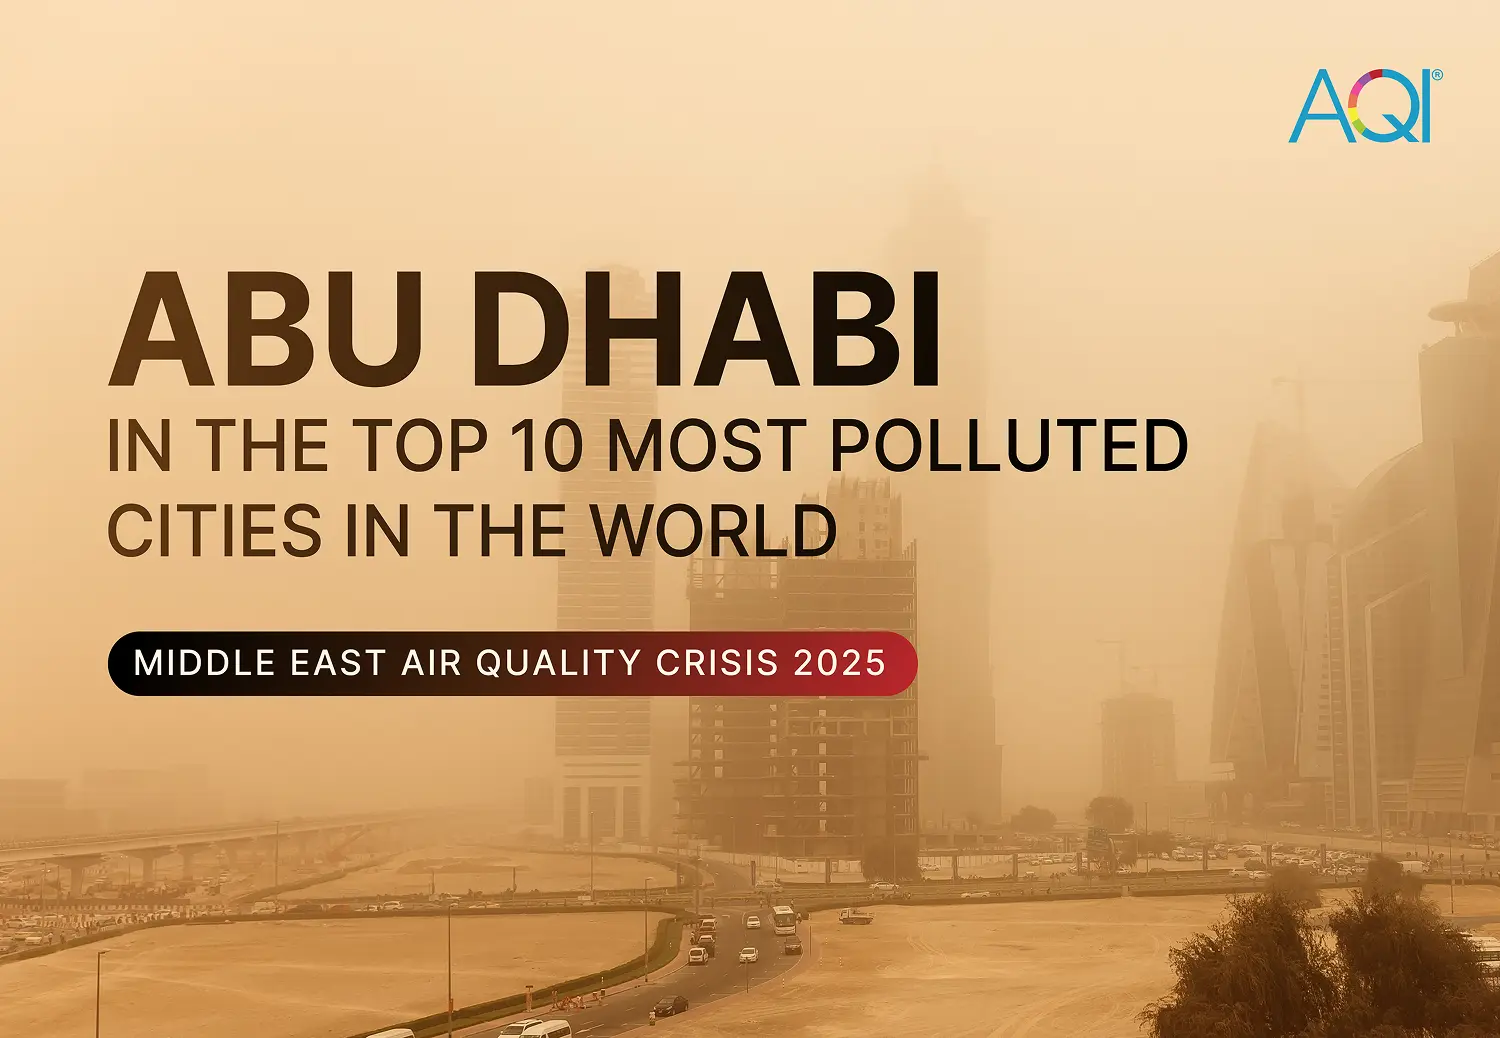
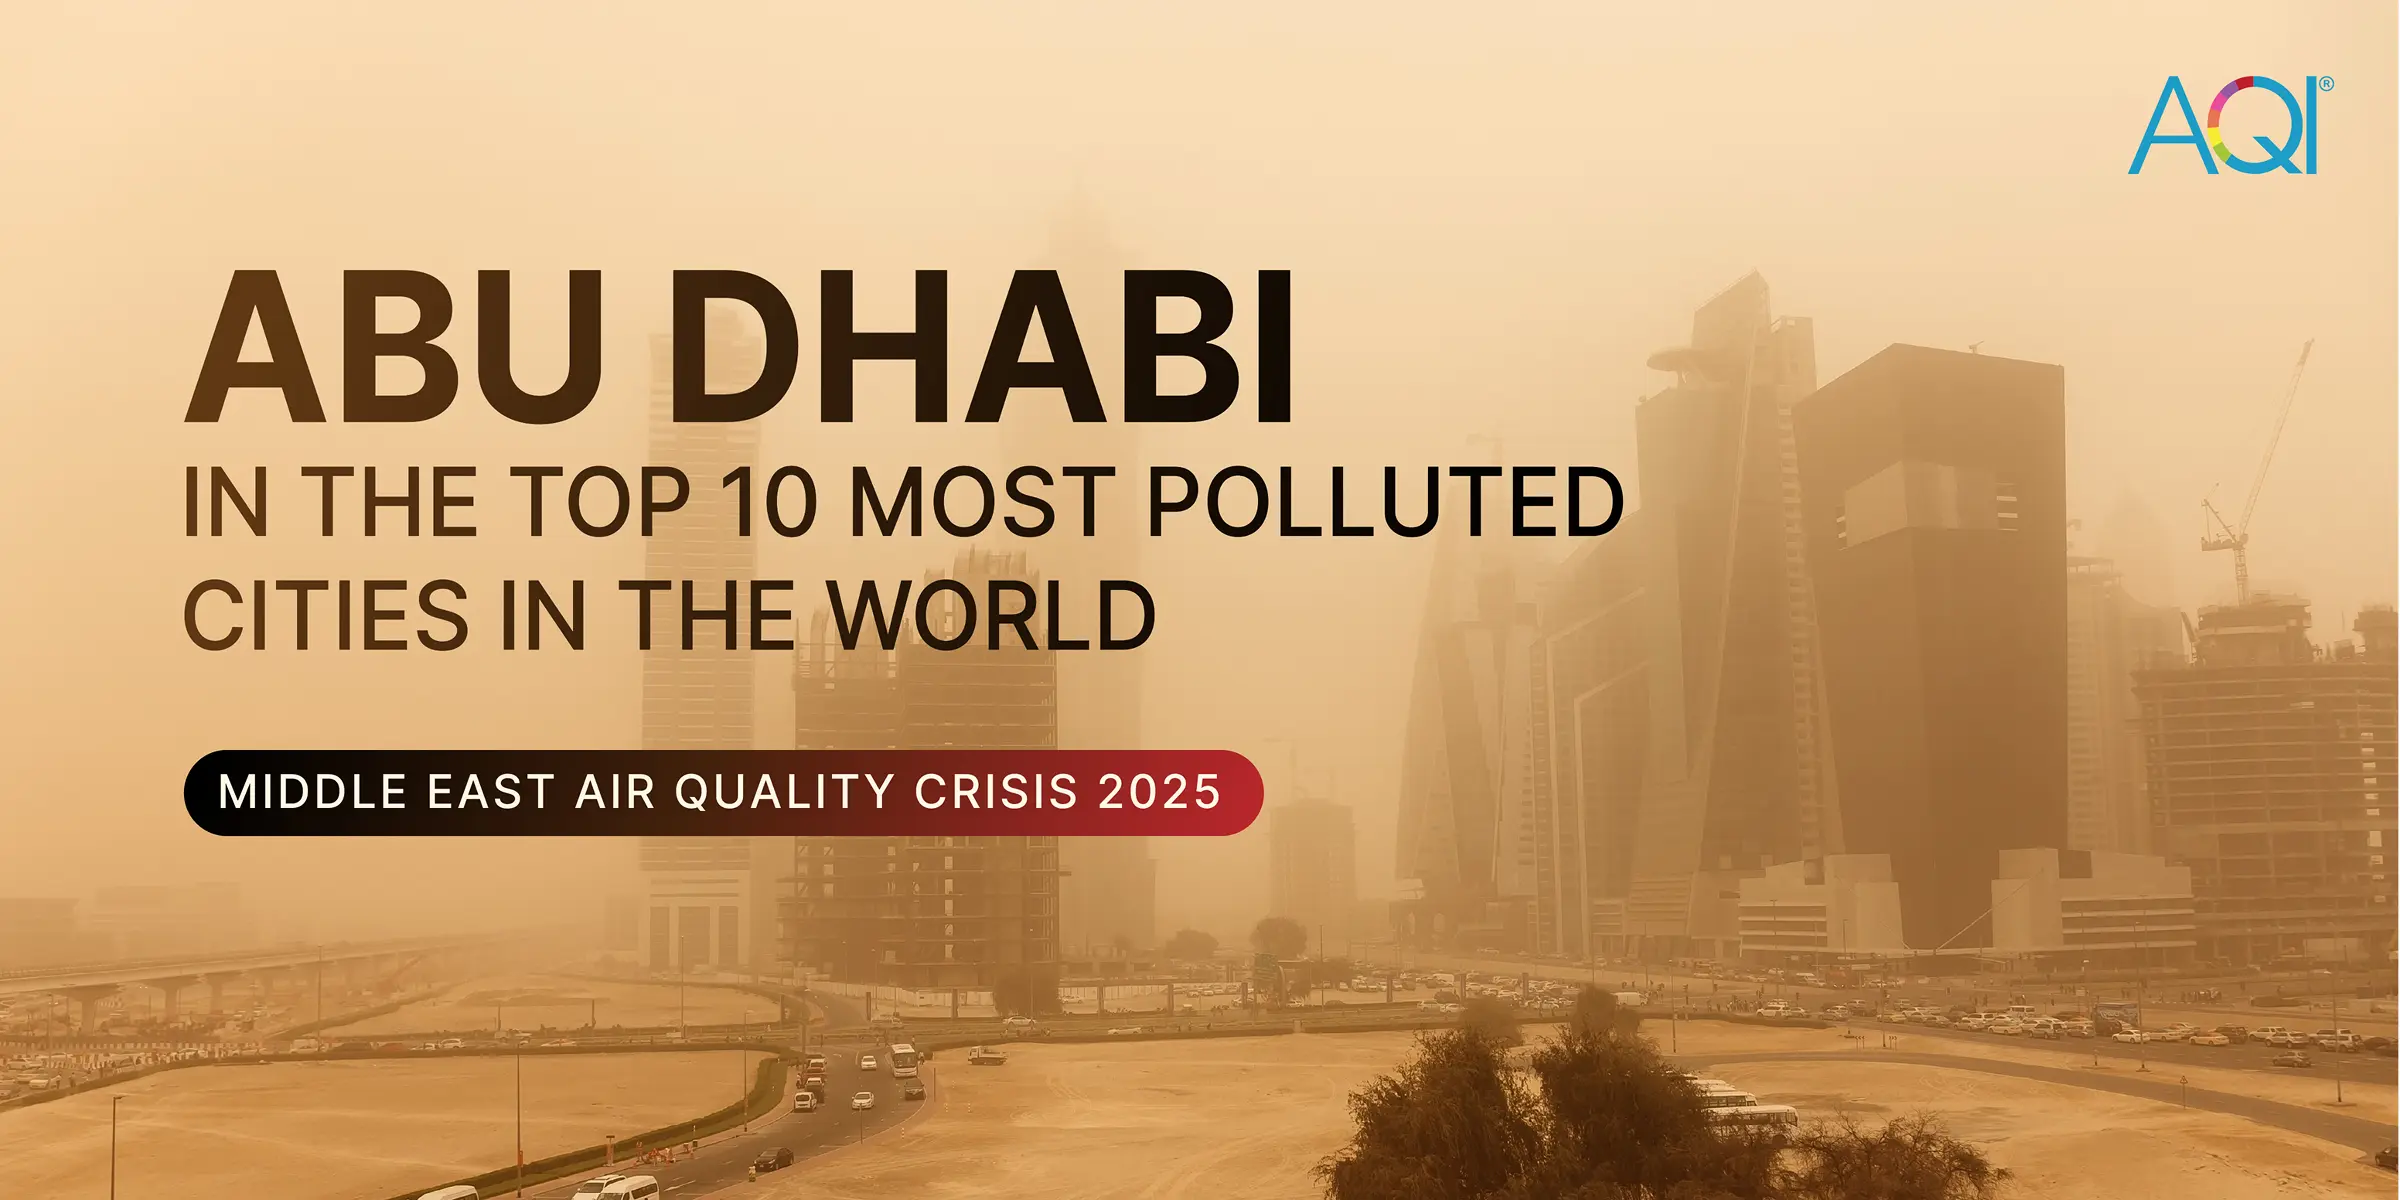
Abu Dhabi in the Top 10 Most Polluted Cities in the World: Middle East Air Quality Crisis 2025
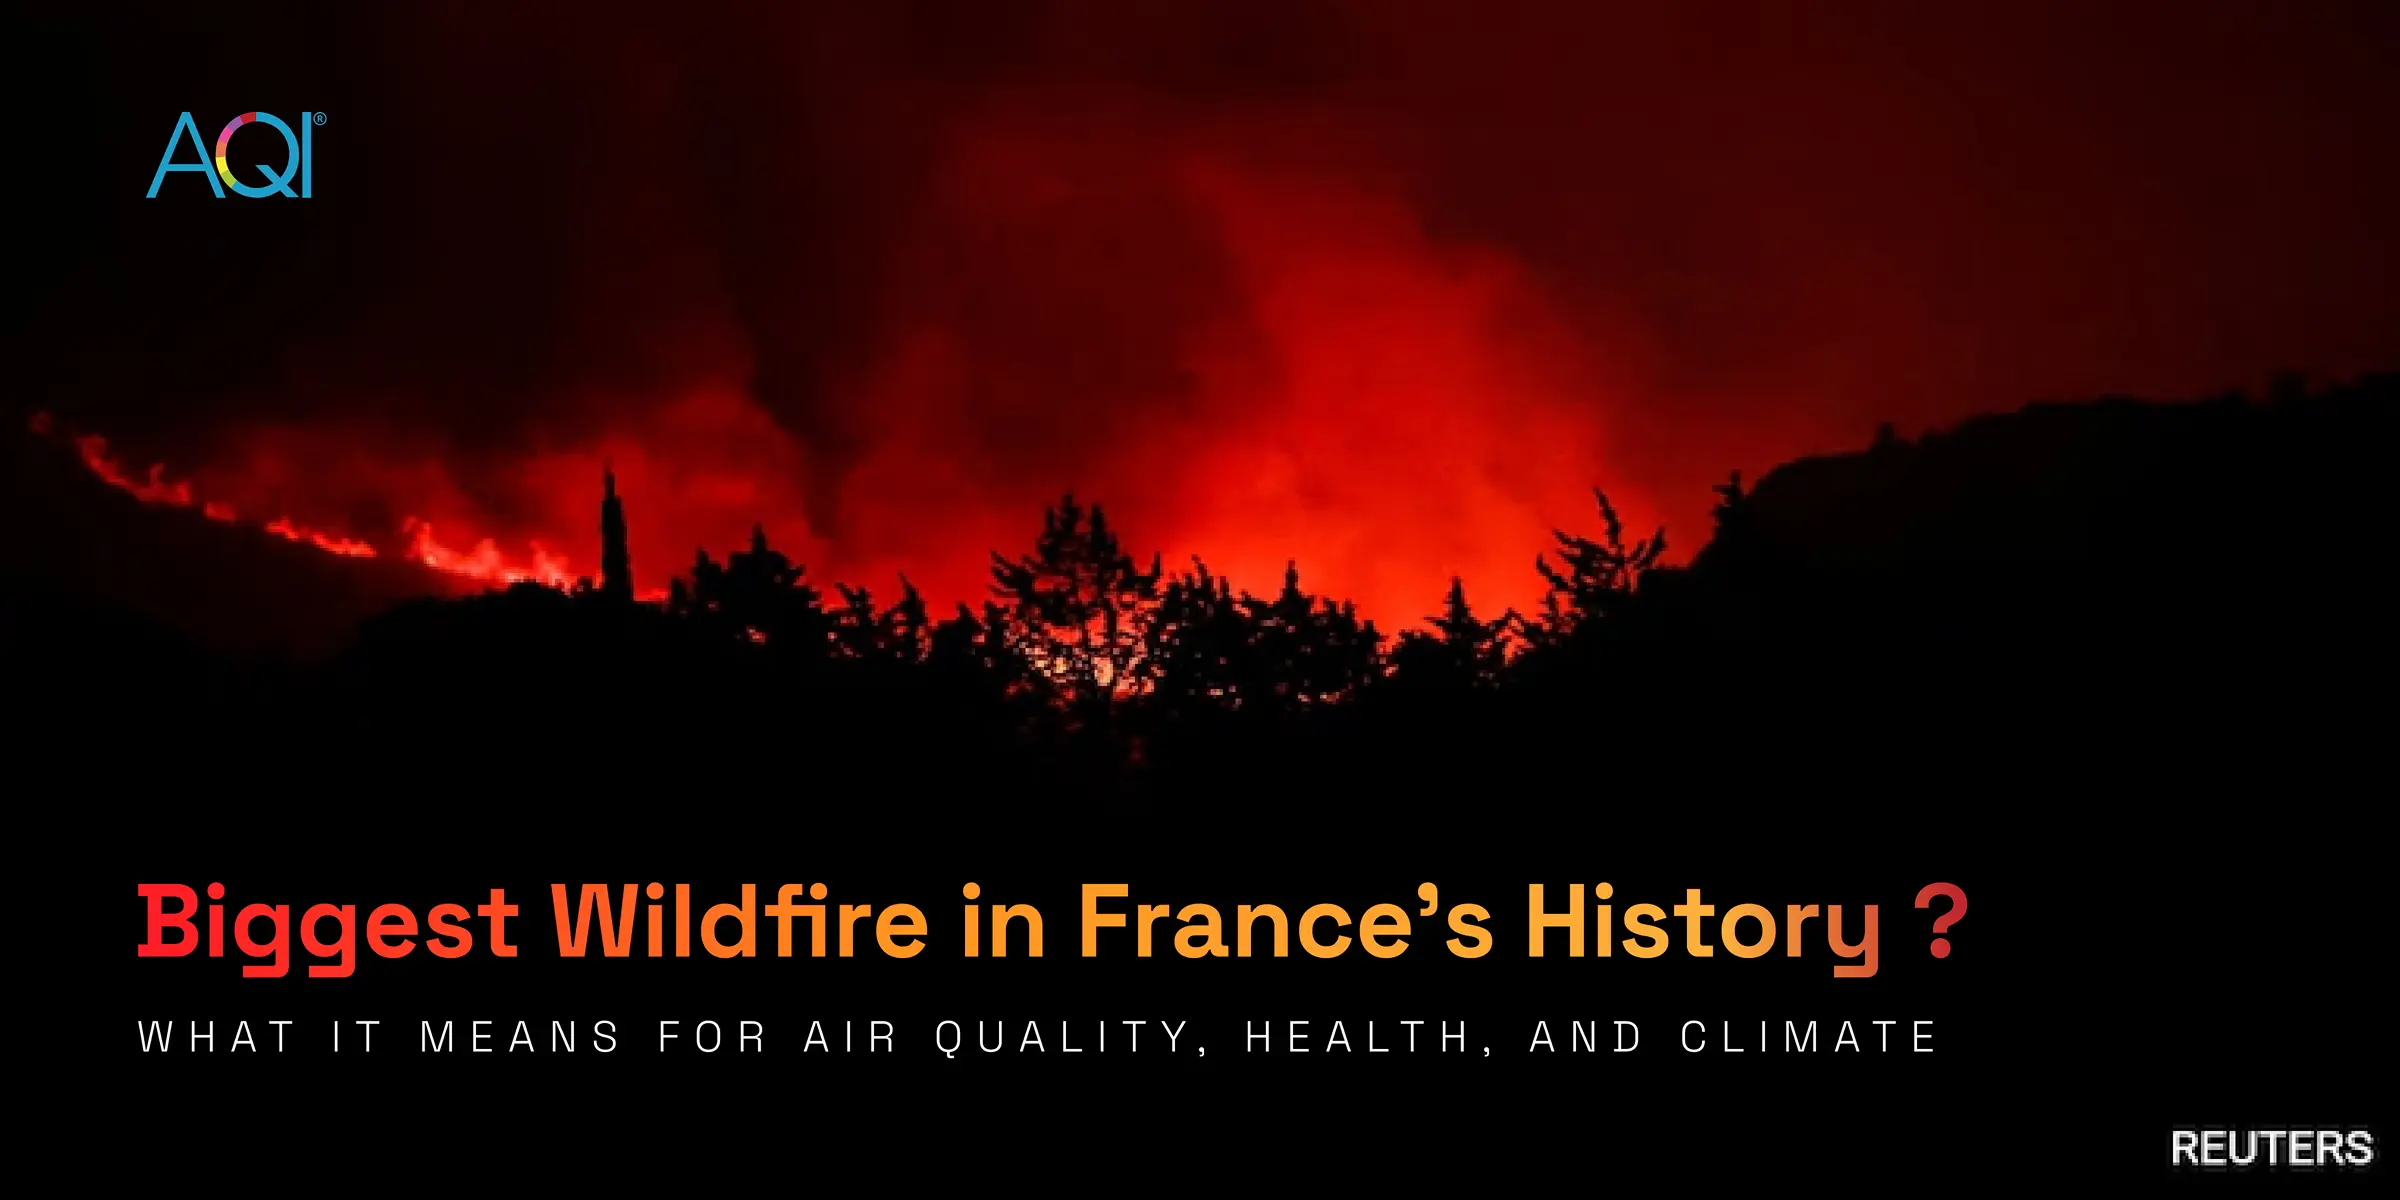
Europe heatwave and wildfires 2025: What is happening across Spain, Portugal and neighbouring countries?
Grafik AQI
Data Kualitas Udara Historis
New Delhi
Unduh Data Tahunan 2024
Laporan Kualitas Udara Dunia

Tren AQI - Perubahan Kualitas Udara Tahunan
New Delhi, Delhi, India
Tren Tahunan AQI
Tahun Paling dan Paling Sedikit Tercemar
* Analisis data ini dari tahun 2020 - 2025
Delhi Air Quality - Video Streaming
Watch the Real time changing of Air Quality in Delhi- PM2.5, PM10, Noise, Temperature and Humidity
Lokasi New Delhi
Tingkat Polusi Udara Waktu Nyata
Kota Metro India
Indeks Kualitas Udara


Kalender Kualitas Udara 2025
New Delhi
Saran Kesehatan Untuk Orang yang Tinggal Di
New Delhi
1.7Cigarettes per day

Menghirup udara di lokasi ini sama berbahayanya dengan merokok 1.7 rokok per hari.
Sumber:
Berkeley Earth
Solusi untuk AQI Saat Ini
 Penyaring UdaraHidupkan
 Filter MobilHarus
 Masker N95Harus
 Tetap di Dalam RuanganHarus
Harus menghidupkan penyaring udara untuk menikmati udara segar.
Dapatkan Penyaring UdaraCegah Masalah Kesehatan: Pahami Risiko Anda
New Delhi
 Asma
Asma Masalah Jantung
 Alergi
 Sinus
Sinus Flu/Demam
 Kronis (COPD)

Sedang. Peluang Asma
Asma
Risiko gejala Asma adalah Sedang. ketika AQI adalah Buruk (50-150)
Gejala sedang termasuk mengi yang sering, sesak napas yang terlihat, rasa sesak di dada, dan batuk yang terus-menerus.
Yang Harus Dilakukan :
Batasi aktivitas luar ruangan saat AQI buruk.
Bersihkan udara dalam ruangan dengan penyaring udara untuk mengurangi paparan.
Tenangkan saluran pernapasan dengan teh herbal atau air hangat untuk membantu meringankan gejala.
Yang Tidak Boleh Dilakukan :
Olahraga di luar ruangan tanpa masker.
Tetap di area berasap dengan asap yang kuat.
Tentang Polusi Udara di New Delhi
Analisis Bulanan AQI di New Delhi
Jelajahi perubahan AQI sebagai perbandingan dari bulan lalu, serta bagaimana perbedaannya dengan bulan yang sama tahun lalu
Agu. 2024 vs Agu. 2025
Dibandingkan dengan Agu. 2024, AQI di Agu. 2025 tetap berada di kategori yang sama.
Jul. 2025 vs Agu. 2025
Tingkat AQI tetap sama dari Jul. 2025 ke Agu. 2025 di kategori 'Sedang'
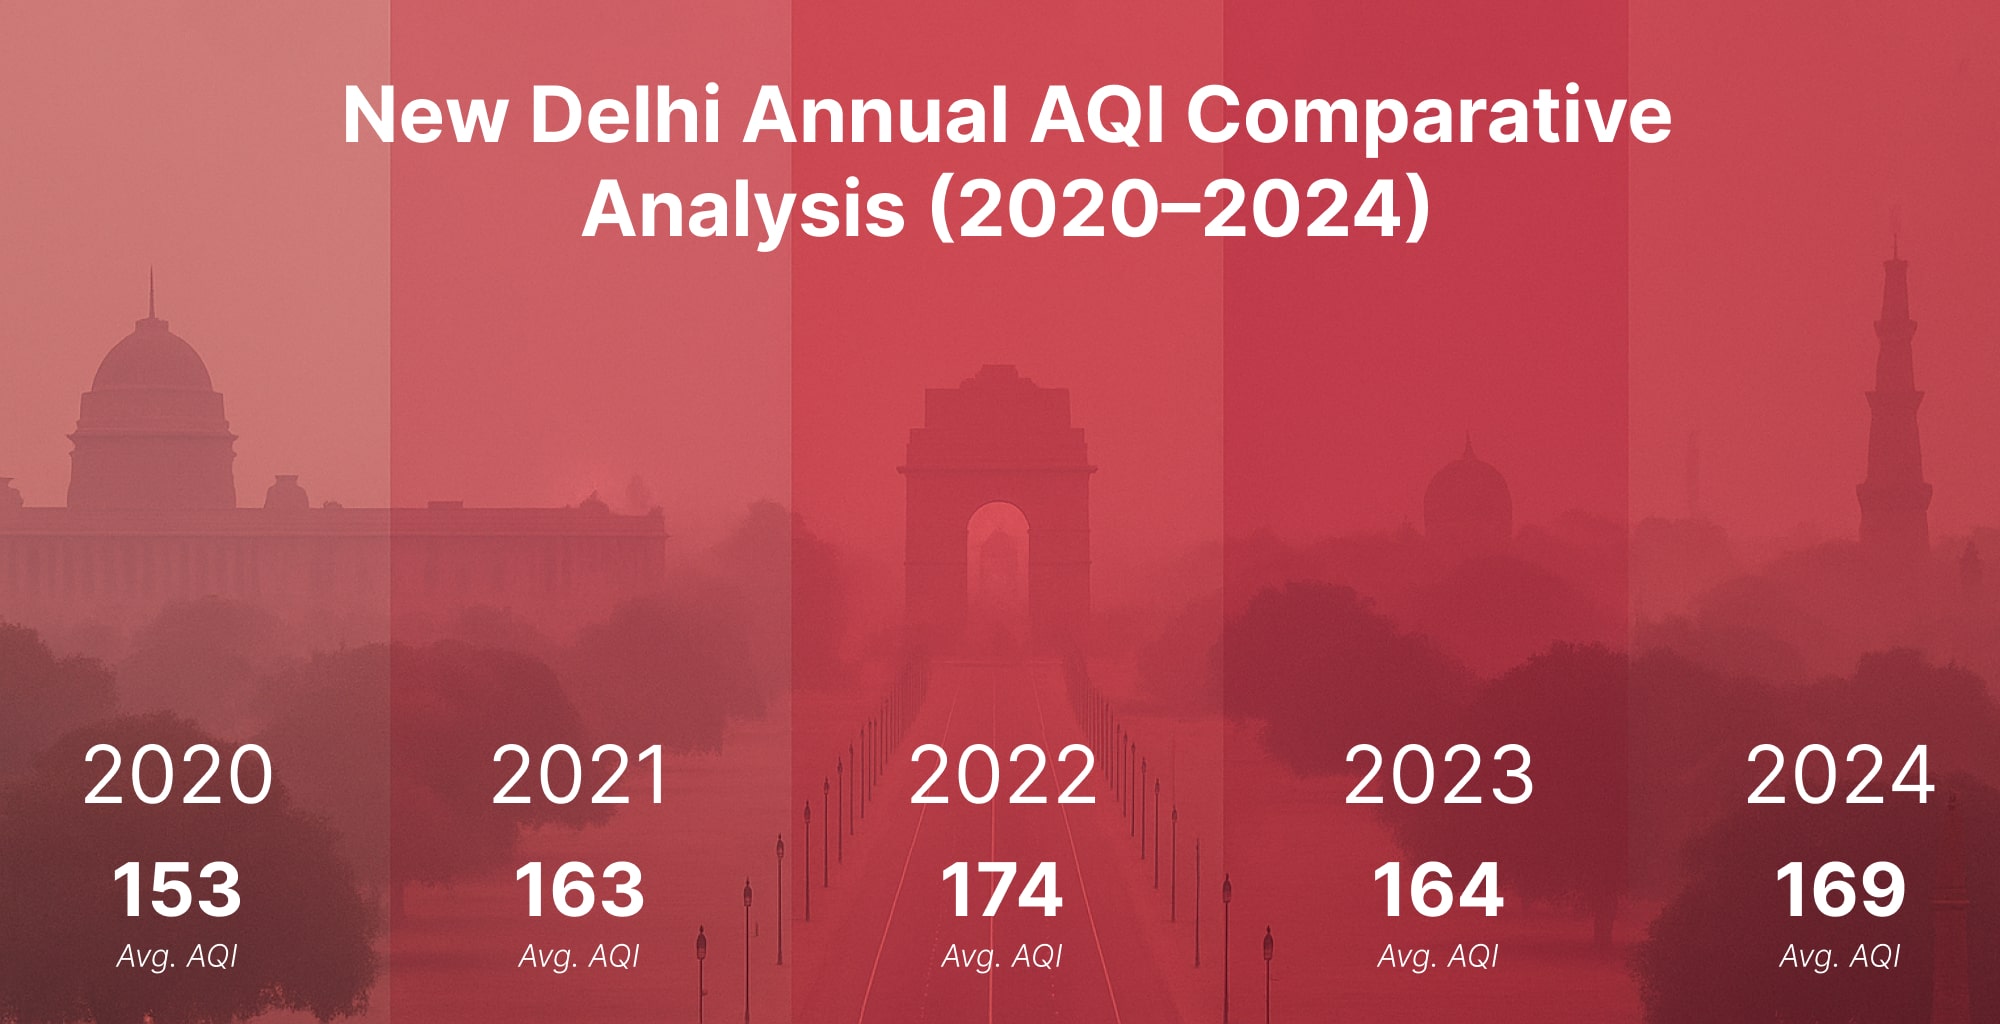
New Delhi's tahunan 2025 AQI (140) menunjukkan perubahan persentase rata-rata sebesar -14.9% (meningkat AQI) dibandingkan dengan tahun-tahun sebelumnya: 2020 (153), 2021 (162), 2022 (174), 2023 (164), 2024 (169).


Air Quality Solutions For New Delhi
Jelajahi solusi pemantauan kualitas udara & udara bersih.
Berikut adalah beberapa aplikasi yang dapat Anda lihat untuk menemukan solusinya.


Solusi Analisis Data AQI untuk New Delhi
Platform Pemantauan Data Kualitas Udara

Memberdayakan Keputusan Anda dengan Data yang Andal
Data waktu nyata untuk area Anda dengan parameter rinci.
Saran kesehatan yang dipersonalisasi sesuai dengan AQI saat ini.
Data analitis untuk mengidentifikasi tren dan kondisi.
Sambungkan dan kendalikan perangkat kualitas udara Anda.
FAQ Kualitas Udara
di New Delhi
Pertanyaan yang Sering Diajukan Tentang Kualitas Udara
Apa tingkat AQI saat ini di New Delhi?
Tingkat AQI waktu nyata saat ini di New Delhi adalah 137 (Poor) akibat hujan baru-baru ini sebesar 0.05mm/hr. Ini terakhir diperbarui 2025-08-28 01:55:49 PM (Waktu Lokal).
Kapan tingkat AQI terbaik di New Delhi dalam 24 jam terakhir?
Tingkat AQI terbaik adalah 55 (Sedang) pada 4:09 PM, Aug 27, 2025 (Waktu Lokal) dalam 24 jam terakhir.
Kapan tingkat AQI terburuk di New Delhi dalam 24 jam terakhir?
Tingkat AQI terburuk adalah 164 (Tidak Sehat) pada 9:09 AM (Waktu Lokal) dalam 24 jam terakhir.
Apa tren tingkat AQI saat ini di New Delhi selama 24 jam terakhir?
Tingkat AQI di New Delhi telah berfluktuasi sepanjang 24 jam terakhir. Tingkatnya meningkat paling tinggi 164 pada 9:09 AM (Waktu Lokal), terendah 55 pada 4:09 PM, Aug 27, 2025 (Waktu Lokal).
Tindakan apa yang direkomendasikan sesuai dengan tingkat AQI saat ini di New Delhi?
Tingkat AQI saat ini tidak sehat bagi individu yang sensitif, mereka harus mengurangi kegiatan luar ruangan yang berkepanjangan atau berat.
Blog AQI Terbaru
Baca berita terbaru
Berikut adalah beberapa blog terbaru yang dapat Anda baca untuk mengetahui lebih lanjut tentang polusi udara.