Índice de Qualidade do Ar (AQI) em City Environmental Monitoring Station | Poluição do Ar
Nível de poluição do ar em tempo real PM2.5, PM10 em Weihai
Última Atualização: 28 Nov 2025, 06:04am (Hora local)


2 °C
ClearCity Environmental Monitoring Station
Tendências em China
.png)
Ethiopia Volcano Eruption: Did the Ash Cloud Affect Delhi’s Air Quality?
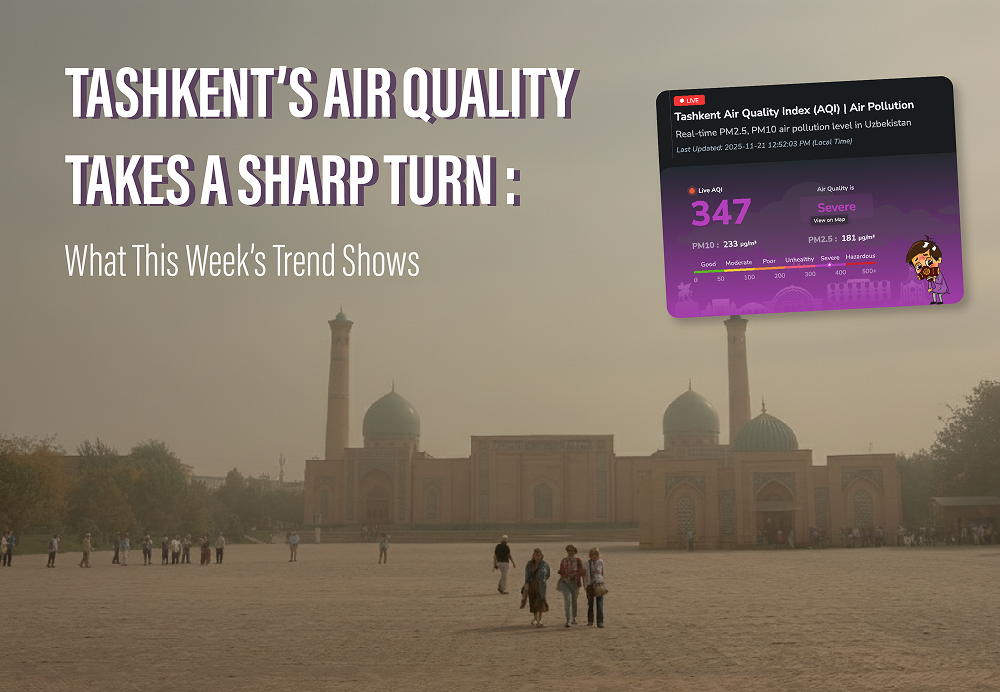
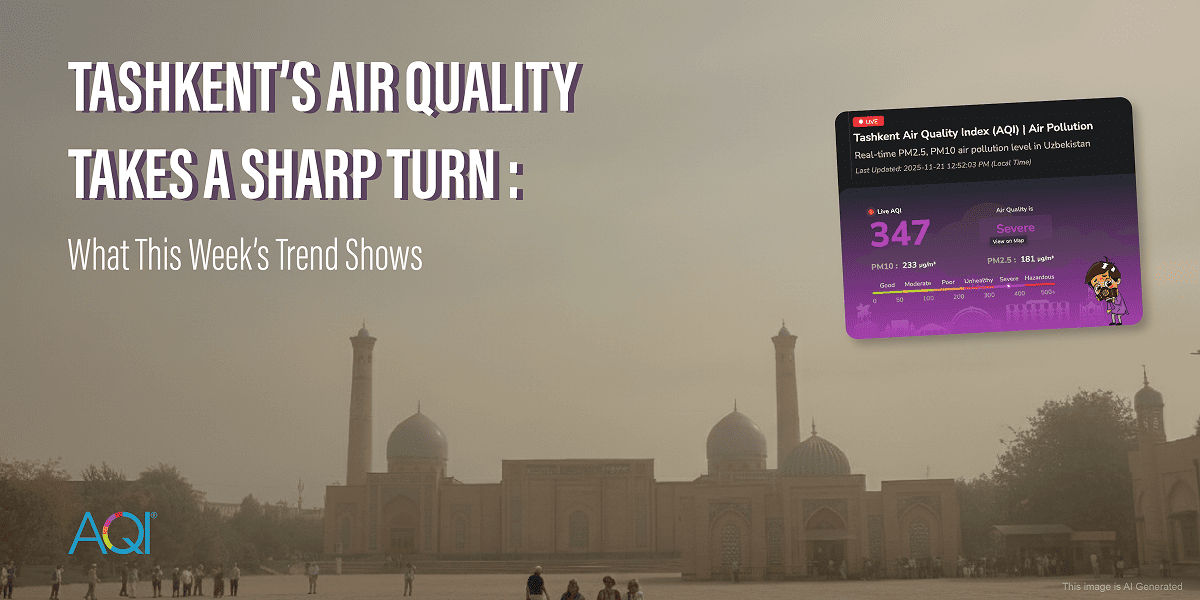
Tashkent’s Air Quality Takes a Sharp Turn: What This Week’s Trend Shows

Invisible dust reality
.png)
Dust vs Smoke: Why Cleaning Your Home Doesn’t Clean Your Air
Gráfico AQI
Dados Históricos de Qualidade do Ar
City Environmental Monitoring Station
Baixe os dados anuais de 2024
Relatório Mundial de Qualidade do Ar

Tendências de AQI - Mudanças Anuais na Qualidade do Ar
City Environmental Monitoring Station, Weihai, Shandong, China
Tendências Anuais de AQI
Anos Mais e Menos Poluídos
* Esta análise de dados é do ano 2020 - 2025
Cidades-Metrô de China
Índice de Qualidade do Ar


Calendário de qualidade do ar 2025
City Environmental Monitoring Station
Conselhos de Saúde Para Pessoas que Vivem em
City Environmental Monitoring Station
0Cigarettes per day
Respire tranquilo e fique ativo! A qualidade do ar é perfeita para desfrutar de atividades ao ar livre.
Fonte:
Berkeley Earth
Soluções para o Atual AQI
 Purificador de ArDesligar
 Filtro de CarroRecomendado
 Máscara N95Recomendado
 Fique em CasaRecomendado
De acordo com o atual AQI, desligue o purificador de ar.
Adquira um Purificador de ArPrevina Problemas de Saúde: Entenda Seus Riscos
City Environmental Monitoring Station
 Asma
Asma Problemas Cardíacos
 Alergias
 Sinusite
 Resfriado/Gripe
 Doença Pulmonar Obstrutiva Crônica (DPOC)

Baixo Chances de Asma
Asma
O risco de sintomas de Asma é Baixo quando o AQI está em Bom (0-50)
Sintomas leves, como leve chiado, tosse ocasional e leve falta de ar.
Deve fazer :
Acompanhe a qualidade do ar para planejar atividades ao ar livre com segurança.
Beba água para manter as vias aéreas úmidas e reduzir a irritação.
Inclua frutas e vegetais não alérgicos que apoiem a saúde geral dos pulmões, como maçãs, peras e espinafre.
Não deve fazer :
Não pule os medicamentos prescritos pelo seu médico.
Evite atividades ao ar livre nas primeiras horas da manhã, durante os períodos de alta polinização.
Cidades Mais Poluídas 2025
China
Analise as cidades mais poluídas em tempo real no país.
Valor Padrão
1.
Luzhou, China
2.
Deyang, China
3.
Zhenjiang, China
4.
Xianyang, China
5.
Luocheng, China
6.
Tongshan, China
7.
Kaifeng, China
8.
Handan, China
9.
Huaibei, China
10.
Weinan, China
Última Atualização: 27 Nov 2025, 10:05 PM
Ranking de Cidades por AQISoluções de Qualidade do Ar Para City Environmental Monitoring Station
Explore as soluções de monitoramento da qualidade do ar e ar limpo.
Aqui estão algumas aplicações que você pode consultar para descobrir as soluções.


Soluções de Análise de Dados AQI de City Environmental Monitoring Station
Plataformas de monitoramento de dados da qualidade do ar

Dados em tempo real da sua área com parâmetros detalhados.
Conselhos personalizados de saúde de acordo com o AQI atual.
Dados analíticos para identificar tendências e condições.
Conecte e controle seus dispositivos de qualidade do ar.
Perguntas frequentes sobre a qualidade do ar
em City Environmental Monitoring Station
Perguntas Frequentes Sobre Qualidade do Ar
Qual é o nível atual de AQI em City Environmental Monitoring Station?
O nível atual de AQI em tempo real em City Environmental Monitoring Station é 17 (Good). Isso foi atualizado pela última vez em 28 Nov 2025, 06:04am (Hora local).
Quando foi o melhor nível de AQI em City Environmental Monitoring Station nas últimas 24 horas?
O melhor nível de AQI foi 11 (Bom) às 9:04 PM (Hora local) nas últimas 24 horas.
Quando foi o pior nível de AQI em City Environmental Monitoring Station nas últimas 24 horas?
O pior nível de AQI foi 139 (Ruim) às 7:04 AM (Hora local) nas últimas 24 horas.
Qual é a tendência atual dos níveis de AQI em City Environmental Monitoring Station nas últimas 24 horas?
Os níveis de AQI em City Environmental Monitoring Station têm flutuado nas últimas 24 horas. Os níveis aumentaram para o máximo de 139 às 7:04 AM (Hora local) e diminuíram para o mínimo de 11 às 9:04 PM (Hora local).
Quais ações são recomendadas de acordo com o nível atual de AQI em City Environmental Monitoring Station?
A qualidade do ar é satisfatória, e a poluição do ar apresenta pouco ou nenhum risco. Nenhuma precaução especial é necessária; aproveite as atividades ao ar livre livremente.
Blogs Recentes do AQI
Leia as últimas notícias
Aqui estão alguns blogs recentes que você pode consultar para descobrir mais sobre a poluição do ar.