 Navya
NavyaEvery year, as October arrives in New Delhi, the air begins to thicken and not with mist, but with pollution.
To better understand this trend, the daily AQI data for October 2023, October 2024, and October 2025 was thus analyzed.
Trend Analysis: Why October 2025 Was the Worst for Delhi AQI
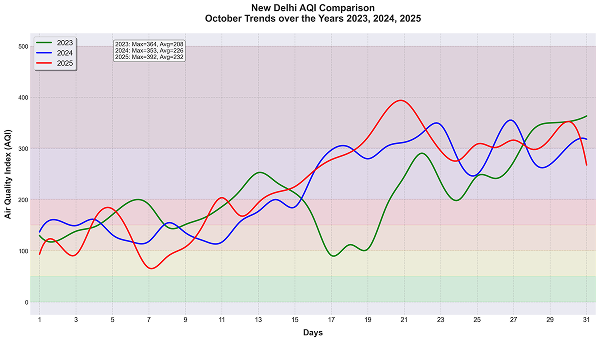
The graph clearly shows a troubling pattern where October 2025 recorded the highest pollution levels of the past three years, with AQI levels frequently crossing the “Very Unhealthy” zone.
As the data indicates, the red line (2025) in the graph rises steadily after mid-October, showing a sharp jump around October 18 to 25, a period coinciding with harvest stubble burning in Punjab and Haryana as well as firecracker emissions.
1. Highest Average AQI
- 2023 → Avg = 208
- 2024 → Avg = 226
- 2025 → Avg = 232
Clearly, the average AQI in October 2025 was the highest, meaning that poor-air conditions persisted throughout the month, not just short spikes.
2. Highest Peak (Max) AQI
- 2023 → Max 364
- 2024 → Max 353
- 2025 → Max 392
Consequently, October 2025 recorded the worst single-day AQI level among all three years.
The red line in your chart peaks sharply around the 20-25 October range, entering the “Hazardous” (> 300) zone.
This indicates that 2025 not only had persistently high background pollution but also more extreme spikes.
3. Sustained “Very Unhealthy” Periods
Looking at the red line (2025) against the shaded AQI zones:
- It remains above 200 (purple zone) for most days after October 15,
- Whereas the blue (2024) and green (2023) lines drop below that threshold several times.
In other words, for most of October 2025, the AQI hovered between 200–400, consistently placing Delhi in the “Very Unhealthy” to “Hazardous” category.
4. Sharper Upward Trend Toward Month-End
Unlike previous years, 2025’s curve rises steadily toward the end of October. This steady climb suggests that pollution accumulation intensified through the month rather than easing.
As a result, even healthy individuals faced breathing discomfort, while children, the elderly, and people with asthma or heart disease were at high risk.
Key Observations from the Data
Therefore, to summarize the data :
|
Year |
Max AQI |
Avg AQI |
Possible Takeaways |
|
2023 |
364 |
208 |
Moderate spikes mid-month |
|
2024 |
353 |
226 |
Slight improvement but still poor |
|
2025 |
392 |
232 |
Worst overall air quality |
Overall, the comparison shows that despite minor fluctuations, Delhi’s air quality has been deteriorating steadily.
What this means for Delhi
Despite multiple contributing factors such as stubble burning, vehicular and industrial emissions, and road dust, Delhi’s geography and meteorology, particularly in October, play a major role in trapping pollutants.
Undeniably, the rising AQI shows Delhi needs urgent, region-wide action and not just within Delhi, but across northern India.
Key interventions could include:

- Accelerating crop residue management technologies to reduce stubble burning.
- Expanding electric vehicle adoption and tightening emissions standards.
- Implementing seasonal construction bans and stricter dust control.
- Enhancing public air quality monitoring and real-time advisories.
Additionally, stay updated about the real-time AQI levels and various pollutants by regularly visiting AQI.in .
Conclusion
Thus, October 2025 marked a turning point in Delhi’s air pollution crisis. The trend analysis clearly indicates a sustained period of unhealthy air throughout the month proving to be the worst in the past three years. Consequently, with persistent emissions from stubble burning, firecrackers, and local sources compounded by stagnant weather, Delhi’s air became increasingly toxic.
In conclusion, unless aggressive regional measures are implemented, addressing both emission sources and meteorological challenges, the city risks setting new pollution records every winter.
 Poorna Khanna
 Gyane Haobijam
 Shakshi
 Livia Machado
 Divya Singh
 Nandini
 Deepshikha Deb
 Rahul
Rahul