Velachery Res. Area Air Quality Index (AQI) | Air Pollution
Real-time PM2.5, PM10 air pollution level in Chennai
Last Updated: 21 Aug 2025, 12:09pm (Local Time)


34 °C
CloudyVelachery Res. Area
Trending in India
Why Air Quality Monitoring and Clean Air is Necessary for Schools?
Abu Dhabi in the Top 10 Most Polluted Cities in the World: Middle East Air Quality Crisis 2025
How Air Pollution Damages Your Long-Term Financial Health?

Europe heatwave and wildfires 2025: What is happening across Spain, Portugal and neighbouring countries?
Case Study: Prana Air’s Air Quality Monitoring Solution for Coal Mining-Trusted by ISM Dhanbad

How Does the Best Air Quality Solution for Airport Improve Operations and Passenger Safety?
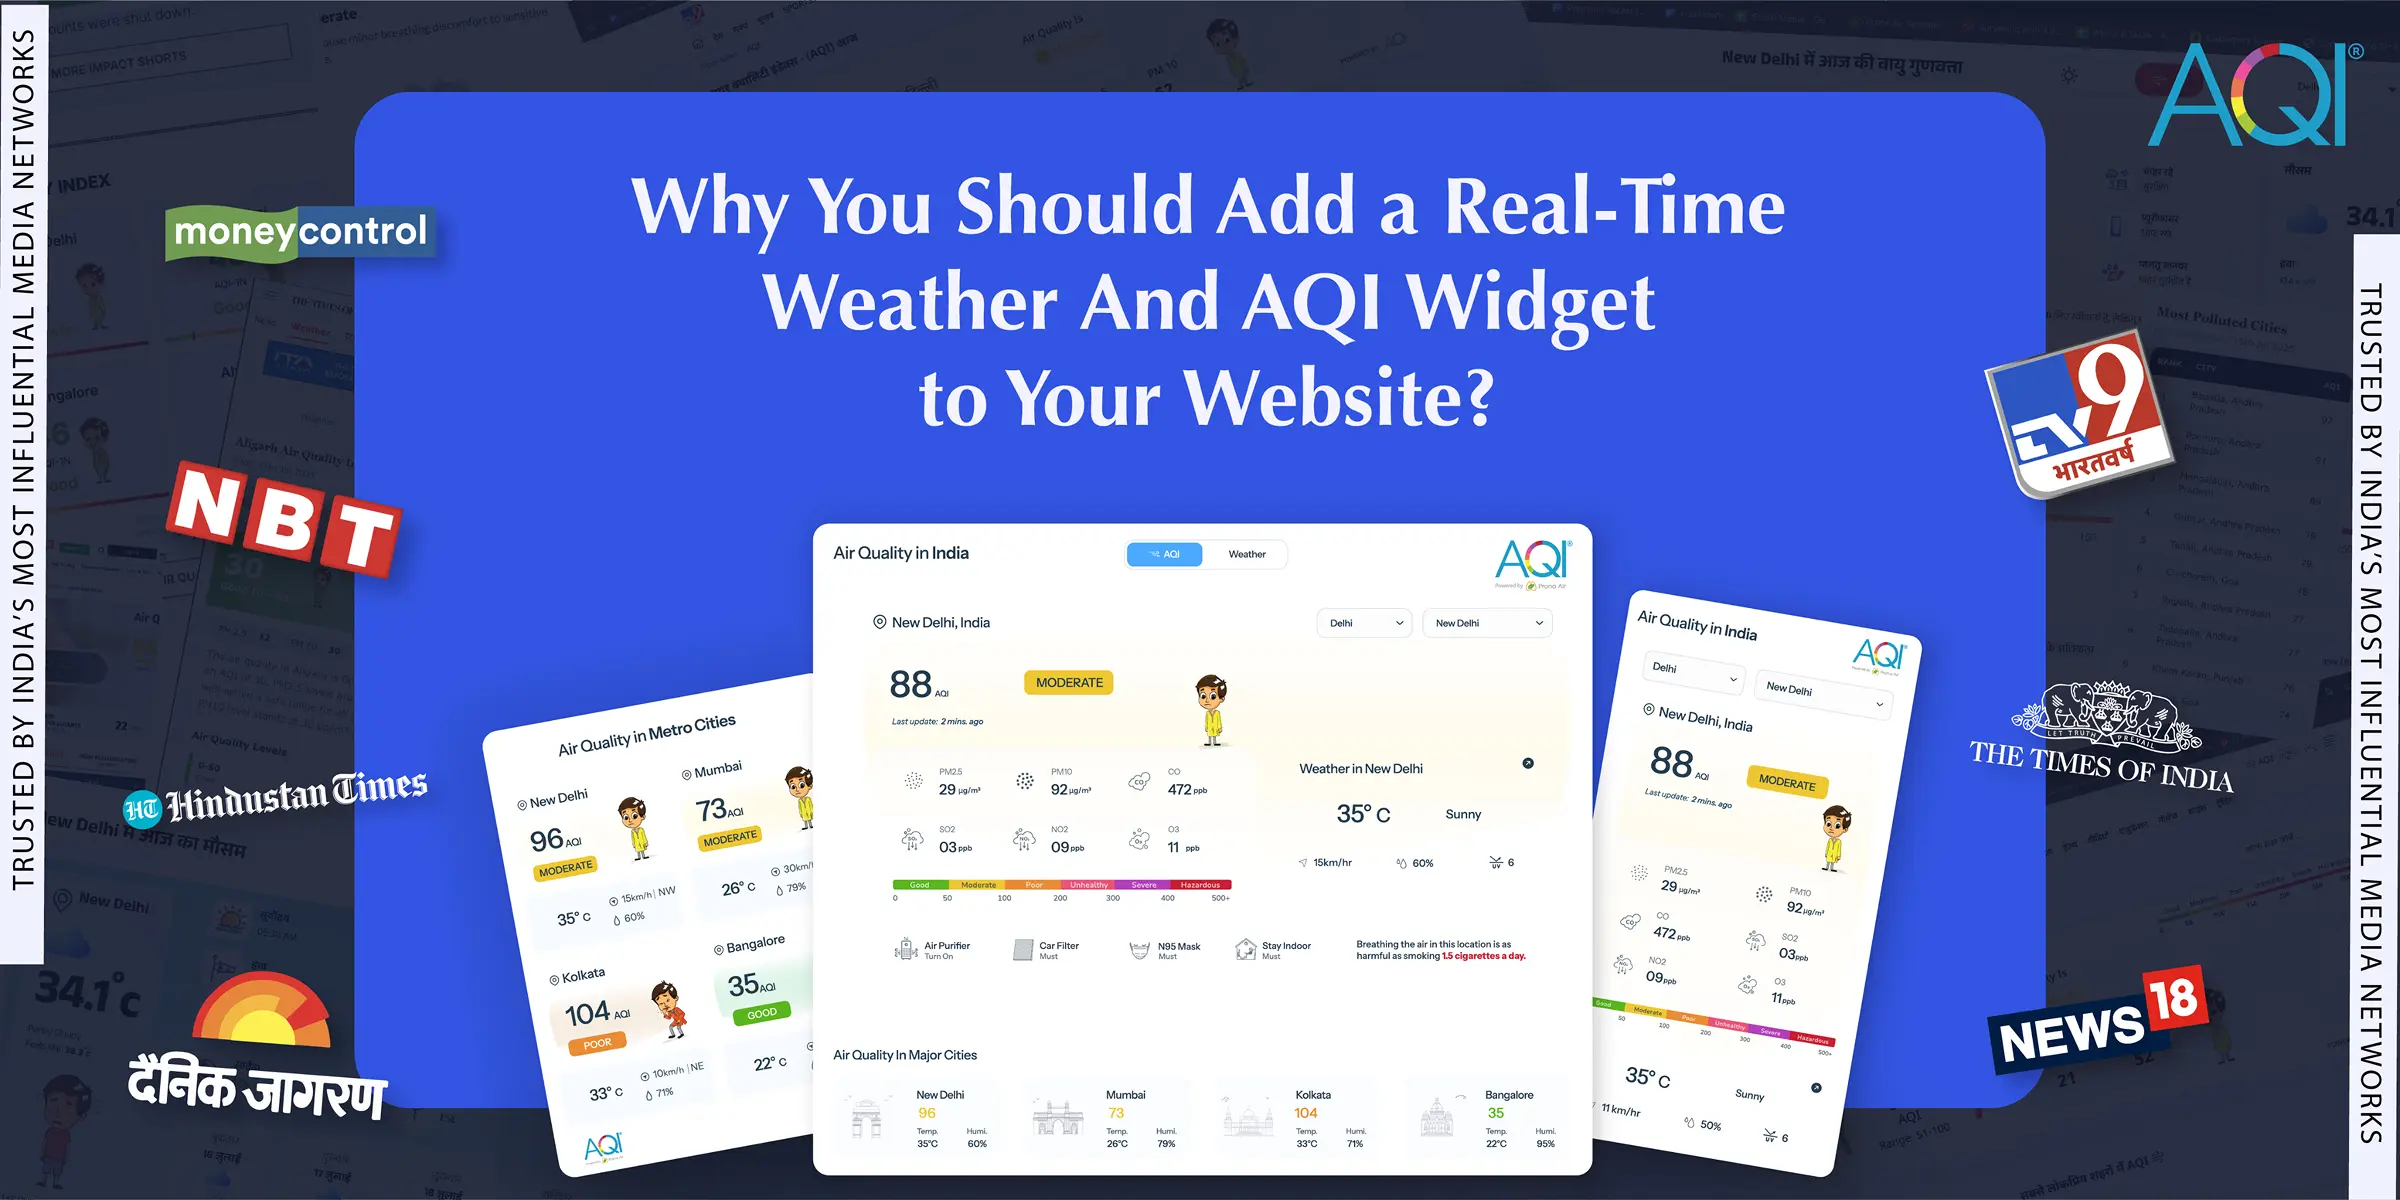
Why You Should Add a Real-Time Weather and AQI Widget to Your Website?
AQI Graph
Historical Air Quality Data
Velachery Res. Area
Download 2024 Annual Data
World Air Quality Report

AQI Trends - Annual Air Quality Changes
Velachery Res. Area, Chennai, Tamil Nadu, India
Annual AQI Trends
Most & Least Polluted Months
* This data analysis is from year 2020 - 2025
India's Metro Cities
Air Quality Index


Air Quality Calendar 2025
Velachery Res. Area
Health Advice For People Living In
Velachery Res. Area
0Cigarettes per day
Breathe easy and get active! The air quality is perfect for enjoying outdoor activities.
Source:
Berkeley Earth
Solutions for Current AQI
 Air PurifierTurn On
 Car FilterMust
 N95 MaskMust
 Stay IndoorMust
Must turn on the air purifier to enjoy fresh air.
Get an Air PurifierPrevent Health Problems: Understand Your Risks
Velachery Res. Area
 Asthma
 Heart Issues
 Allergies
 Sinus
Sinus Cold/Flu
 Chronic (COPD)

Mild Chances of Asthma
Asthma
Risk of Asthma symptoms is Mild when AQI is Moderate (50-150)
Moderate symptoms including frequent wheezing, noticeable shortness of breath, chest tightness, and persistent cough.
Do's :
Limit outdoor activities when AQI is poor.
Clean indoor air with an air purifier to reduce exposure.
Soothe the respiratory tract with herbal teas or warm water to help alleviate symptoms.
Don'ts :
Exercise outdoors without a mask.
Stay in smoky areas with strong fumes.
Most Polluted Cities 2025
India
Analyze the real-time most air polluted cities in the country.
Standard Value
1.
Kakinada, India
2.
Cuddalore, India
3.
Pali, India
4.
Nidadavole, India
5.
Banda, India
6.
Mahesana, India
7.
Diu, India
8.
Vemuluru, India
9.
Jatani, India
10.
Tanuku, India
Last Updated: 21 Aug 2025, 06:46 AM
AQI City RankingsAir Quality Solutions For Velachery Res. Area
Explore the solutions of air quality monitoring & clean air.
Here are some applications that you can go through to find out the solutions.


Velachery Res. Area's AQI Data Analytics Solutions
Air quality data monitoring platforms

Your area’s real-time data with detailed parameters.
Personalized health advice as per current AQI.
Analytical data to identify trends and conditions.
Connect and control your air quality devices.
Air Quality FAQs
at Velachery Res. Area
Frequently Asked Questions About Air Quality
What is the current AQI level in Velachery Res. Area?
The current real-time AQI level in Velachery Res. Area is 66 (Moderate). This was last updated 21 Aug 2025, 12:09pm (Local Time).
When was the best AQI level in Velachery Res. Area in the last 24 hours?
The best AQI level was 59 (Moderate) at 1:09 AM (Local Time) during the last 24 hours.
When was the worst AQI level in Velachery Res. Area in the last 24 hours?
The worst AQI level was 80 (Moderate) at 8:09 AM (Local Time) during the last 24 hours.
What is the current trend of AQI levels in Velachery Res. Area during last 24 hours?
The AQI levels in Velachery Res. Area have been fluctuating throughout the last 24 hours. The levels have increased by highest 80 at 8:09 AM (Local Time), lowest 59 at 1:09 AM (Local Time).
What actions are recommended as per the current AQI level in Velachery Res. Area?
Current AQI levels are acceptable; however, some pollutants may be a concern for a small number of sensitive individuals.
Recent AQI Blogs
Read the latest news
Here are some latest blogs that you can go through to find out more air pollution.