Banhore Ozone (O3) Level
Jammu And Kashmir, India

0ppb
Last Updated: 2025-11-27 07:37:04 PM (Local Time)

Banhore
What is the Current O3 Level?
Banhore
The current O3 level in Banhore based on the average air quality level across the city is 0 ppb, making it healthy and safe for everyone.
The current O3 level in Banhore is 50.9x Below the recommended WHO guideline of 50.96 ppb.
Trending in India
.png)
Ethiopia Volcano Eruption: Did the Ash Cloud Affect Delhi’s Air Quality?
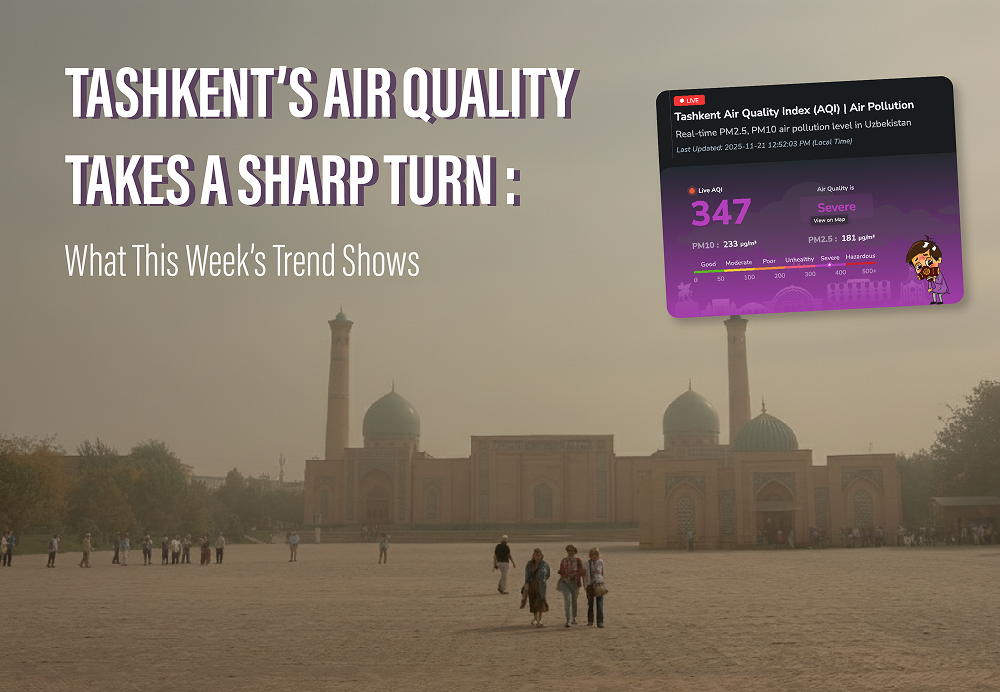
Tashkent’s Air Quality Takes a Sharp Turn: What This Week’s Trend Shows

Invisible dust reality
.png)
Dust vs Smoke: Why Cleaning Your Home Doesn’t Clean Your Air
AQI Graph
Historical Air Quality Data
Banhore
Download 2024 Annual Data
World Air Quality Report

Do you know that Ozone's total mass is 3 billion metric tons in the atmosphere? It looks like a lot but has only 0.00006% of the atmosphere. Besides, Ozone's peak concentration is 32 kilometres above the Earth's surface.

Uncovering the Sources of Ozone (O3): Where Does It Come From?

Refineries
Industrial processes emit substances.
Power plants
Emissions from burning fossil fuels.
Paints evaporations
Vocs from paints react with sunlight.
Transportation
Diesel operated vehicles reacts and form ozone.Short-Term O3 Exposure Impacts

Chest pain
Discomfort or pain in the chest due to respiratory stress.
Breathing shortness
Difficulty in breathing or feeling of breathlessness.
Respiratory irritation
Inflammation and irritation of the respiratory tract.
Wheezing and coughing
Whistling sound and persistent cough.
Trigger asthma attacks
Aggravation of asthma symptoms.Why you should care about Ozone (O3)?
Know More About O3 Sensor
