Indeks Kualitas Udara (AQI) Noida | Polusi Udara
Tingkat polusi udara PM2.5, PM10 real-time di Uttar Pradesh
Terakhir Diperbarui: 2025-10-18 10:58:54 PM (Waktu Lokal)

24 °C
MistNoida
Sedang Tren di India
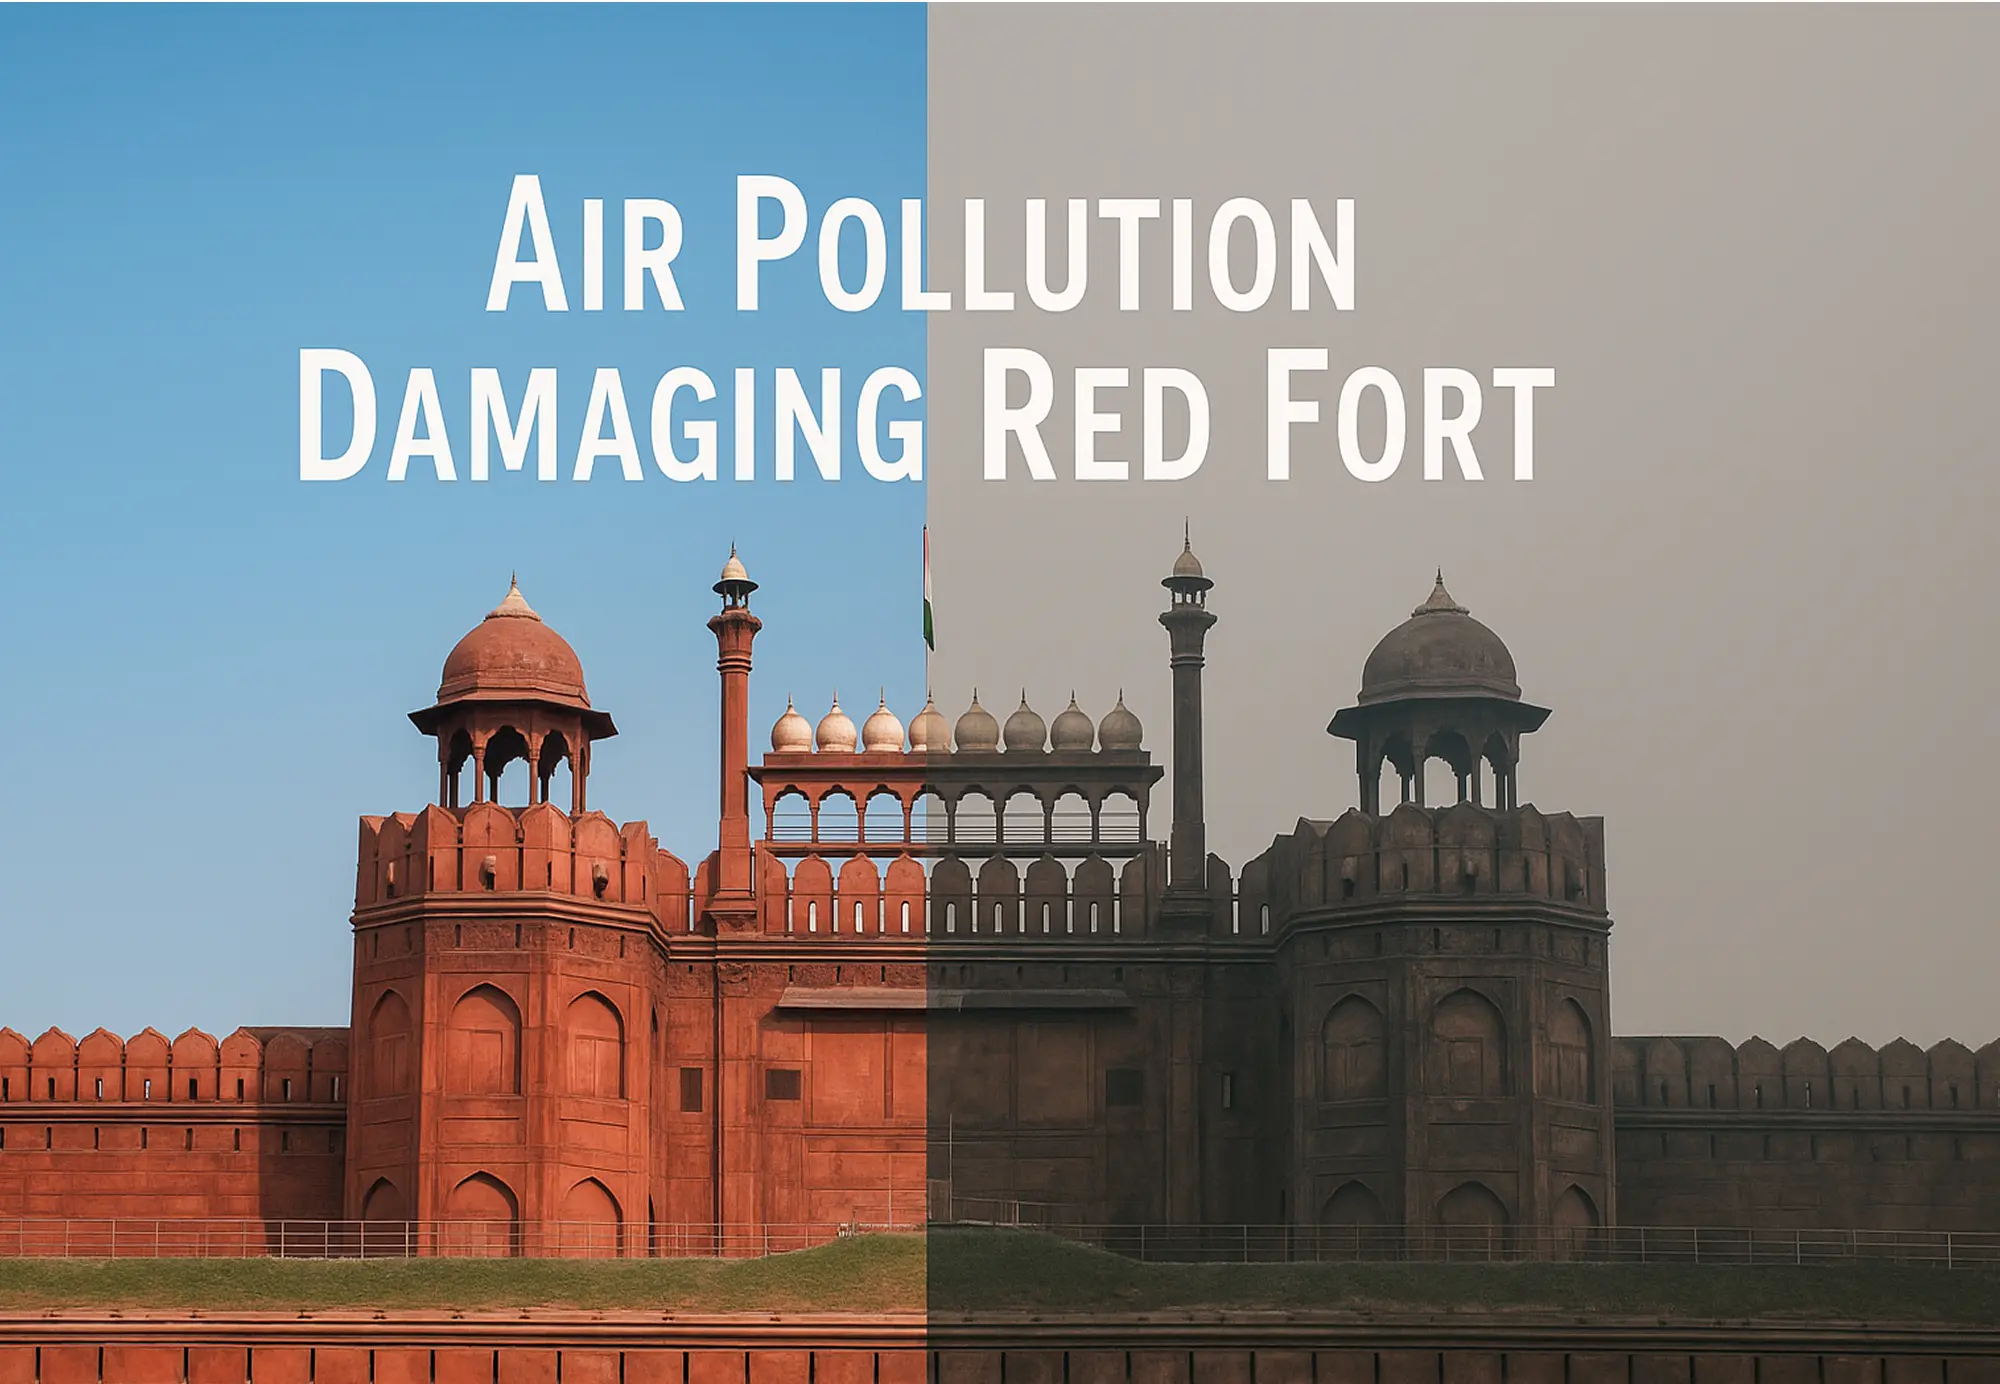
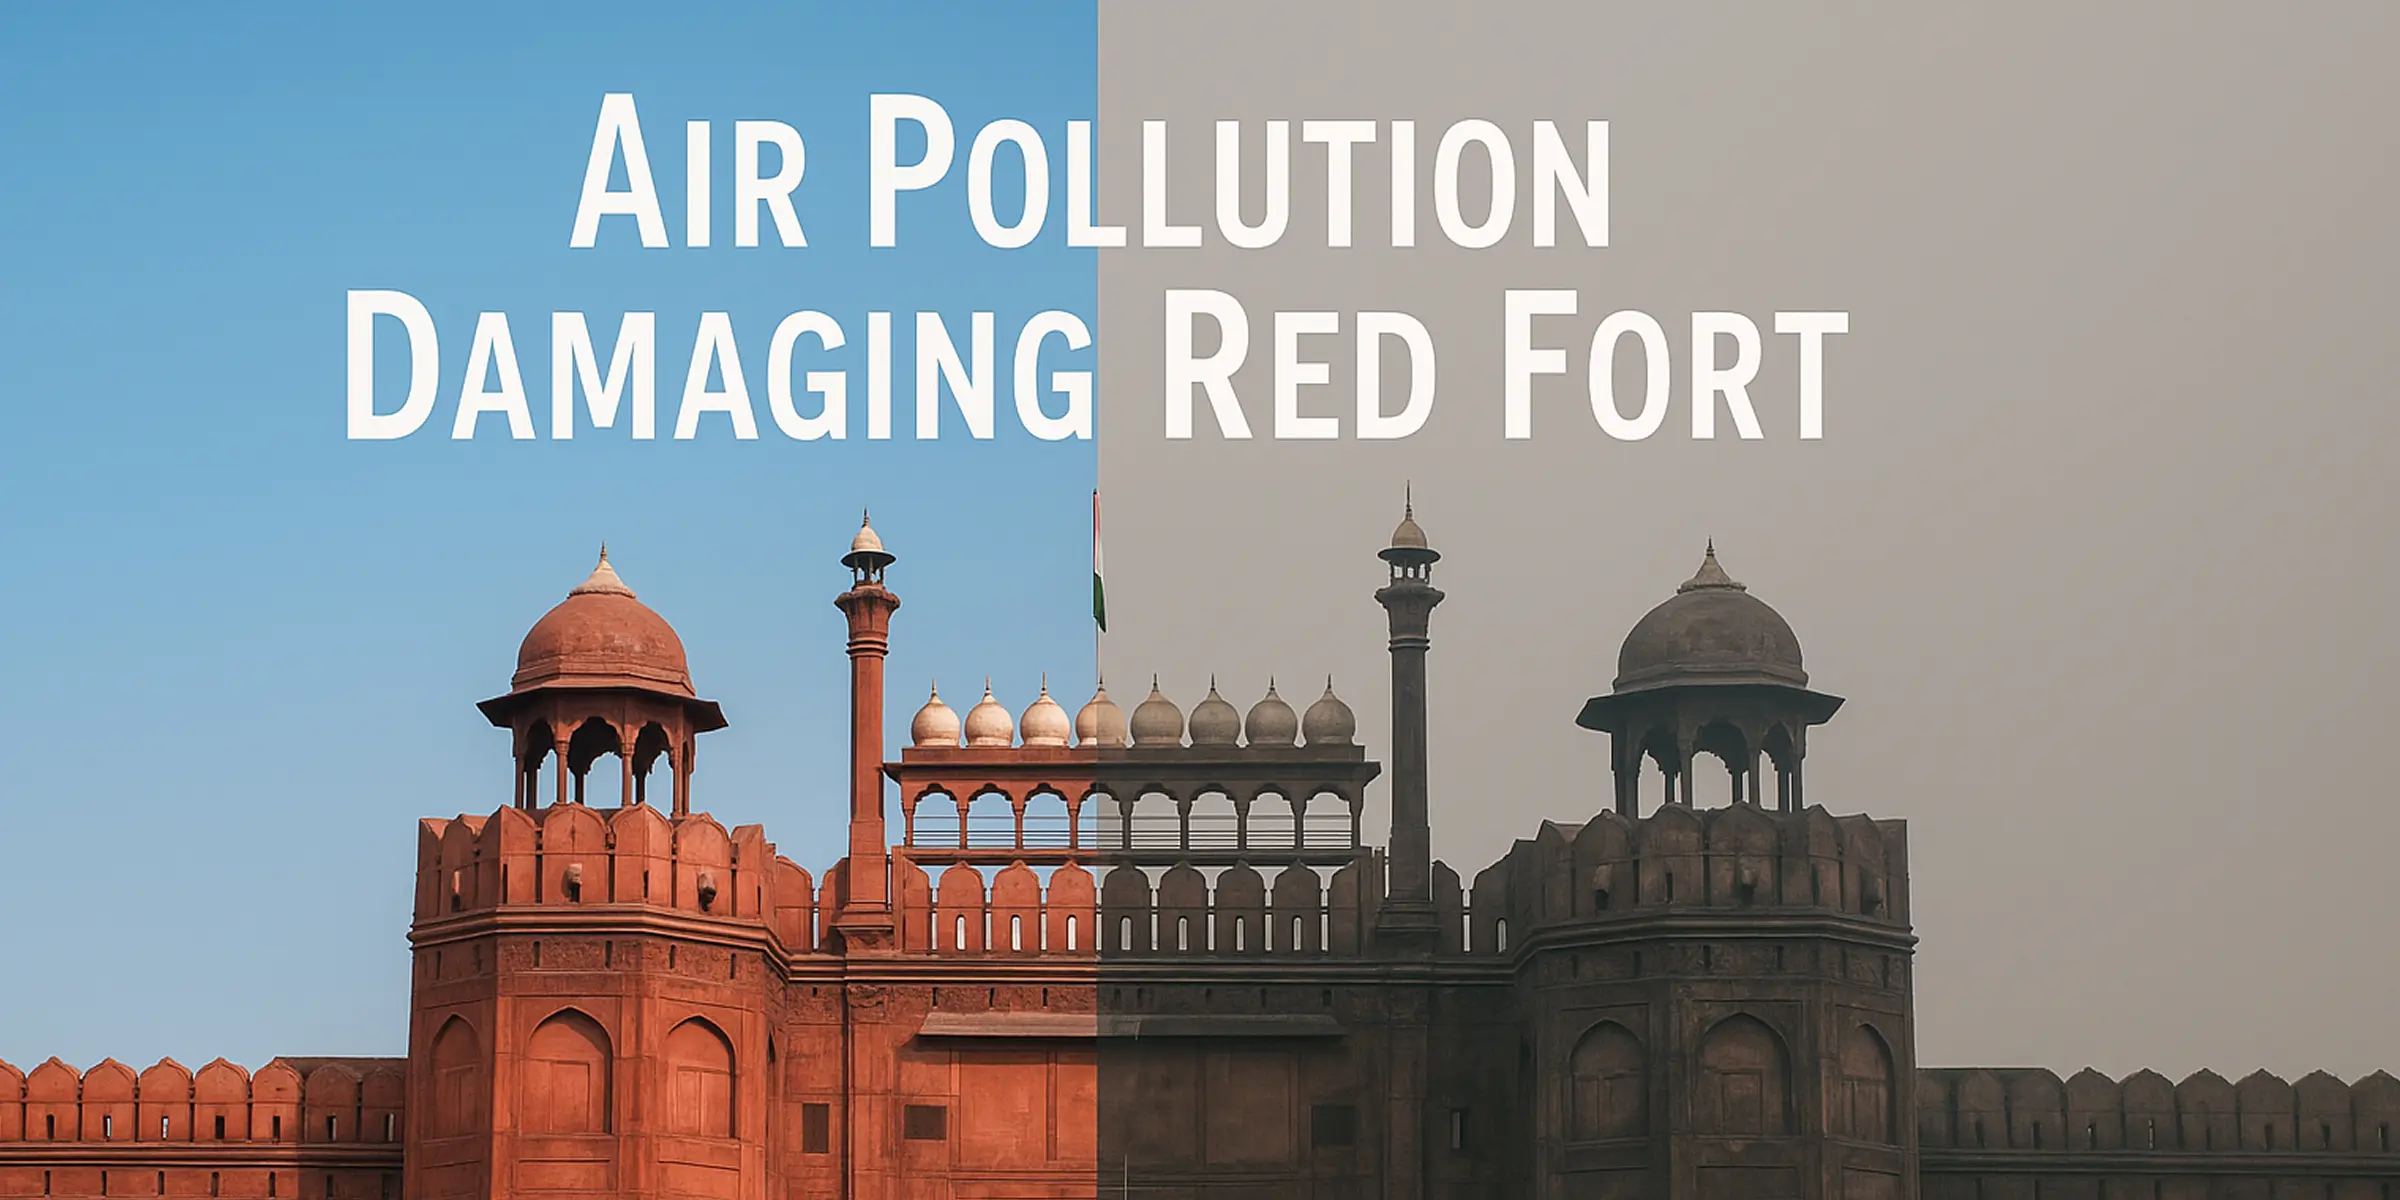
Red Fort in Delhi is Not Red Anymore! It is Turning Black: Air Pollution Damaging Red Fort
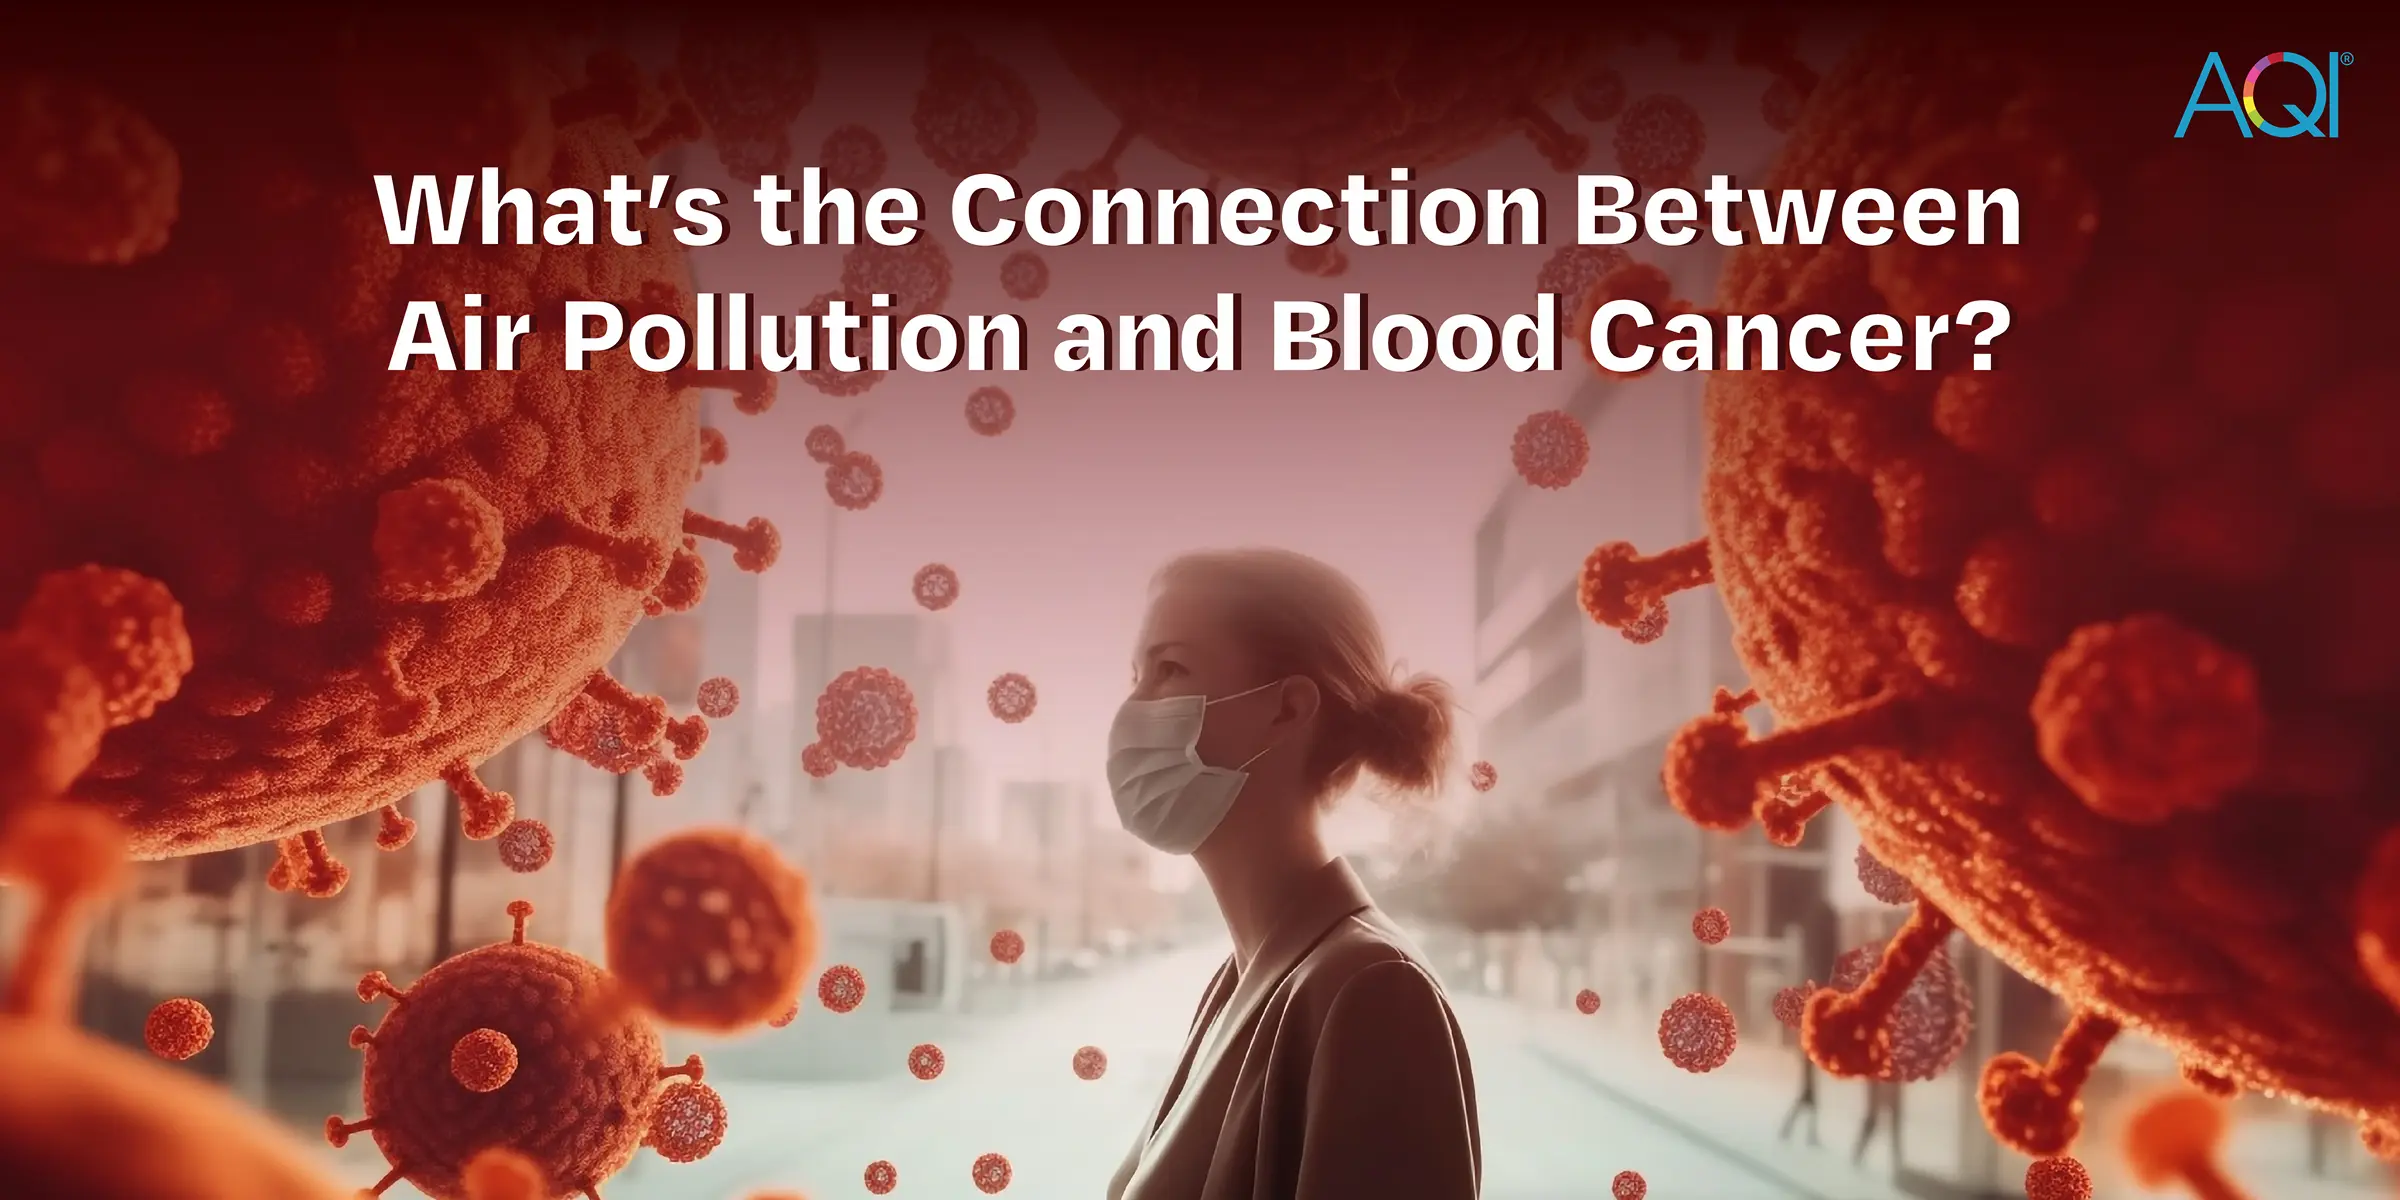
What’s the Connection Between Air Pollution and Blood Cancer?
Grafik AQI
Data Kualitas Udara Historis
Noida
Unduh Data Tahunan 2024
Laporan Kualitas Udara Dunia

Tren AQI - Perubahan Kualitas Udara Tahunan
Noida, Uttar Pradesh, India
Tren Tahunan AQI
Tahun Paling dan Paling Sedikit Tercemar
* Analisis data ini dari tahun 2020 - 2025
Lokasi Noida
Tingkat Polusi Udara Waktu Nyata
Kota Metro India
Indeks Kualitas Udara


Kalender Kualitas Udara 2025
Noida
Saran Kesehatan Untuk Orang yang Tinggal Di
Noida
6.1Cigarettes per day

Menghirup udara di lokasi ini sama berbahayanya dengan merokok 6.1 rokok per hari.
Sumber:
Berkeley Earth
Solusi untuk AQI Saat Ini
 Penyaring UdaraHidupkan
 Filter MobilHarus
 Masker N95Harus
 Tetap di Dalam RuanganHarus
Harus menghidupkan penyaring udara untuk menikmati udara segar.
Dapatkan Penyaring UdaraCegah Masalah Kesehatan: Pahami Risiko Anda
Noida
 Asma
Asma Masalah Jantung
 Alergi
 Sinus
Sinus Flu/Demam
 Kronis (COPD)

Tinggi Peluang Asma
Asma
Risiko gejala Asma adalah Tinggi ketika AQI adalah Parah (150-301)
Gejala parah termasuk mengi yang intens, sesak napas yang parah, rasa sesak dada yang signifikan, dan batuk terus-menerus yang dapat mengganggu aktivitas sehari-hari.
Yang Harus Dilakukan :
Hindari pergi keluar dan jaga jendela tetap tertutup untuk mengurangi paparan polutan.
Ambil obat yang diresepkan sesuai petunjuk penyedia layanan kesehatan Anda.
Pertahankan udara dalam ruangan yang bersih dengan penyaring udara, terutama di kamar tidur dan ruang tamu.
Yang Tidak Boleh Dilakukan :
Merokok atau terpapar asap rokok kedua.
Terlibat dalam aktivitas fisik di luar ruangan.
Kota Paling Tercemar 2025
India
Analisis kota-kota paling tercemar udara secara real-time di negara tersebut.
Nilai Standar
1.
Siwani, India
2.
Nagli Bahrampur, India
3.
Kapurthala, India
4.
Noida, India
5.
Begampur, India
6.
Amritsar, India
7.
Ghaziabad, India
8.
Khairabad, India
9.
Narkatiaganj, India
10.
Meerut, India
Terakhir Diperbarui: 18 Oct 2025, 05:34 PM
Peringkat Kota AQIAir Quality Solutions For Noida
Jelajahi solusi pemantauan kualitas udara & udara bersih.
Berikut adalah beberapa aplikasi yang dapat Anda lihat untuk menemukan solusinya.


Solusi Analisis Data AQI untuk Noida
Platform Pemantauan Data Kualitas Udara

Memberdayakan Keputusan Anda dengan Data yang Andal
Data waktu nyata untuk area Anda dengan parameter rinci.
Saran kesehatan yang dipersonalisasi sesuai dengan AQI saat ini.
Data analitis untuk mengidentifikasi tren dan kondisi.
Sambungkan dan kendalikan perangkat kualitas udara Anda.
FAQ Kualitas Udara
di Noida
Pertanyaan yang Sering Diajukan Tentang Kualitas Udara
Apa tingkat AQI saat ini di Noida?
Tingkat AQI waktu nyata saat ini di Noida adalah 271 (Severe). Ini terakhir diperbarui 2025-10-18 10:58:54 PM (Waktu Lokal).
Kapan tingkat AQI terbaik di Noida dalam 24 jam terakhir?
Tingkat AQI terbaik adalah 179 (Tidak Sehat) pada 4:04 PM (Waktu Lokal) dalam 24 jam terakhir.
Kapan tingkat AQI terburuk di Noida dalam 24 jam terakhir?
Tingkat AQI terburuk adalah 257 (Parah) pada 10:04 PM (Waktu Lokal) dalam 24 jam terakhir.
Apa tren tingkat AQI saat ini di Noida selama 24 jam terakhir?
Tingkat AQI di Noida telah berfluktuasi sepanjang 24 jam terakhir. Tingkatnya meningkat paling tinggi 257 pada 10:04 PM (Waktu Lokal), terendah 179 pada 4:04 PM (Waktu Lokal).
Tindakan apa yang direkomendasikan sesuai dengan tingkat AQI saat ini di Noida?
Tingkat AQI saat ini adalah 'Sangat Tidak Sehat,' disarankan untuk tetap di dalam ruangan, membatasi aktivitas luar ruangan, menggunakan pembersih udara, dan mengenakan masker jika keluar rumah sangat diperlukan.
Blog AQI Terbaru
Baca berita terbaru
Berikut adalah beberapa blog terbaru yang dapat Anda baca untuk mengetahui lebih lanjut tentang polusi udara.