Woolwich Nitrogen Dioxide (NO2) Level
Greenwich, United Kingdom

23ppb
Last Updated: 2025-10-16 02:22:04 PM (Local Time)

Woolwich
What is the Current NO2 Level?
Woolwich
The current NO2 level in Woolwich based on the average air quality level across the city is 23 ppb, making it healthy and safe for everyone.
The current NO2 level in Woolwich is 1.7x Above the recommended WHO guideline of 13.29 ppb.
Trending in United Kingdom

Air Quality Monitoring for Logistics: Smarter Deliveries with Data
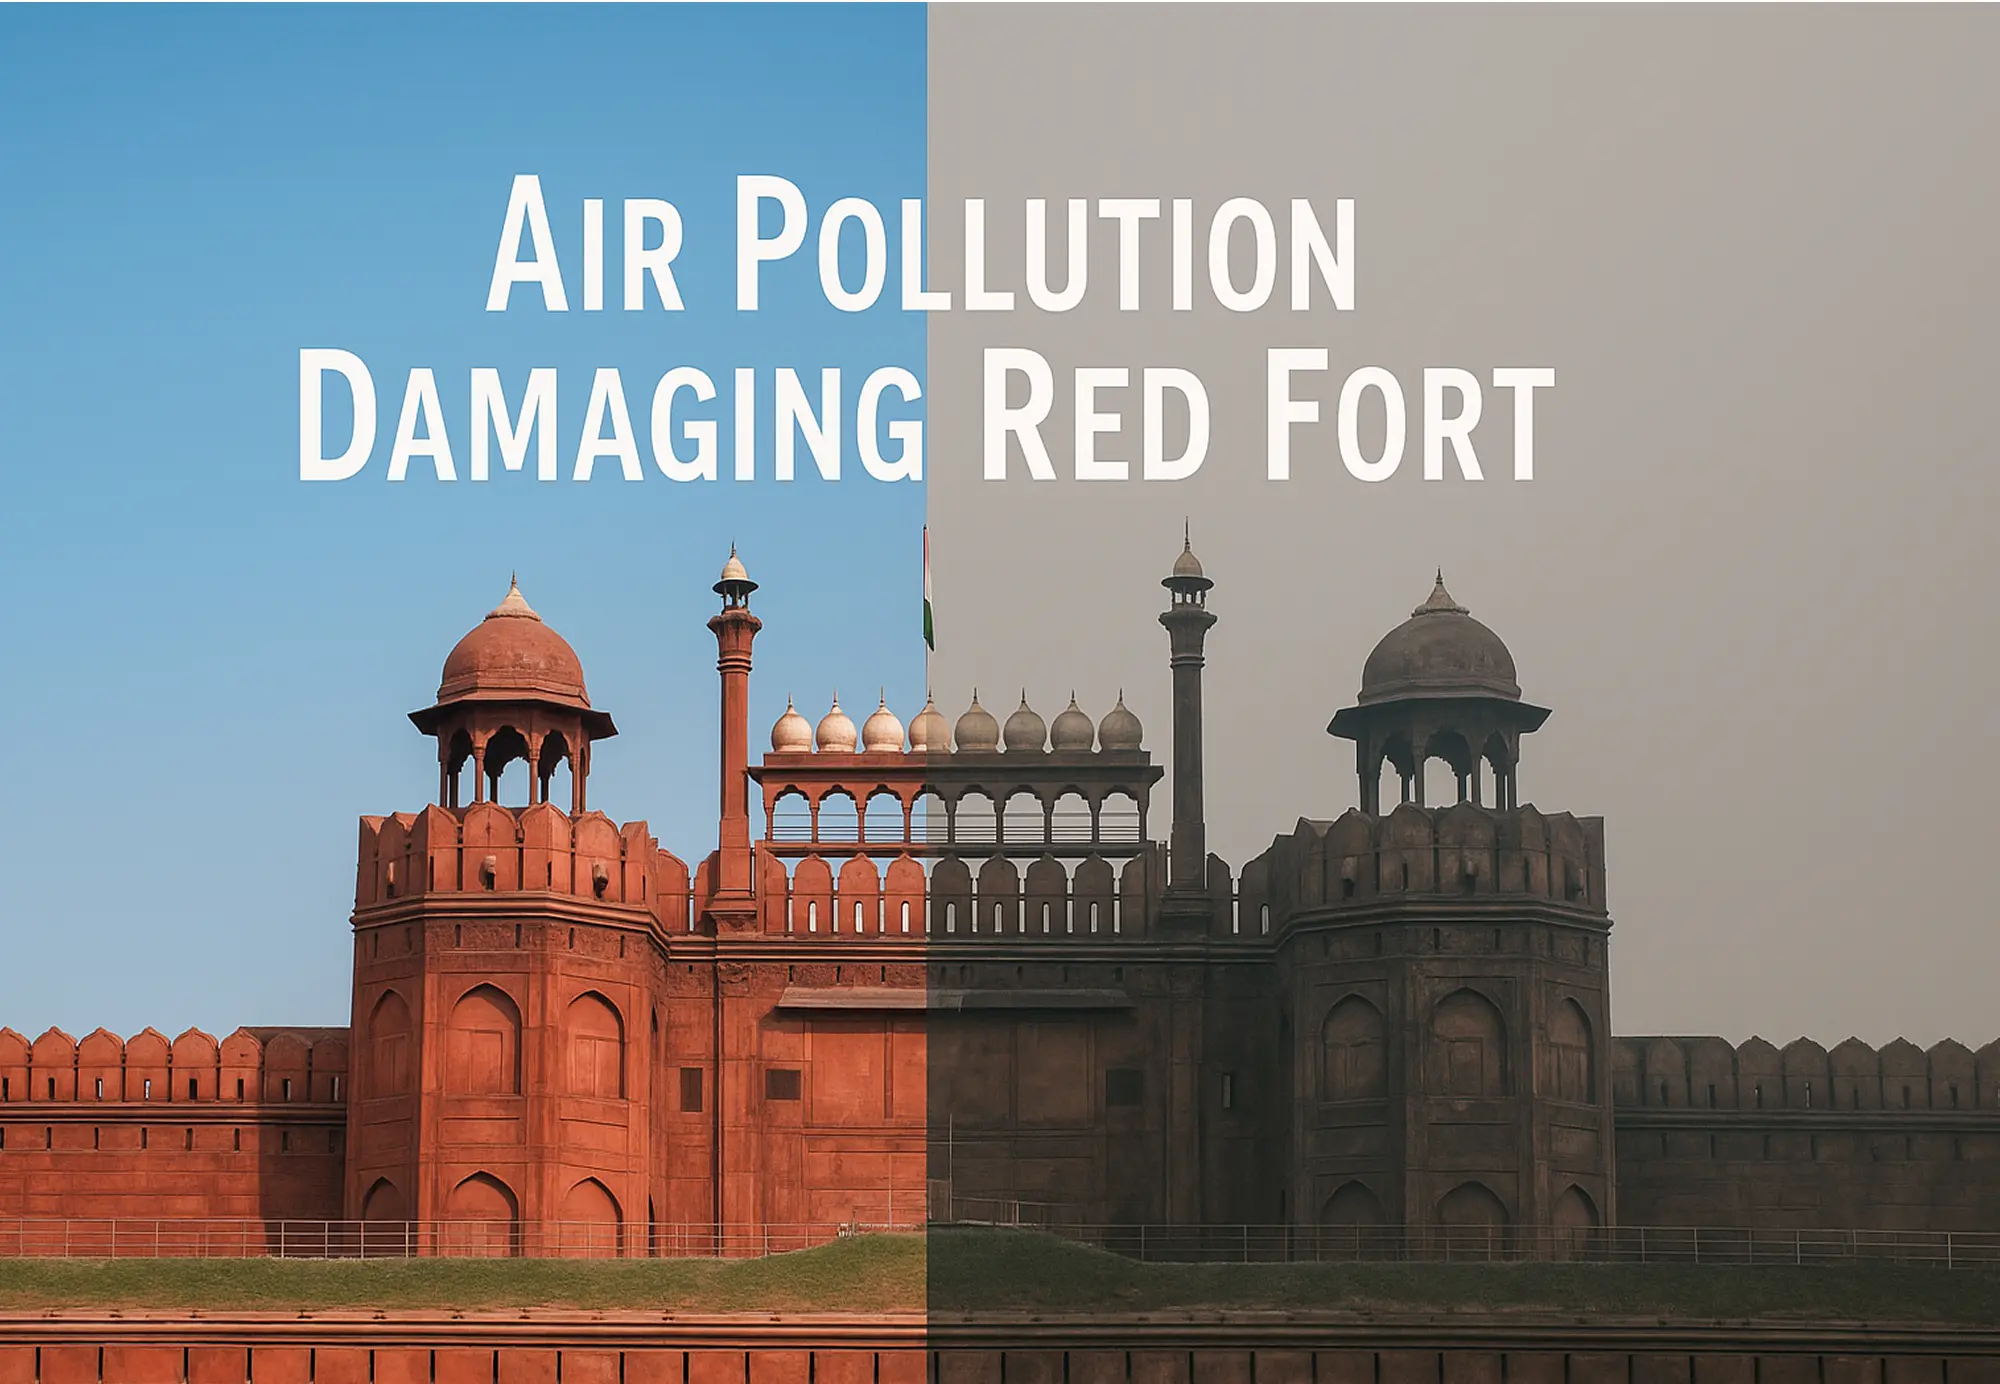
Red Fort in Delhi is Not Red Anymore! It is Turning Black: Air Pollution Damaging Red Fort

What’s the Connection Between Air Pollution and Blood Cancer?
AQI Graph
Historical Air Quality Data
Woolwich
Download 2024 Annual Data
World Air Quality Report

Do you know NO2 can create impaired atmospheric visibility can increase atmospheric heat? It happens as its concentrations absorb the visible radiation in the atmosphere.

Uncovering the Sources of Nitrogen Dioxide (NO2): Where Does It Come From?

Explosives and welding
Release during high-temperature processes.
Lighting
Emissions from certain types of lighting.
Power-generating plants
Emissions from fossil fuels burning for electricity.
Road traffic
Overall contributions from vehicles on the road.
Motor vehicles
Exhaust gases from cars and trucks.Short-Term NO2 Exposure Impacts

Coughing
Regular cough due to airways irritations.
Wheezing
More whistling sound while breathing,
Difficulty in breathing
Shortness of breath and reduced lung function.
Reduce smelling ability
Decreased sense of smell due to irritation.Health Advice Based on Current NO2 Level In
Woolwich


As per the current NO2, turn off the air purifier.
Get an Air PurifierRecommendations by 

NO2 Monitor
Track real-time NO2 with the utmost air quality monitor.

NO2 Sensor
Keep safe and stay aware about the NO2 level in your area.

Car Filter
Trap particles before they enter your vehicle, ensuring a safe and healthy ride.

N95 Mask
Protect yourself from harmful airborne particles by wearing an N95 mask.
Why you should care about Nitrogen Dioxide (NO2)?
Know More About NO2 Sensor
Air Quality FAQs
at Woolwich
Frequently Asked Questions About Air Quality
What is the current NO2 level in Woolwich?
The current real-time NO2 level in Woolwich is 23 ppb (Good). This was last updated 2025-10-16 02:22:04 PM (Local Time).
When was the best NO2 level in Woolwich in the last 24 hours?
The best NO2 level was 8 ppb (Good) at 6:04 AM (Local Time) during the last 24 hours.
When was the worst NO2 level in Woolwich in the last 24 hours?
The worst NO2 level was 32 ppb (Good) at 11:04 AM (Local Time) during the last 24 hours.
What is the current trend of NO2 levels in Woolwich during last 24 hours?
The NO2 levels in Woolwich have been fluctuating throughout the last 24 hours. The levels have increased by highest 32 ppb at 11:04 AM (Local Time), lowest 8 ppb at 6:04 AM (Local Time).
What actions are recommended as per the current NO2 level in Woolwich?
The air quality is satisfactory, and air pollution poses little or no risk. No special precautions are needed; enjoy outdoor activities freely.
