24 hrs avg AQI
PM2.5 8.2X
The current PM2.5 concentration in New Delhi is 8.2 times above the recommended limit given by the WHO 24 hrs air quality guidelines value.
| LOCATIONS | Status | AQI-US | AQI-IN | PM2.5 | PM10 | Temp | Humid |
|---|---|---|---|---|---|---|---|
| ITI Shahdra | UNHEALTHY | 225 | 328 | 146 | 372 | 26 | 39 |
| Loni | POOR | 181 | 280 | 114 | 264 | 28 | 35 |
| Pooth Khurd | UNHEALTHY | 208 | 330 | 158 | 358 | 31 | 27 |
| Ihbas | POOR | 162 | 223 | 76 | 273 | 26 | 38 |
| ITI Jahangirpuri | POOR | 195 | 310 | 133 | 343 | 31 | 27 |
| Narela | UNHEALTHY | 270 | 366 | 136 | 403 | 28 | 36 |
| Mother Dairy Plant | POOR | 194 | 315 | 139 | 326 | 32 | 26 |
| Sonia Vihar Water Treatment Plant Djb | POOR | 197 | 319 | 144 | 318 | 26 | 38 |
| Alipur | POOR | 180 | 270 | 111 | 301 | 28 | 36 |
| Punjabi Bagh | POOR | 194 | 314 | 138 | 311 | 31 | 27 |
| Sri Auribindo Margta | POOR | 190 | 309 | 132 | 276 | 26 | 52 |
| Shaheed Sukhdev College Of Business Studies | POOR | 189 | 308 | 130 | 324 | 31 | 27 |
| Delhi Institute Of Tool Engineering | UNHEALTHY | 207 | 328 | 157 | 321 | 31 | 27 |
| Jawaharlal Nehru Stadium | POOR | 177 | 253 | 106 | 250 | 26 | 52 |
| Satyawati College | POOR | 193 | 290 | 105 | 340 | 26 | 52 |
| Mandir Marg | POOR | 192 | 311 | 135 | 322 | 26 | 52 |
| Mundka | UNHEALTHY | 238 | 341 | 174 | 382 | 31 | 27 |
| RK Puram | POOR | 184 | 298 | 119 | 295 | 26 | 52 |
| Pusa | POOR | 198 | 321 | 147 | 318 | 26 | 52 |
| Anand Vihar | UNHEALTHY | 224 | 327 | 139 | 371 | 26 | 39 |
| PGDAV College | POOR | 193 | 312 | 136 | 244 | 32 | 26 |
| New Delhi Us Embassy | POOR | 189 | 281 | 109 | 331 | 32 | 26 |
| Major Dhyan Chand National Stadium | POOR | 187 | 304 | 126 | 286 | 32 | 26 |
| Lajpat Nagar | POOR | 183 | 290 | 117 | 247 | 32 | 26 |
| Prashant Vihar | POOR | 191 | 310 | 133 | 313 | 32 | 26 |
| Saket Block C | POOR | 183 | 290 | 117 | 259 | 32 | 26 |
| Embassy of Belgium | POOR | 181 | 280 | 114 | 275 | 32 | 26 |
| LIC Colony | POOR | 195 | 316 | 141 | 318 | 32 | 26 |
| Sir Edmund Hillary Marg | POOR | 183 | 290 | 117 | 282 | 32 | 26 |
| Shastri Nagar | POOR | 189 | 307 | 129 | 310 | 32 | 26 |
| Uttam Nagar | POOR | 199 | 322 | 149 | 343 | 32 | 26 |
| Ashok Vihar Phase 1 | POOR | 186 | 302 | 123 | 308 | 32 | 26 |
| Rohini Sector 7 | POOR | 191 | 310 | 133 | 303 | 32 | 26 |
| Hari Nagar | POOR | 193 | 312 | 136 | 308 | 32 | 26 |
| Vasundhara Enclave | POOR | 192 | 311 | 134 | 328 | 31 | 27 |
| Golf Links | POOR | 179 | 267 | 110 | 248 | 31 | 27 |
| Punjabi Bagh Block D | POOR | 189 | 308 | 130 | 295 | 32 | 26 |
| Anand Lok | POOR | 181 | 280 | 114 | 235 | 32 | 26 |
| Ashok Vihar Phase 3 | POOR | 181 | 277 | 113 | 303 | 32 | 26 |
| Green Park | POOR | 179 | 267 | 110 | 255 | 32 | 26 |
| Defence Colony | POOR | 181 | 280 | 114 | 235 | 32 | 26 |
| Karol Bagh | POOR | 189 | 308 | 130 | 301 | 32 | 26 |
| Kalkaji | POOR | 182 | 287 | 116 | 263 | 32 | 26 |
| HT House | POOR | 183 | 290 | 117 | 297 | 31 | 27 |
| Okhla Phase II | POOR | 179 | 267 | 110 | 270 | 31 | 27 |
| Katwaria Sarai | POOR | 181 | 280 | 114 | 250 | 32 | 26 |
| Ramesh Park | POOR | 187 | 304 | 125 | 314 | 31 | 27 |
| Chanakya Puri | POOR | 180 | 270 | 111 | 270 | 32 | 26 |
| Rohini Sector 30 | POOR | 191 | 310 | 133 | 312 | 32 | 26 |
| Anand Parbat | POOR | 188 | 306 | 128 | 294 | 32 | 26 |
| Kohat Enclave | POOR | 192 | 311 | 134 | 296 | 32 | 26 |
| Greater Kailash II | POOR | 179 | 263 | 109 | 255 | 32 | 26 |
| Mori Gate | POOR | 181 | 277 | 113 | 294 | 32 | 26 |
| Shalimar Bagh | POOR | 190 | 308 | 131 | 293 | 32 | 26 |
| Panchsheel Vihar | POOR | 178 | 257 | 107 | 237 | 32 | 26 |
| Mukherjee Nagar | POOR | 182 | 283 | 115 | 304 | 32 | 26 |
| Rohini Sector 24 | POOR | 187 | 304 | 125 | 297 | 32 | 26 |
| Dwarka Sector 10 | UNHEALTHY | 201 | 324 | 151 | 351 | 32 | 26 |
| Model Town | POOR | 184 | 300 | 120 | 306 | 32 | 26 |
| Ghazipur | POOR | 189 | 308 | 130 | 325 | 32 | 26 |
| Rohini Sector 15 | POOR | 187 | 304 | 125 | 297 | 32 | 26 |
| Ashok Vihar Phase 4 | POOR | 178 | 260 | 108 | 301 | 32 | 26 |
| Janakpuri | POOR | 192 | 312 | 135 | 307 | 32 | 26 |
| Shahdara | POOR | 179 | 267 | 110 | 304 | 32 | 26 |
| Wazirpur | POOR | 189 | 308 | 130 | 292 | 32 | 26 |
| Malviya Nagar | POOR | 182 | 283 | 115 | 249 | 32 | 26 |
| Rajinder Nagar | POOR | 189 | 308 | 130 | 298 | 32 | 26 |
| GTB Nagar | POOR | 177 | 250 | 105 | 300 | 32 | 26 |
| Raghubir Nagar | POOR | 188 | 306 | 128 | 290 | 32 | 26 |
| Civil Lines | POOR | 180 | 270 | 111 | 294 | 32 | 26 |
| New Friends Colony | POOR | 182 | 283 | 115 | 246 | 32 | 26 |
| Sheikh Sarai | POOR | 178 | 257 | 107 | 232 | 32 | 26 |
| Naraina Industrial Area | POOR | 189 | 308 | 130 | 290 | 32 | 26 |
| Inderlok | POOR | 182 | 287 | 116 | 287 | 32 | 26 |
| Jangpura | POOR | 176 | 247 | 104 | 232 | 32 | 26 |
| Vasant Kunj | POOR | 182 | 283 | 115 | 250 | 32 | 26 |
| Dwarka Sector 11 | UNHEALTHY | 202 | 325 | 152 | 353 | 32 | 26 |
| Greater Kailash | POOR | 177 | 250 | 105 | 250 | 32 | 26 |
| Ashok Vihar Phase 2 | POOR | 185 | 302 | 122 | 307 | 32 | 26 |
| Hastsal | POOR | 192 | 312 | 135 | 307 | 32 | 26 |
| Delhi Cantt | POOR | 180 | 270 | 111 | 270 | 32 | 26 |
| Diplomatic Enclave | POOR | 178 | 260 | 108 | 262 | 32 | 26 |
| Bawana Industrial Area | POOR | 193 | 312 | 135 | 340 | 31 | 27 |
| Gulmohar Park Block B | POOR | 176 | 247 | 104 | 229 | 32 | 26 |
| Hauz Khas | POOR | 176 | 247 | 104 | 232 | 32 | 26 |
| I P Extension | POOR | 189 | 307 | 129 | 324 | 32 | 26 |
| Niti Marg | POOR | 178 | 260 | 108 | 262 | 32 | 26 |
| Bali Nagar | POOR | 187 | 304 | 125 | 284 | 32 | 26 |
| Sukhdev Vihar | POOR | 178 | 260 | 108 | 247 | 31 | 27 |
| Delhi Gymkhana Club | POOR | 176 | 247 | 104 | 252 | 32 | 26 |
| Paschim Vihar | POOR | 187 | 304 | 125 | 284 | 32 | 26 |
| Dwarka Sector 6 | UNHEALTHY | 207 | 328 | 157 | 355 | 32 | 26 |
| Saket | POOR | 178 | 257 | 107 | 236 | 32 | 26 |
| Dwarka Sector 23 | POOR | 195 | 315 | 140 | 332 | 32 | 26 |
| Safdarjung Enclave | POOR | 177 | 250 | 105 | 247 | 32 | 26 |
| Darya Ganj | POOR | 180 | 270 | 111 | 298 | 31 | 27 |
| Deepali | POOR | 187 | 304 | 125 | 283 | 32 | 26 |
| Dwarka Sector 12 | UNHEALTHY | 207 | 328 | 157 | 355 | 32 | 26 |
| Dwarka Sector 7 | POOR | 196 | 317 | 142 | 333 | 31 | 27 |
| Bhalswa Landfill | POOR | 186 | 302 | 123 | 295 | 32 | 26 |
| Dwarka Sector 5 | POOR | 196 | 317 | 142 | 329 | 31 | 27 |
| Dwarka Sector 18B | UNHEALTHY | 209 | 330 | 159 | 356 | 31 | 27 |
| Dwarka Sector 3 | UNHEALTHY | 205 | 327 | 155 | 349 | 31 | 27 |
| Mayur Vihar | POOR | 188 | 305 | 127 | 310 | 32 | 26 |
| Vasant Vihar | POOR | 179 | 267 | 110 | 268 | 31 | 27 |
| Sukhdev Vihar DDA Flats | POOR | 177 | 250 | 105 | 241 | 31 | 27 |
| Kashmiri Gate ISBT | POOR | 180 | 273 | 112 | 281 | 32 | 26 |
| New Sarup Nagar | POOR | 188 | 305 | 127 | 312 | 31 | 27 |
| Mustafabad | POOR | 176 | 247 | 104 | 283 | 31 | 27 |
| Siddhartha Enclave | POOR | 180 | 273 | 112 | 229 | 32 | 26 |
| Hazrat Nizamuddin | POOR | 175 | 240 | 102 | 231 | 32 | 26 |
| Connaught Place | POOR | 180 | 270 | 111 | 290 | 32 | 26 |
| East Patel Nagar | POOR | 188 | 306 | 128 | 288 | 32 | 26 |
| Saraswati Marg | POOR | 186 | 302 | 123 | 293 | 32 | 26 |
| Loni Dehat | POOR | 182 | 283 | 115 | 274 | 31 | 27 |
| Surya Nagar | POOR | 188 | 302 | 123 | 330 | 31 | 27 |
| Rohini Sector 10 | POOR | 184 | 300 | 120 | 290 | 31 | 27 |
| Rohini Sector 5 | POOR | 184 | 297 | 119 | 280 | 31 | 27 |
| RK Puram North Block | POOR | 177 | 250 | 105 | 256 | 32 | 26 |
Local Time
Wind speed
33 km/h
UV Index
16
Pressure
800 mb
Wear Mask
Stay Indoor
Windows
Use Purifier
Family
AQI
AQI
AQI
AQI
AQI
AQI
AQI
New Delhi
24 hrs avg AQI
Quick answers to some commonly asked questions about the air pollution of New Delhi.
The real-time air quality in New Delhi is 292 (POOR) AQI now. This was last updated 3 minutes ago .
The current concentration of PM2.5 in New Delhi is 123 (µg/m³). The World Health Organisation (WHO) recommends 15 µg/m³ as the threshold concentration of PM2.5 for 24 hrs mean. Currently, the concentration is 4.92 times the recommended limit.
Generally, the air quality at New Delhi starts deteriorating in late October. The winters are the worst-hit season in terms of air pollution.
You should wear a good N95 mask when you go outdoor in New Delhi until the AQI is improving upto moderate range.
Office going people should avoid personal vehicles and use public transportations or carpooling.
(i) The primary causes of outdoor air pollution are solid, liquid particles called aerosols & gase from vehicles emissions, construction activities, factories, burning stubble & fossil fuels and wildfire, etc.
(ii) Main causes of indoor air pollution are harmful gases from cooking fuels (such as wood, crop wastes, charcoal, coal and dung), damp, mould smoke, chemicals from cleaning materials, etc.
Indoor air pollution in New Delhi is as dangerous as outdoor pollution, because the air pollutants come inside the houses or buildings through doors, windows and ventilation.
In New Delhi , you must use an air purifier or fresh air machine at home or office indoor and close all the doors, windows and ventilations when the outdoor air quality index (aqi) in New Delhi is very high. Proper ventilation is highly recommended only when outdoor air quality is improving and moderate AQI range.
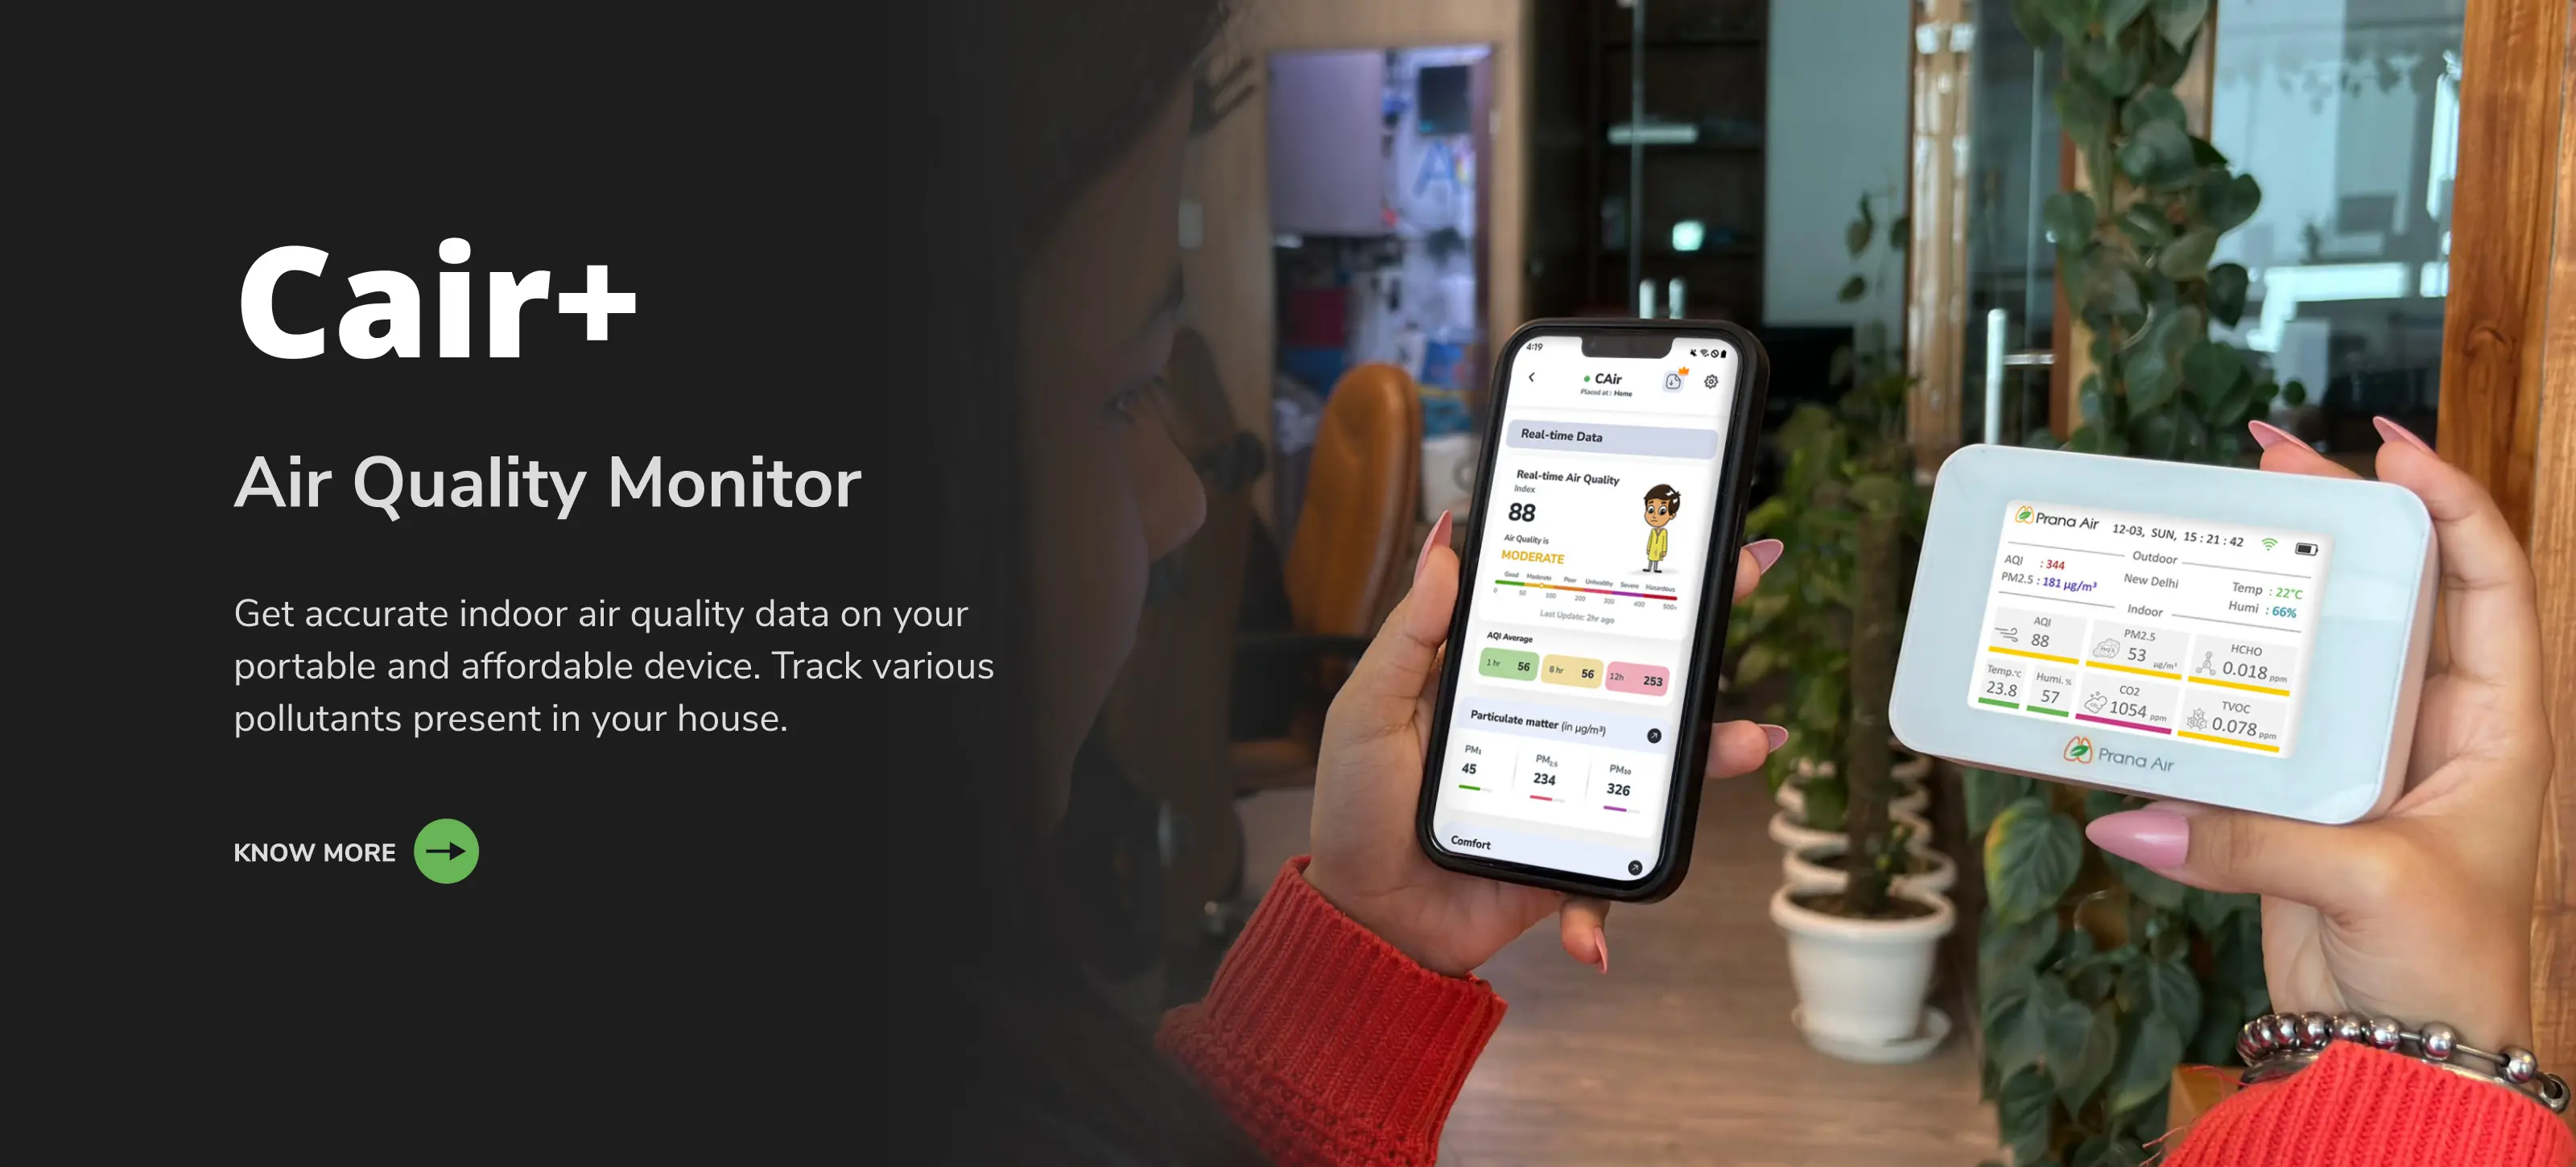
Find out Prana Air's air quality monitors & solutions to fight air pollution in your city.

Know what the quality your are breathing with Prana Air monitors (low-cost & accurate).

Analyze the quality of air anywhere with accurate & compact gas & pm sensors.

Purify your indoor air & make it free from air pollution and toxins with our air purifier.

Make sure you breathe fresh inside your car with a highly efficient car cabin filter.

Breathe pure air with Prana Air motorized masks of multi-layer hepa filter purification.
A report by the Environmental Performance Index in 2014 said that a total decline of 100 percent was seen in the air quality of India in the last 10 years and the city that has been hit the greatest is the capital city, New Delhi, India. Research by Berkeley Earth revealed that on an average, when the AQI is in a relatively better state than the usual, breathing that air still means that pollutants equal to the same amount as 31 cigarettes smoke entering your lungs.
With statistics like these, all of us need to be educated and concerned about the rising Delhi pollution level. Learn about the causes and effects of Delhi air pollution so that we can understand the problem and try to bring a change on a personal and public level.
There are many causes and sources of Delhi air pollution like stubble burning, vehicle emissions, industrial pollution, construction, cold weather, geographic location, stagnant winds, population growth, Badarpur thermal power plant, fire in Bhalswa Landfills, etc.
Agricultural stubble burning has been the major caterer to the rising air pollution and smog in Delhi. The problem is that as there is a very short time gap between the harvesting of paddy and wheat, the straw from the last harvest needs to be disposed off as soon as possible. The government has suggested the farmers do manual or mechanical management of straw but as the process is expensive and takes more time, farmers switch back to their traditional practice of stubble burning. Thousands of crores have been spent by the Central and the State government of India, a ban has been put on the practice but stubble burning has not come under control yet. The smoke from this agricultural burning gets transported to Delhi because of the westerly winds. According to a study by IIT Kanpur, agricultural burning is the third largest contributor towards particulate matters in Delhi.
It is the number one contributor to the PM2.5 and PM10 particles in Delhi which is 28%. And overall, out of the total air pollution, 41 percent is due to vehicular emissions. Vehicular emissions have a large number of carbon monoxide in them. Long exposure to it can cause death and more and more vehicular emission is causing CO to accumulate in our atmosphere.
Delhi has the highest number of small-scale industries in India and they do not respect any limits on the emission of toxic fumes and pollutants. They are the second highest contributor to the poor air quality of Delhi with 3182 industries.
Construction and dust pollution has been one of the major factors that led to this massive air pollution in Delhi. According to DPCC, 30 percent of the Pollution in Delhi has been due to the construction and demolition. This pollution is not much under attention and the government right now is taking steps to change that.
Bhalswa Landfill is a dumping ground that has been in use since 1984. It spread about 52 acres and has reached to heights of 62 metres. It has been creating havoc in Delhi for years now. The landfill has been used beyond its capacity way before but still no waste management has been done. The waste that keeps lying around starts decomposing and because the volume of waste is so high that the whole area becomes prone to a fire. Because of the nature of the waste, the smoke from the fire not only produces a large amount of particulate matter, it also releases toxic amounts of Carbon Monoxide, Hydrogen Sulphide among the few. In 2019 also, an incident where a fire started that set the landfill and Jahangirpuri ablaze.
Cold weather in Delhi has also managed to be a significant part of Delhi pollution. As the temperature dips in Delhi, it lowers the aversion height of all the smog and other particulate matters in the air. Aversion height is the altitude from ground towards the sky, till which the particulate matter can rise. During summers, the aversion height is much above and far from the ground so all the pollutants rise up and are not much harmful to us . But when the winters come, the aversion height drops, which leads to all the smog being a part of the air we inhale.
With a huge amount of pollutants being dispersed in the Delhi air daily, stagnant winds can cause a problem. When these huge amounts of pollutants don’t get a good speed of the wind, they start accumulating at a place which causes a hazy smog and doesn’t let the pollutants spread out.
Delhi is landlocked between the states of Haryana, Rajasthan and Uttar Pradesh which and Himalayas and due to this, the winds that can carry the pollutants is near to non-existent. The winds that come from the coastal region carry pollutants with them which get trapped by the Himalayas i.e. in Delhi. For example, Chennai’s vehicle density is 19 times more than Delhi’s but still Chennai has a moderate amount of particulate matter in its air because as its a coastal region and all its pollutants get carried away.
Population growth is the grass-root cause of air pollution. More people means more vehicles, more amenities, more industrial products, more agricultural practices. Delhi saw a stark population increase from 2011 to 2019. The population went from 16.7 million in 2011 to 20 million in 2019.
Even though Delhi boasts of managing the world’s biggest fleet of buses under it, this system needs to be bigger and better. Because as the public transport will be better and cheaper, then only there will be less vehicular emissions. Even though Delhi is 14 times bigger than Paris, Paris’s metro line is double the length of Delhi's.
1980s: The Start: Delhi started seeing a rise in the pollution levels in the 80’s where the emergence of vehicles started taking a toll on the air and stubble burning started in the states of Punjab and Haryana. At that time, riots were also on a high after Indira Gandhi got assassinated and banning burning of crops seemed like an anti-religion rule so all the state governments avoided rolling it out and thus the pollution started rising.
1996: The situation of the city worsened to which the Supreme Court ordered the Delhi Government to submit a plan on how they plan on reducing the rising Delhi air pollution.
1998: Increase in Diesel run vehicles peaked the amount of PM2.5 particles in the air.
2000: There was an enormous increase in a lot of pollution causing activities like construction, industrial manufacturing and vehicular emissions. From the 2000 to 2010, the level of PM10 particles in air went from moderate to poor levels. Vehicles also increased in the capital city of India with an annual growth rate of 10.75%.
2004: The National Air Quality Index was introduced seeing the air pollution scenario. Under the NAQI, air was categorized into six levels. good, satisfactory, moderate, poor, very poor and severe/hazardous to differentiate how polluted the air was.
2016: In October 2016, Delhi underwent a major smog episode, one of its first in line of the other that came through. Air Quality Index. As the Diwali season set in, the PM2.5 level in Delhi city reached approximately 750 μg/m3 to the horror of everyone. The AQI levels reached close to 13 times more than the permissible amount. This awoke Delhi and its officials and the government bodies to the devastating effects of air pollution. The whole city got covered with smog.
2017 - The Great Smog of Delhi:The incident known as the great smog has been the most devastating phase Delhi had to go through in terms of air pollution. The PM2.5 and PM 10 levels, whose healthy limits are 60-100 μg/m3 rose to 999 μg/m3 which was the highest level the sensors could calculate.
The same year in November 2017, on the second day of a test match between Sri-Lanka and India 2 players started vomiting due to the humongous amount of smog and pollutants in the air.
2019 November: A public health emergency was declared due to the smog and air pollution and holidays were announced till November 5.
In Delhi, poor air quality has damaged the lungs of half of the children in Delhi, according to WHO. As PM2.5 is such a small particle it can easily enter one’s lungs and erode one’s respiratory wellness.Increased risks of cancer, epilepsy and diabetes has also been seen among the children.
PM2.5 and PM10 particles are the main causes of reduced lung capacity. This in turn leads to sore throat, cough, asthma, allergies and lung cancer. Excessive CO2 in the air leads to headache, fatigue and loss of productivity. The number of non-smokers in Delhi who suffered from lung cancer shot up from 10 percent to 50 percent in a decade, all due to the increased pollutants in the air that people have to breathe.
Smog is exactly what the name might suggest, it is the mixture of smoke and fog. Excessive pollution in air causes smog and Delhi has had its fair share of smog over the years. Delhi observed the great smog in November 2017 which engulfed the whole city in it.
The environment is constantly degrading with the increasing air pollution. The main effect of Delhi pollution in the environment is the depletion of the ozone layer in the atmosphere due to which the UV rays from the Sun can directly enter the earth. The emission from industries is also a big cause for the global warming that is leading the glaciers to melt at a really fast pace.
Thousands of crores have been spent by the Central Government and the Punjab and Haryana Government to stop the stubble burning and help with better ways to dispose of the waste. Delhi Government has also been getting Green funds to fight the Air Pollution and curb it.
1988: As advised by Environment Pollution (Prevention and Control) Authority (EPCA), the Court made a ruling that the buses in the city change from using Diesel to CNG.
2010: BS-IV based vehicles were said to be mandatory.
2014: Air Quality Index was launched by the Union Environment Ministry.
2016: Arvind Kejriwal’s Promises
2017: The ‘Odd-Even’ rule was imposed. Parking fees were imposed and increased but due to no proper system, this scheme failed. Crackers were banned.
2018: 9 population hotspots were selected in the city and Anand Vihar was selected as the hot spot for pollution.
2020: A 10 member air pollution team was made. Their work was to examine the complaints from Green Delhi Mobile Application and then work towards solving them.
· · ·The residents of the capital city of India have to bear the brunt of the annual winter pollution. The air quality drops to such a level that the city is compared to a gas chamber! Delhi starts witnessing high levels of air pollution in late October and the contamination worsens until the end of the year. Many parts of the city experience pollution levels as high as 150 times the stipulated levels recommended by the World Health Organisation.
As a result of these events, the pollution levels are lesser in summers as compared to winters, provided the spatial and meteorological remain the same. You can observe a similar effect during winter afternoons. The increase in heat levels down pollution slightly.The early mornings and the nights are the worst. The impact of inversion is visibly evident, which is why the air quality plummets during these hours.
Atmospheric inversion occurs in winters. The normal conditions reverse themselves, and air near the lower atmosphere is cooler and denser. The relatively warmer air of the upper layers, hence, acts as an atmospheric lid. This lid entraps the pollutants within the cold layer and evades their atmospheric dispersion. Therefore, the vertical mixing occurs in the lower layer itself.At constant emission rates and concentration of pollutants, the lesser the temperature, the more is the pollution.
As a result of these events, the pollution levels are lesser in summers as compared to winters, provided the spatial and meteorological remains the same. You can observe a similar effect during winter afternoons. The increase in heat levels down pollution slightly.The early mornings and the nights are the worst. The impact of inversion is visibly evident, which is why the air quality plummets during these hours.
However, one of the worst incidents happened during an international cricket test match between India and Sri Lanka in December 2017. The match was stopped because many Sri Lankan players became sick. Several players experienced breathing problems and vomited. The Indian Medical Association expressed their concern over the unfortunate incident and insisted ICC to adopt a policy on pollution.
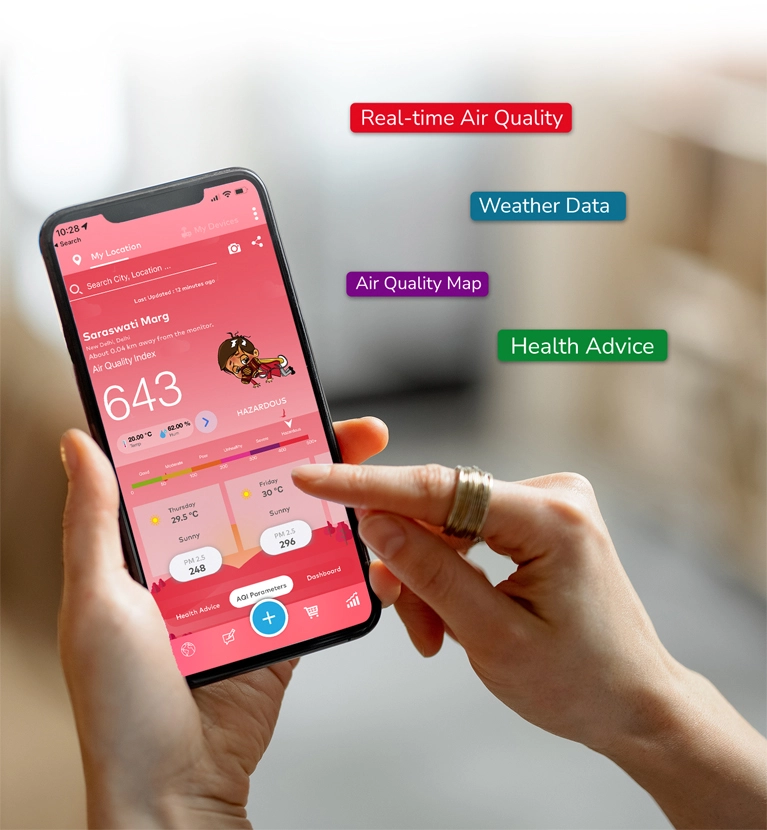
Know what you breathe and the quality of air in your city and nearby locations. Real-time AQI, map, weather & fire data, health advice with insightful & anlytical dasbboards.