Lu Feng Shi Air Quality Index (AQI) | Air Pollution
Real-time PM2.5, PM10 air pollution level in Shan Wei Shi
Last Updated: 20 Aug 2025, 12:10am (Local Time)


26 °C
Patchy rain nearbyLu Feng Shi
Trending in China
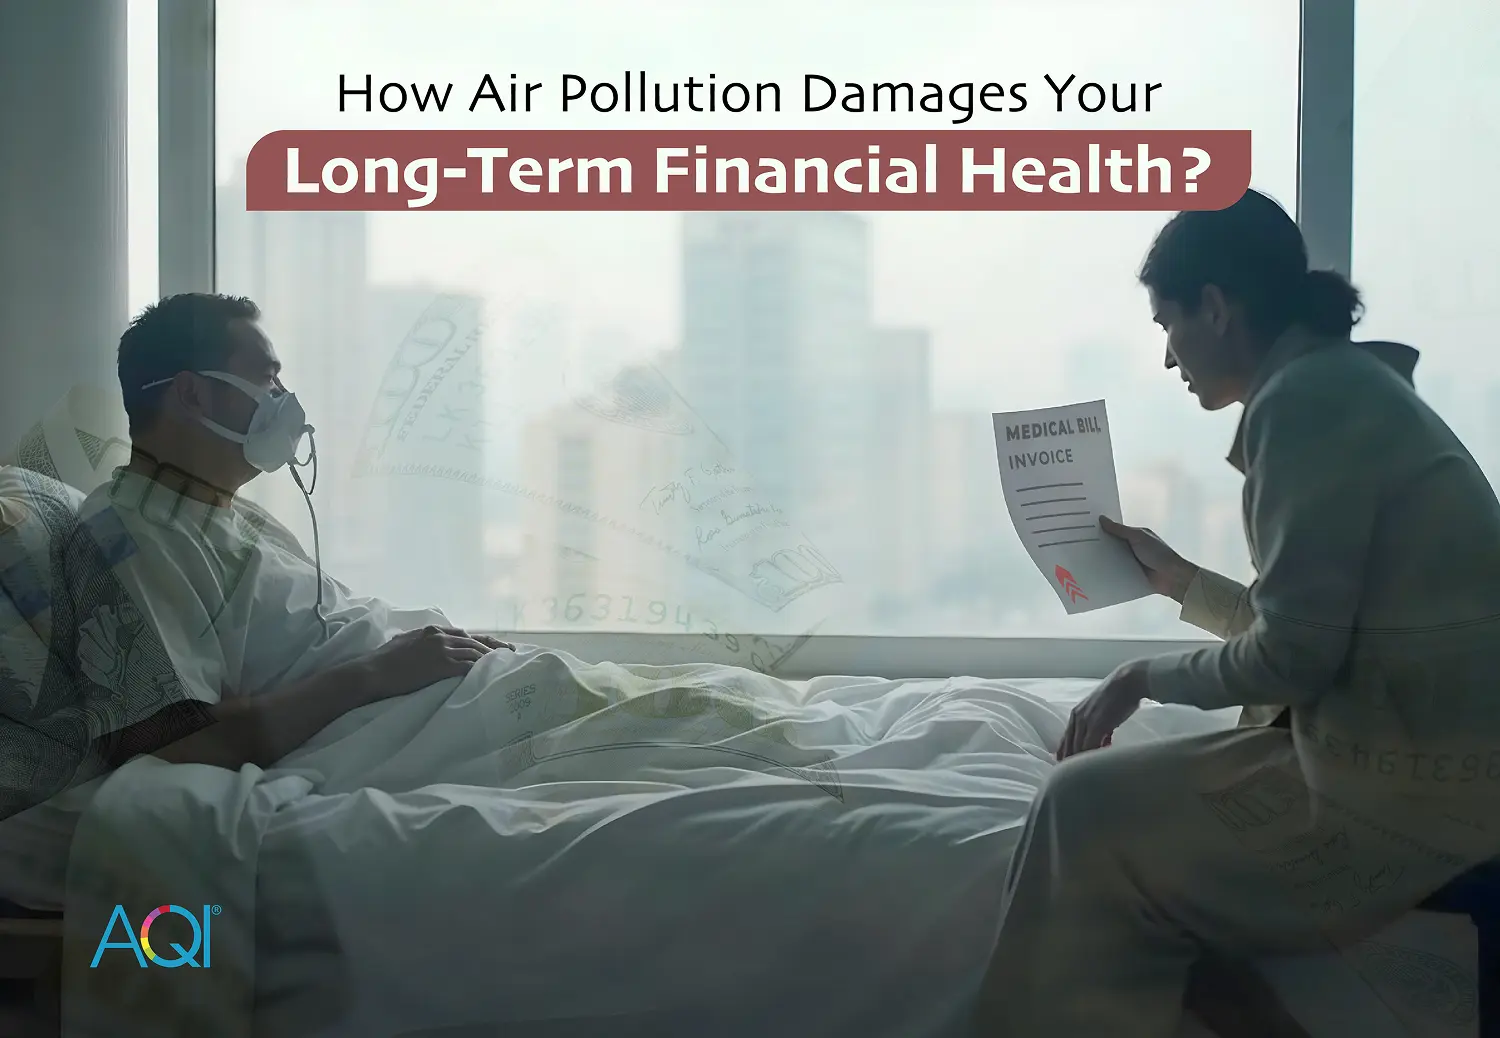
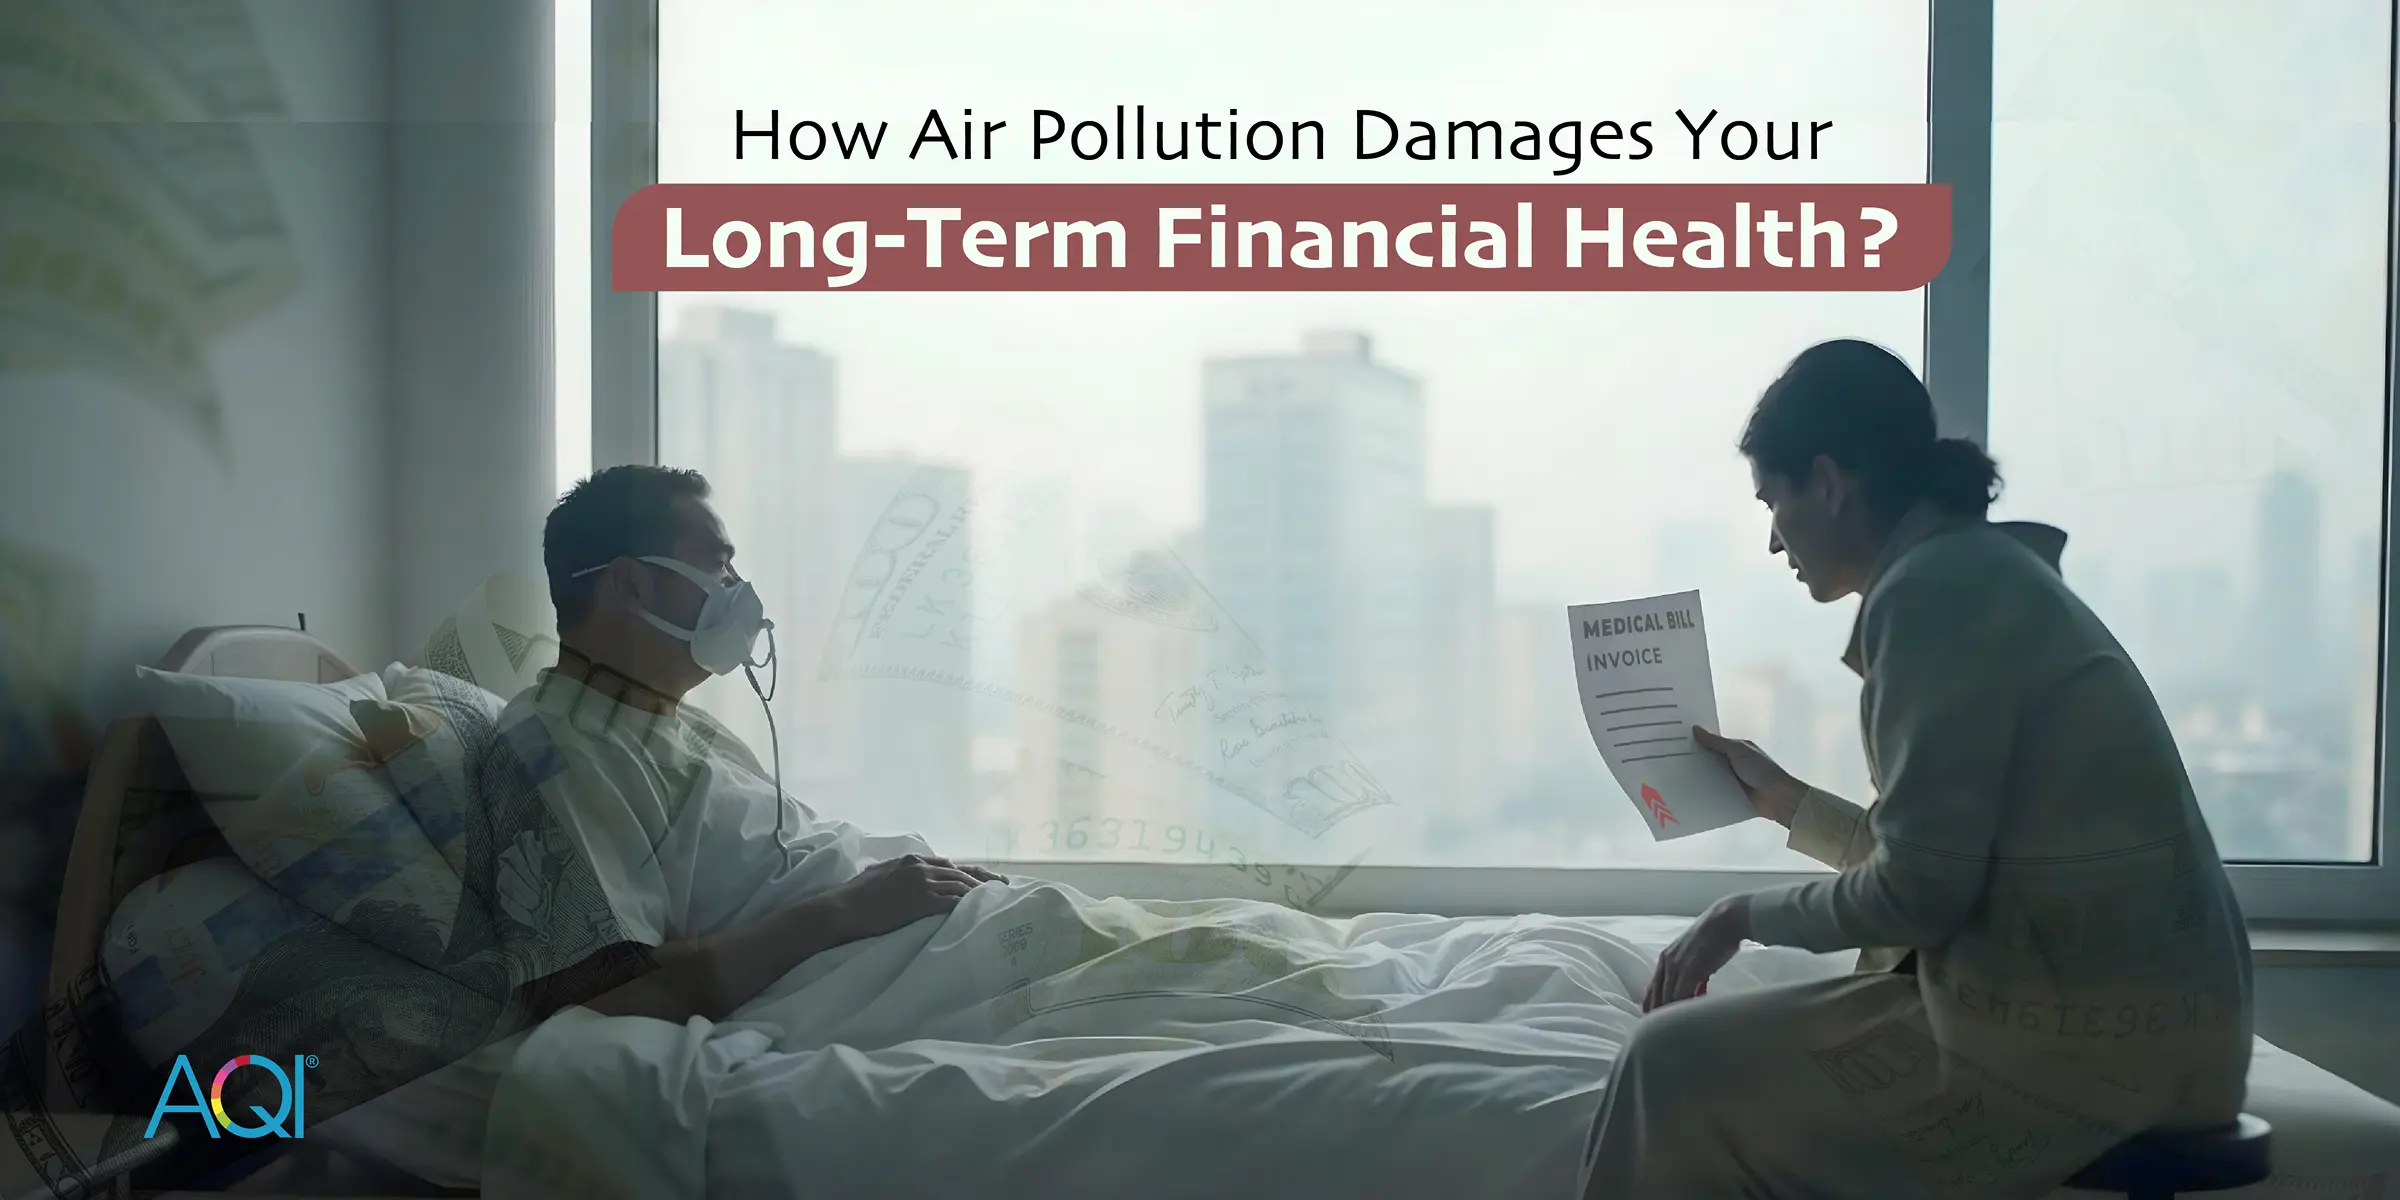
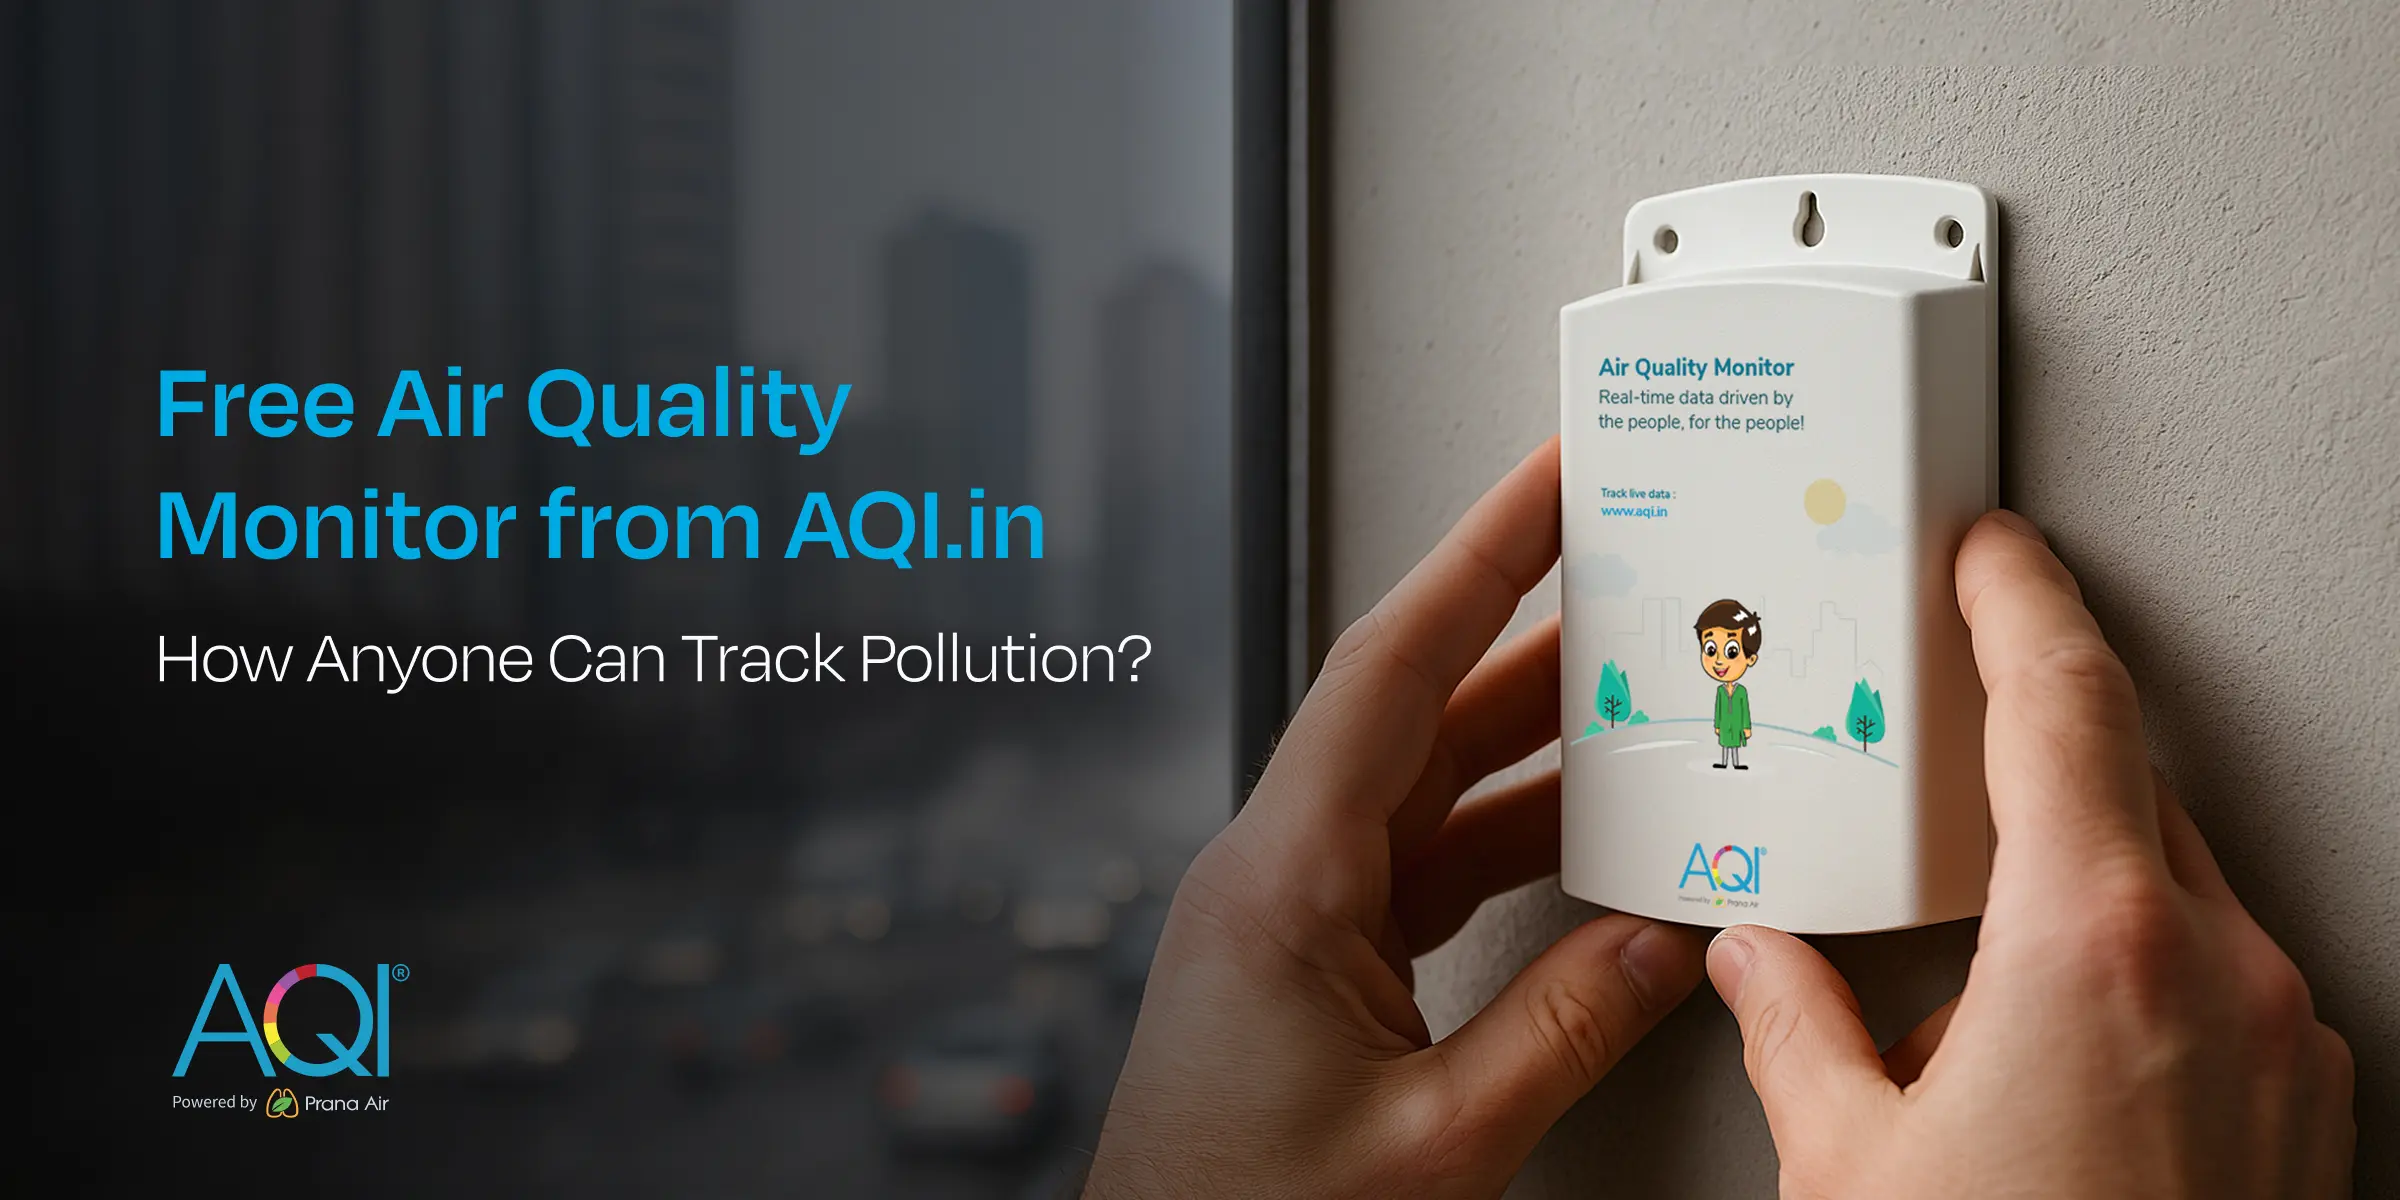
How Air Pollution Damages Your Long-Term Financial Health?
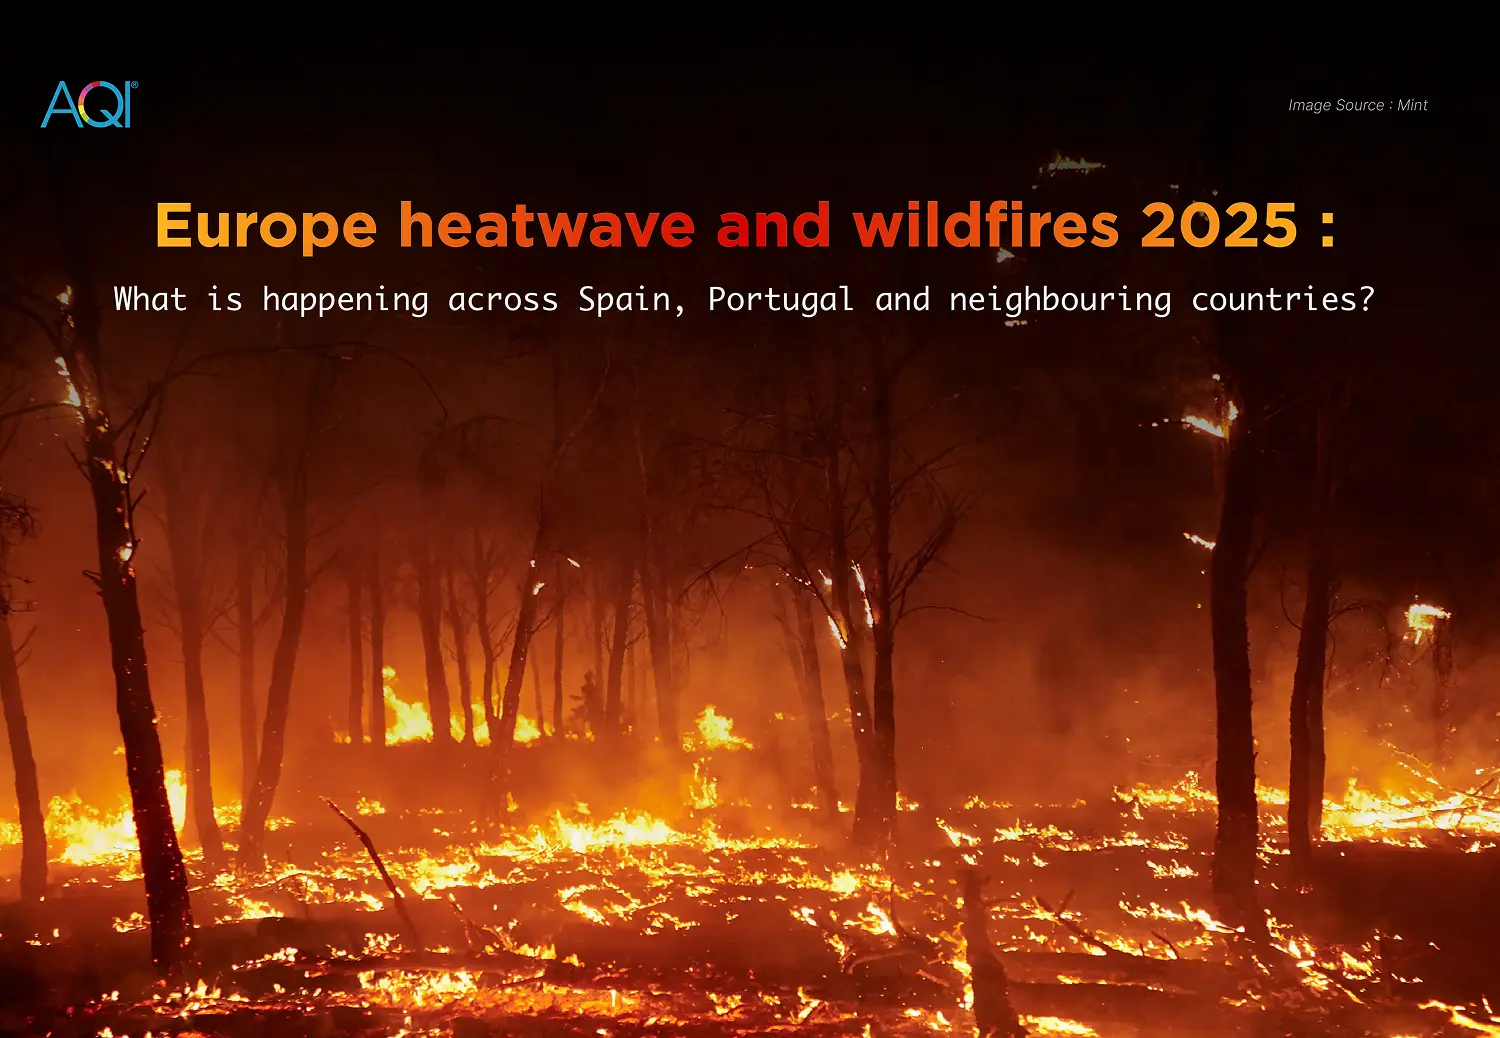
Europe heatwave and wildfires 2025: What is happening across Spain, Portugal and neighbouring countries?
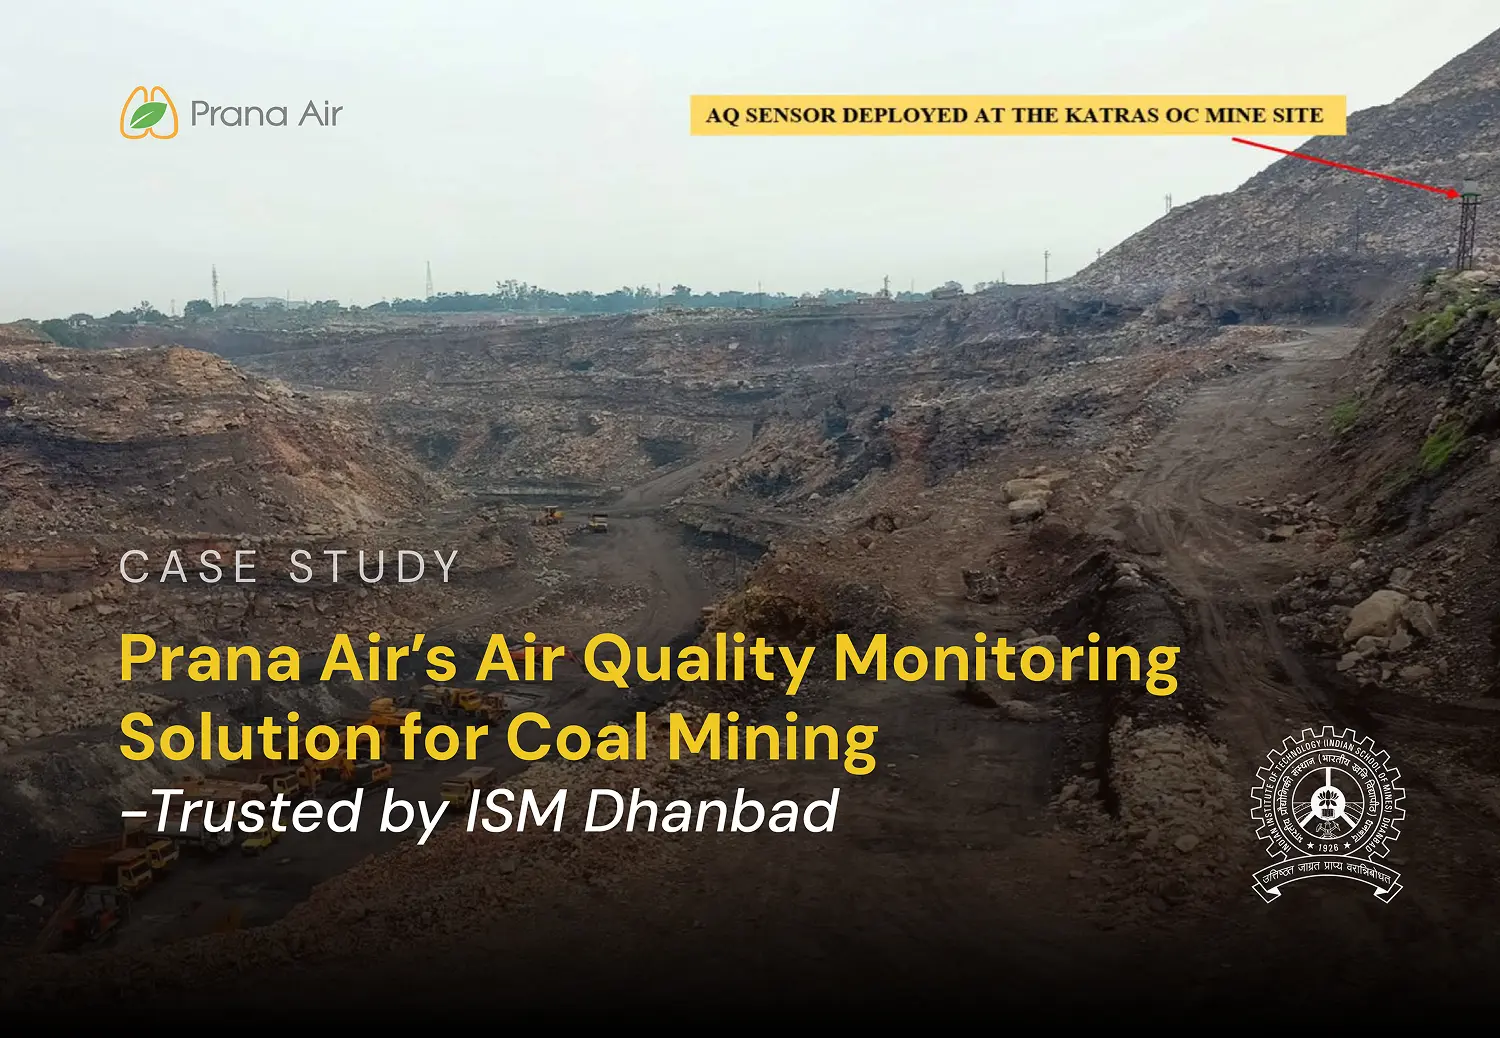
Case Study: Prana Air’s Air Quality Monitoring Solution for Coal Mining-Trusted by ISM Dhanbad

How Does the Best Air Quality Solution for Airport Improve Operations and Passenger Safety?

Biggest Wildfire in France’s History?What It Means for Air Quality, Health, and Climate
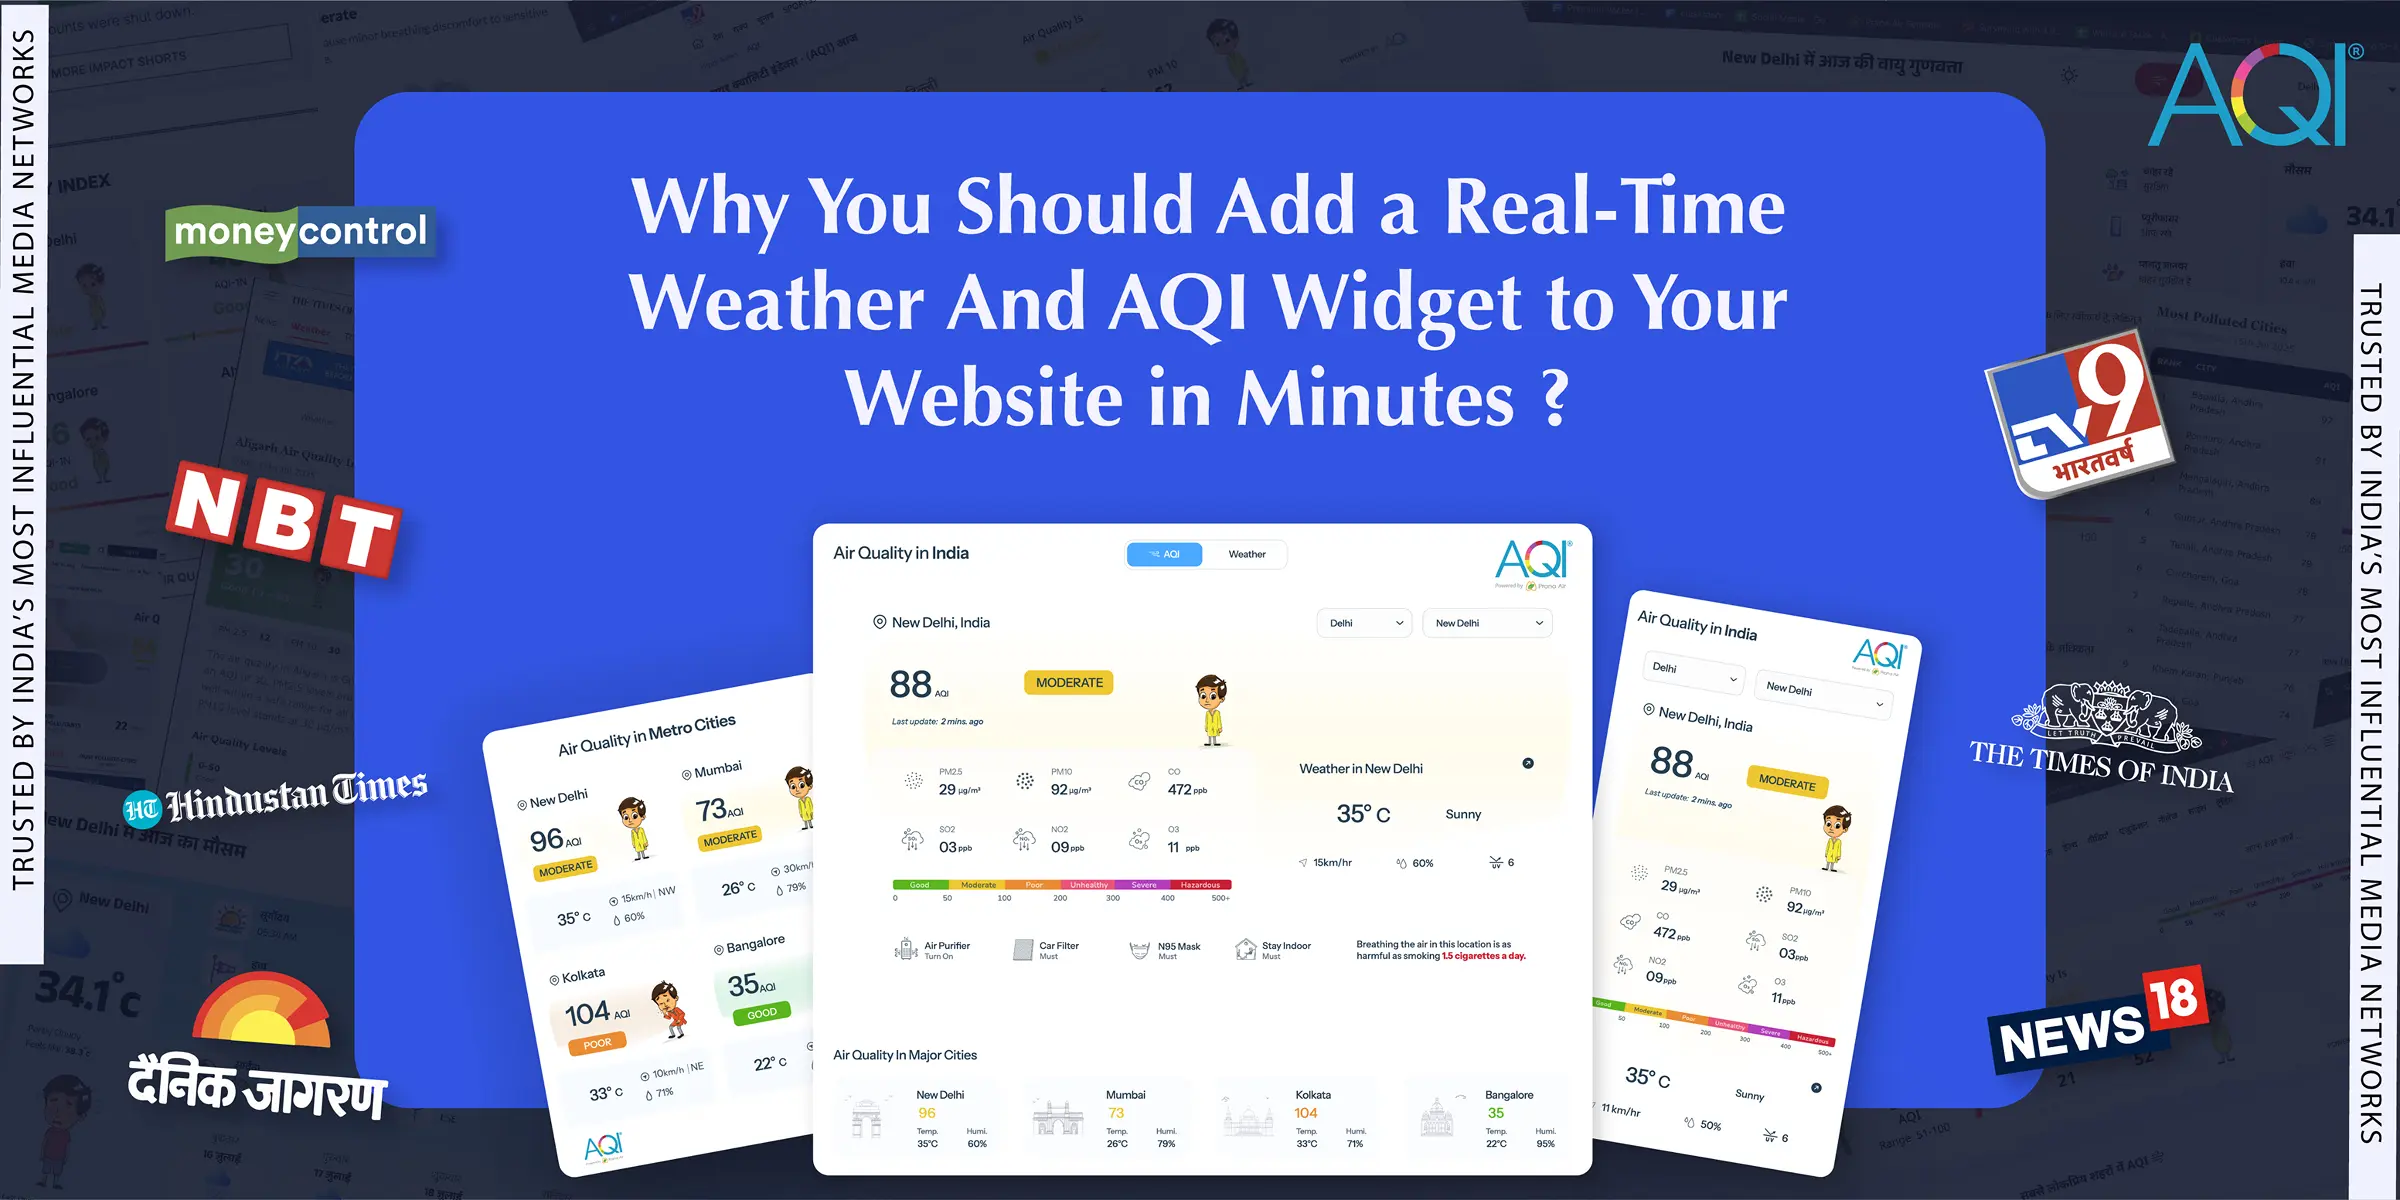
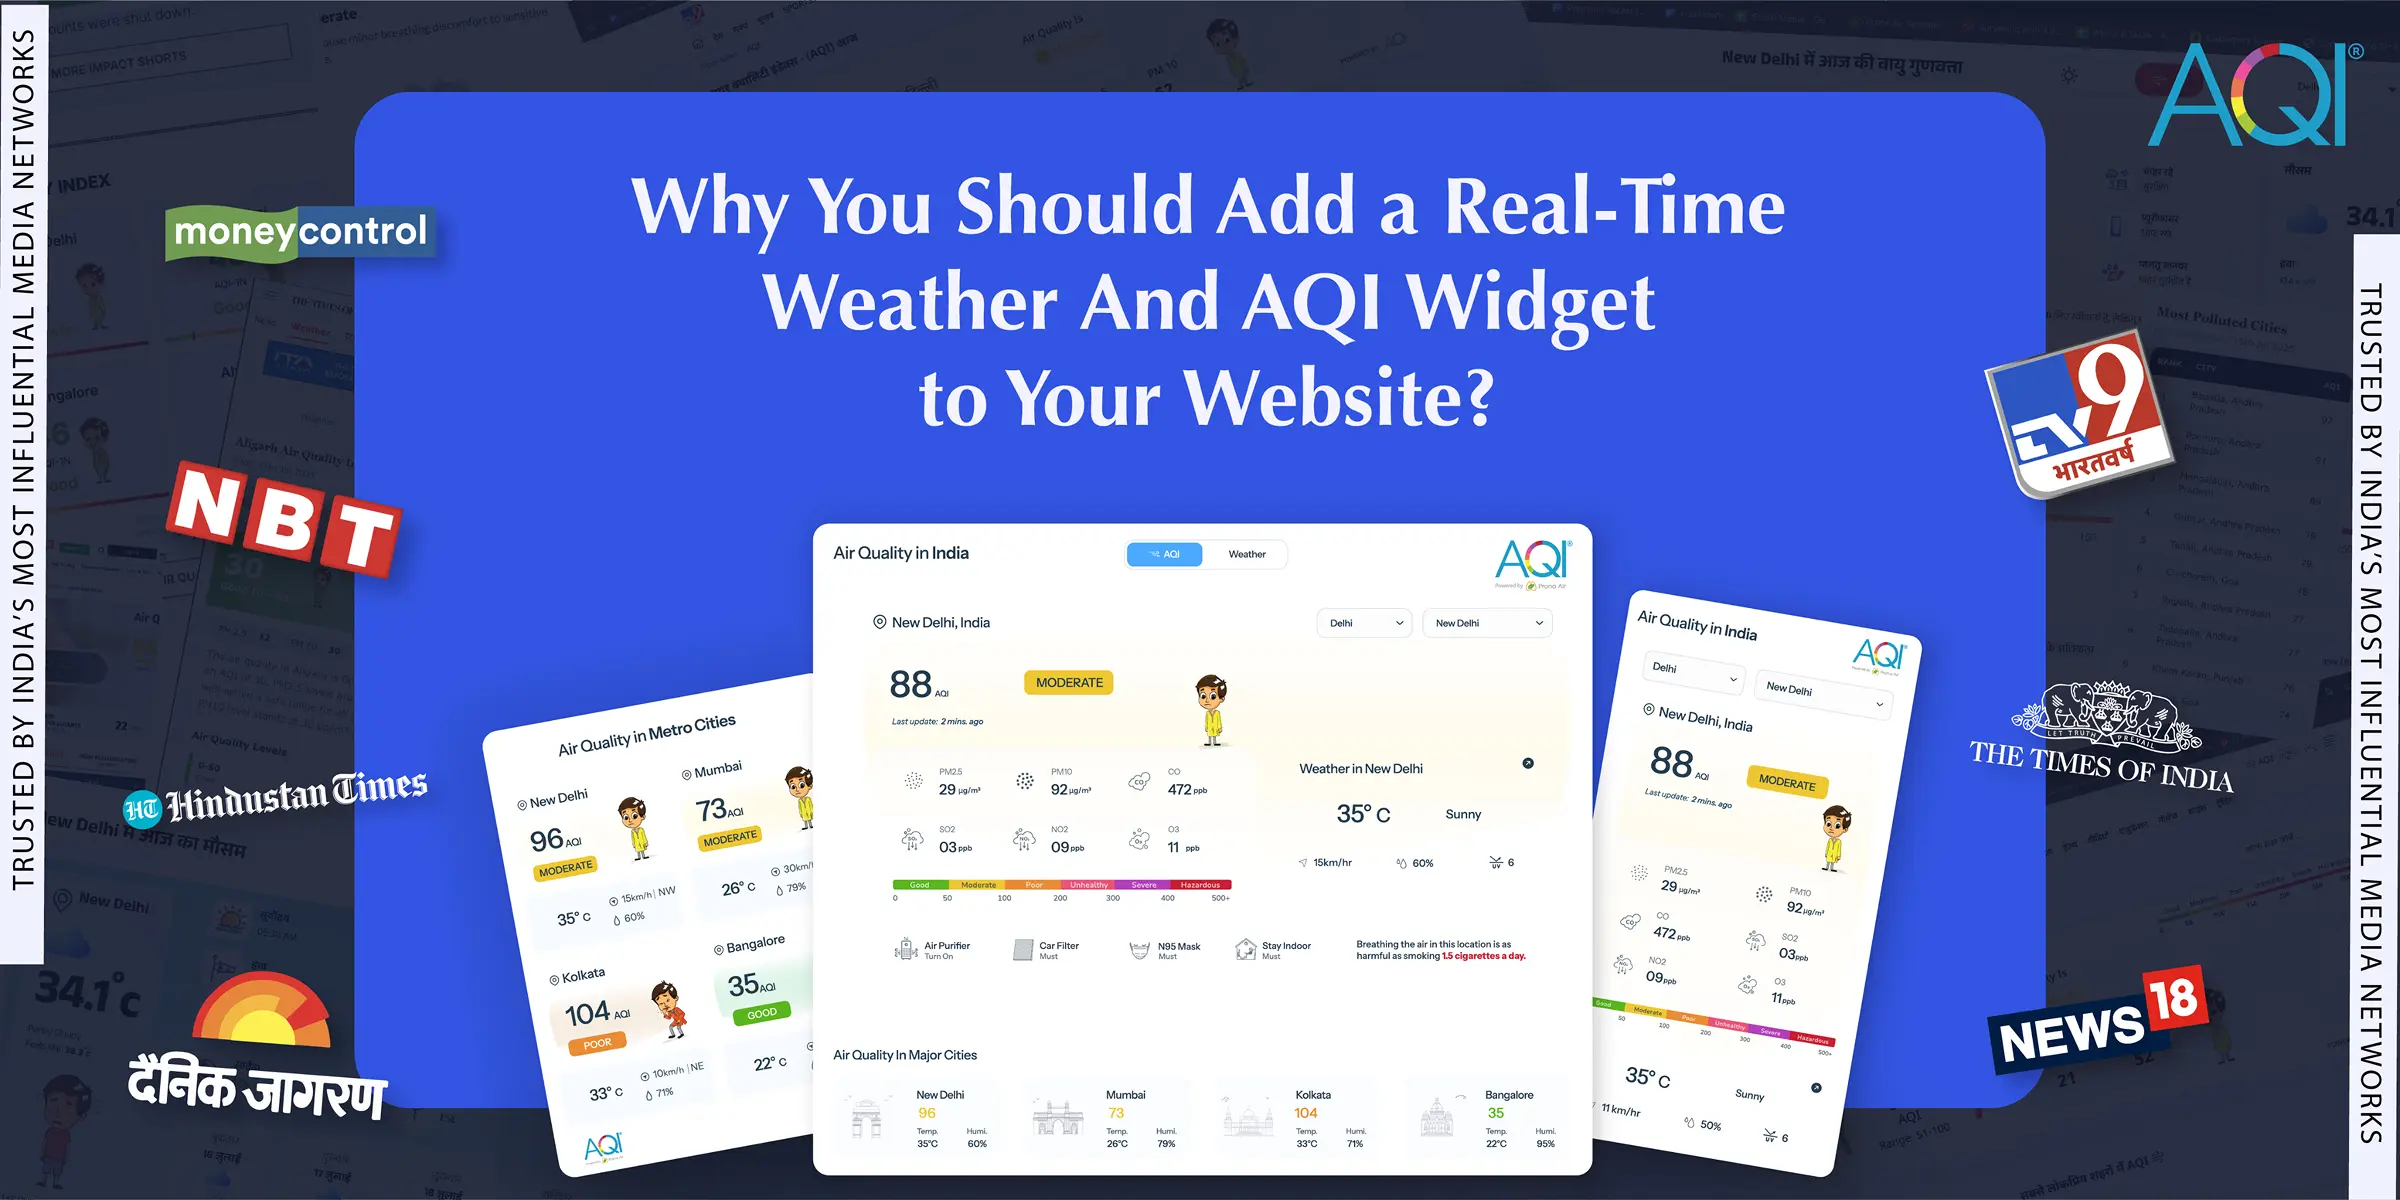
Why You Should Add a Real-Time Weather and AQI Widget to Your Website?
AQI Graph
Historical Air Quality Data
Lu Feng Shi
No Data Available
Download 2024 Annual Data
World Air Quality Report

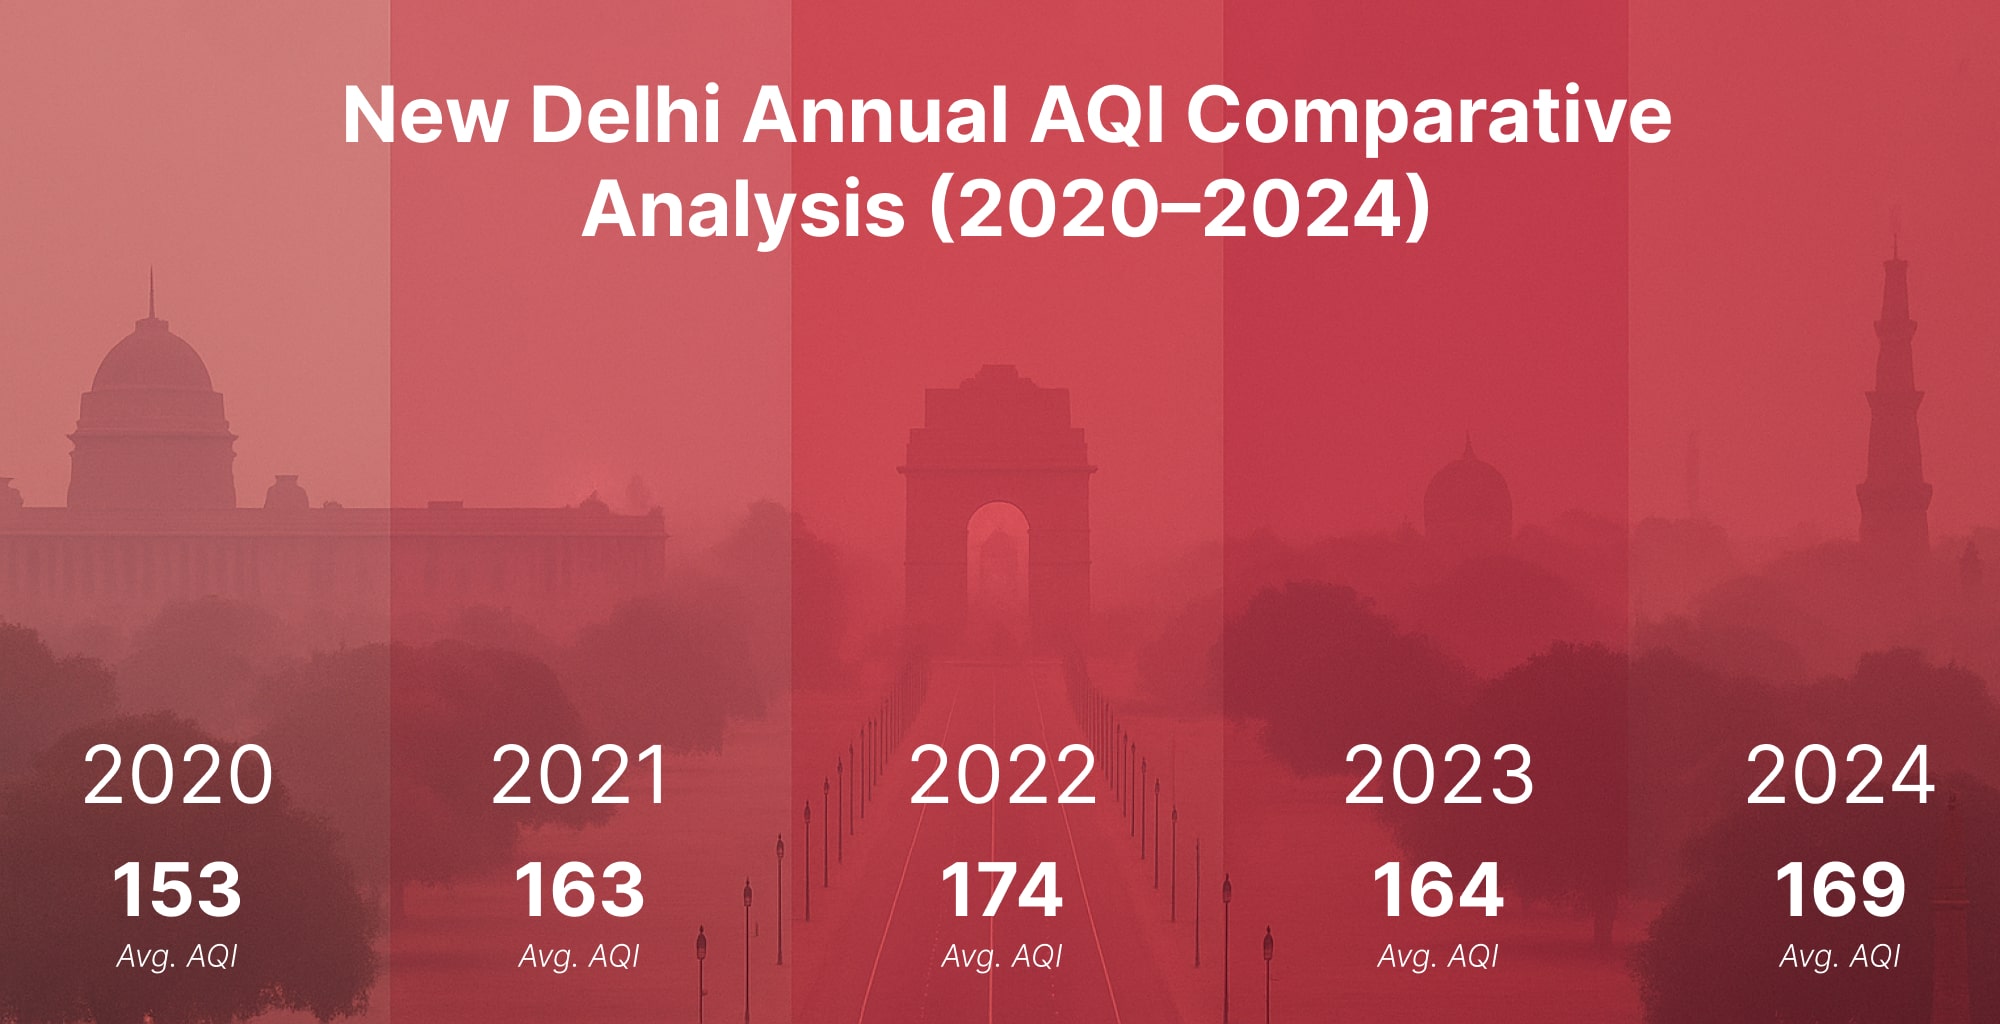
AQI Trends - Annual Air Quality Changes
Lu Feng Shi, Shan Wei Shi, Guang Dong Sheng, China
Annual AQI Trends
Most & Least Polluted Months
* This data analysis is from year 2025 - 2025
Air Quality Calendar 2025
Lu Feng Shi
Air Quality Solutions For Lu Feng Shi
Explore the solutions of air quality monitoring & clean air.
Here are some applications that you can go through to find out the solutions.


Lu Feng Shi's AQI Data Analytics Solutions
Air quality data monitoring platforms

Your area’s real-time data with detailed parameters.
Personalized health advice as per current AQI.
Analytical data to identify trends and conditions.
Connect and control your air quality devices.
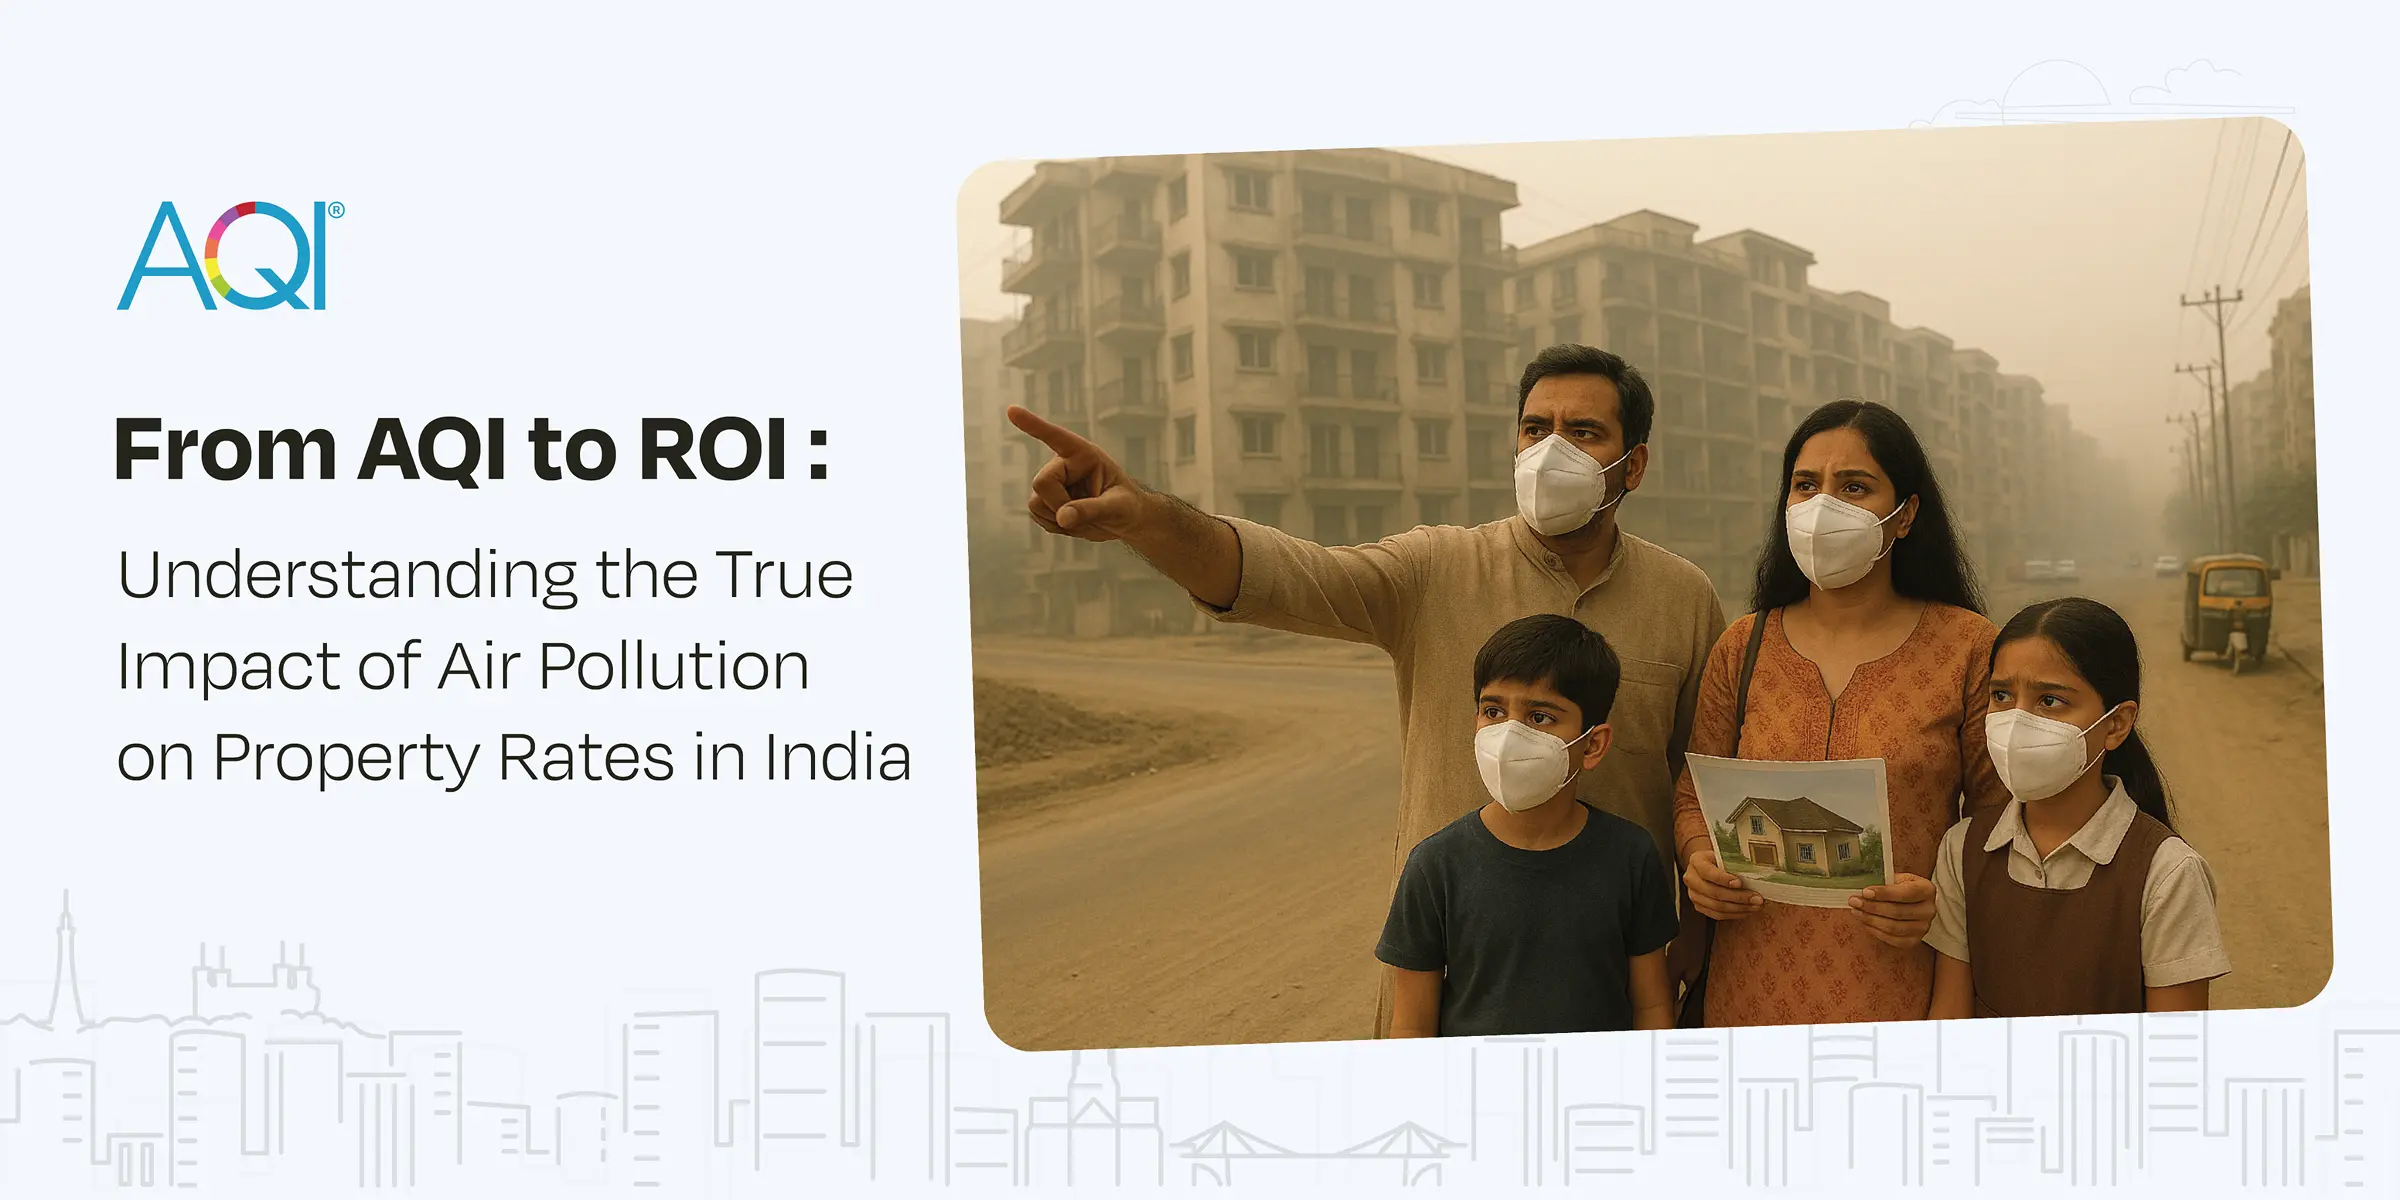
Recent AQI Blogs
Read the latest news
Here are some latest blogs that you can go through to find out more air pollution.