2024 Jahresdaten herunterladen
Weltluftqualitätsbericht

Luftqualitätsindex (AQI) Skala
Informiere dich über die Kategorie des Luftqualitätsindex (AQI), in die deine Umgebungsluft fällt, und was dies bedeutet.
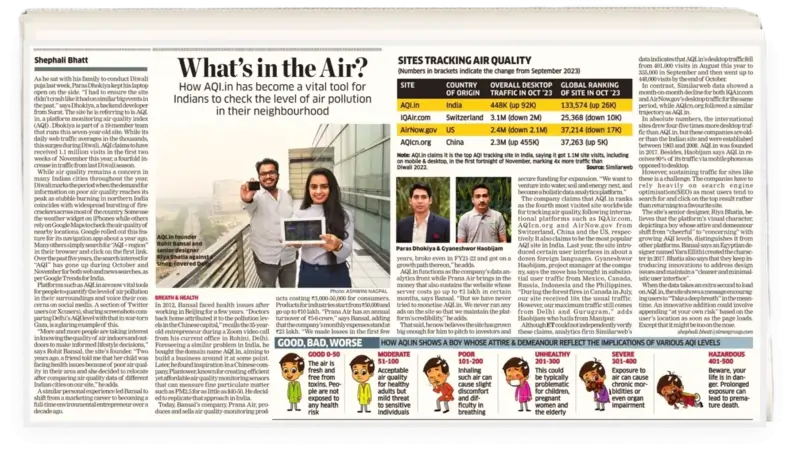
Gut(0 bis 50)
Die Luft ist frisch und frei von Toxinen. Genieße Aktivitäten im Freien ohne gesundheitliche Bedenken.

Mäßig(51 bis 100)
Die Luftqualität ist für die meisten akzeptabel, aber empfindliche Personen könnten leichte Beschwerden verspüren.

Schlecht(101 bis 150)
Das Atmen kann leicht unangenehm werden, insbesondere für Personen mit Atemwegserkrankungen.

Ungesund(151 bis 200)
Diese Luftqualität ist besonders riskant für Kinder, schwangere Frauen und ältere Menschen. Begrenze Aktivitäten im Freien.

Schwer(201 bis 300)
Langanhaltende Exposition kann chronische Gesundheitsprobleme oder Organschäden verursachen. Vermeide Aktivitäten im Freien.

Gefährlich(301+)
Gefährlich hohe Schadstoffwerte. Lebensbedrohliche Gesundheitsrisiken bei längerer Exposition. Bleibe drinnen und ergreife Vorsichtsmaßnahmen.


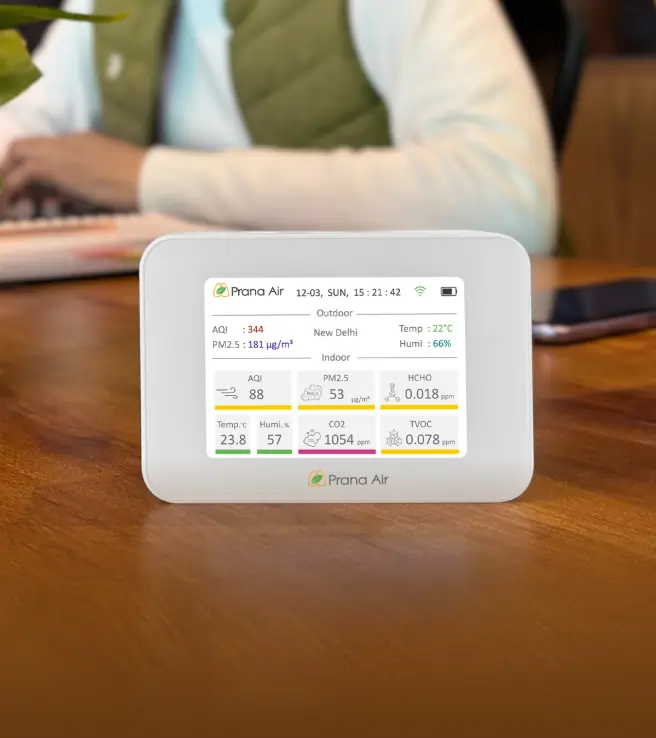
Cair +
Indoor Air Quality Monitor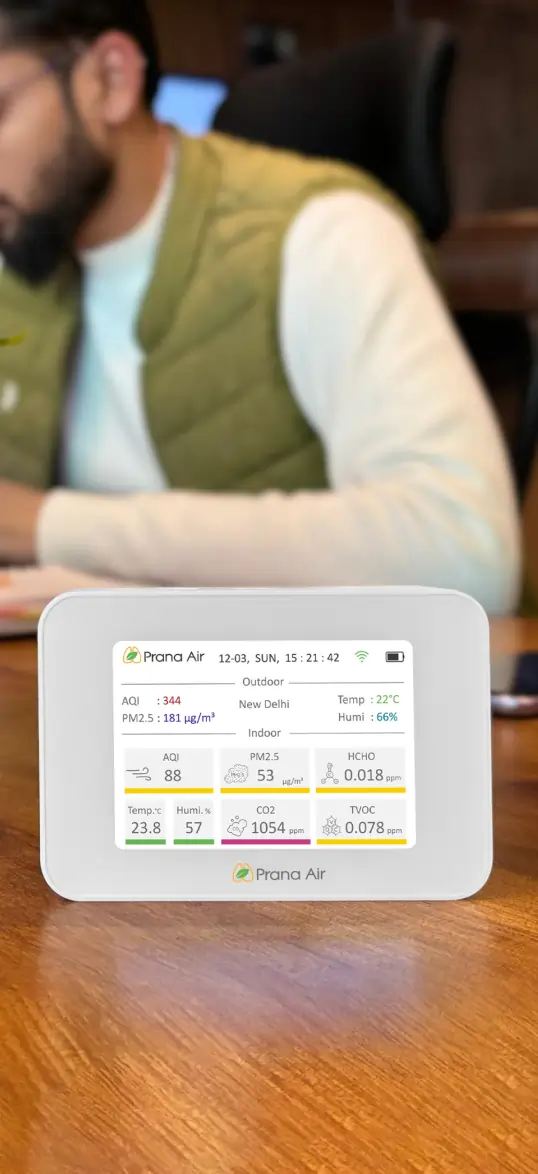
AQI-Datenanalyse-Lösungen
Plattformen zur Überwachung von Luftqualitätsdaten

Ermöglichen Sie fundierte Entscheidungen mit zuverlässigen Daten
Echtzeitdaten für Ihre Region mit detaillierten Parametern.
Personalisierte Gesundheitstipps basierend auf dem aktuellen AQI.
Analytische Daten zur Identifizierung von Trends und Bedingungen.
Verbinden und Steuern Sie Ihre Luftqualitätsgeräte.
Lösungen zur Luftqualität
Entdecken Sie die Lösungen zur Überwachung der Luftqualität und für saubere Luft.
Hier sind einige Anwendungen, die Sie durchsehen können, um die Lösungen zu finden.


Aktuelle AQI-Blogs
Lesen Sie die neuesten Nachrichten
Hier sind einige aktuelle Blogs, die Sie durchsehen können, um mehr über Luftverschmutzung zu erfahren.


Medienberichterstattung
AQI wurde in den Medien für sein bemerkenswertes Wachstum und Innovation vorgestellt

Vertraut von
Einige der besten Organisationen der Branche


Luftqualität weltweit
Echtzeit-Luftqualitätsüberwachung weltweit.
