Study on PM (Particulate Matter) concentration for last three consecutive years on Diwali in Delhi.
Key points:
- Basis: PM (Particulate Matter) levels during Diwali
- Years compared: 2020, 2021, 2022
Summary:
According to data reported by www.aqi.in , 4 studies were conducted for particulate matter (PM) data that was monitored during Diwali for three years in a row. The study was conducted for the years 2020, 2021, and 2022, for 24 hours, 12PM (Diwali noon) to 12PM (next day from Diwali).
- The first study is based on the comparison of PM levels during Diwali night for the above mentioned 3 years.
- The second study is based on the PM levels on 24th October, to monitor the PM levels on the same day as this year’s Diwali.
- Third study is based on the Zone-wise PM concentration of Delhi on 24th October 2022.
- The fourth study aims to provide an overview of top worst cities affected by PM pollution on Diwali.
The study will provide the data analysis and comparison on various aspects that affected the PM levels over years and PM concentration trends.
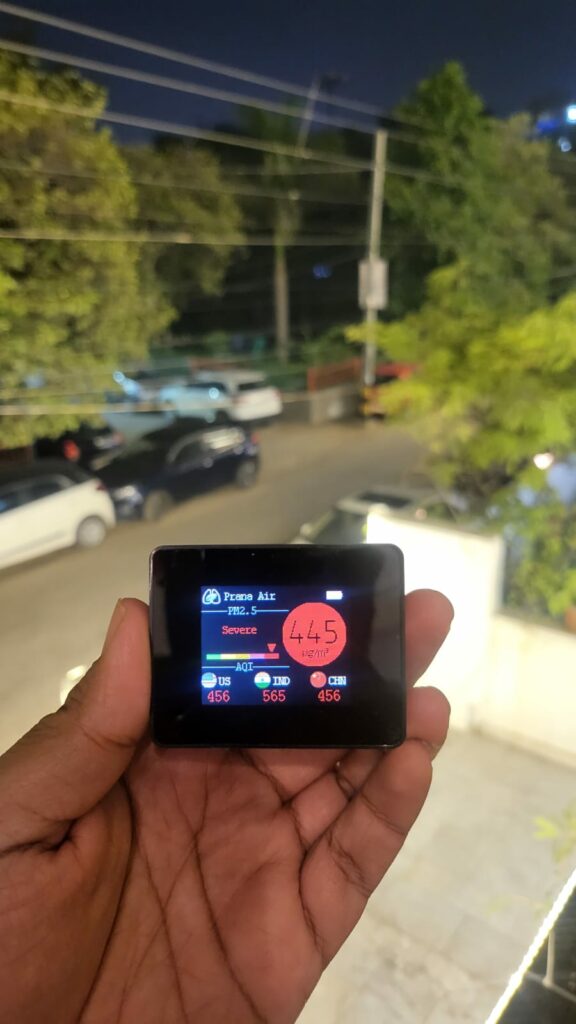
PM2.5 – Diwali Midnight 2022
Particulate Matter Levels and what do they say?
PM is measured in µg/m3
Good : 0-30
Moderate : 31-60
Poor : 61-90
Unhealthy : 91-120
Severe : 121-250
Hazardous : 250+
Particulate matter is released while combustion of fossil fuels, firecracker burning, vehicle emissions, and many more. There is a rise in other air pollution parameters including VOCs, that deteriorates the air quality including various meteorological conditions, like weather, wind speed, rainfall, etc. The release of particles into the air reduces the visibility, leading to formation of smog. As a result, it has serious health effects on the health when inhaled, and results in various road accidents due to the reduced visibility.
WHO Guidelines for Particle pollution
Fine particulate matter (PM2.5)
5 μg/m3 annual mean
15 μg/m3 24-hour mean
Coarse particulate matter (PM10)
15 μg/m3 annual mean
45 μg/m3 24-hour mean
Observation of the AQI Report 2022
1. Delhi PM levels during Diwali night for 2020, 2021, and 2022
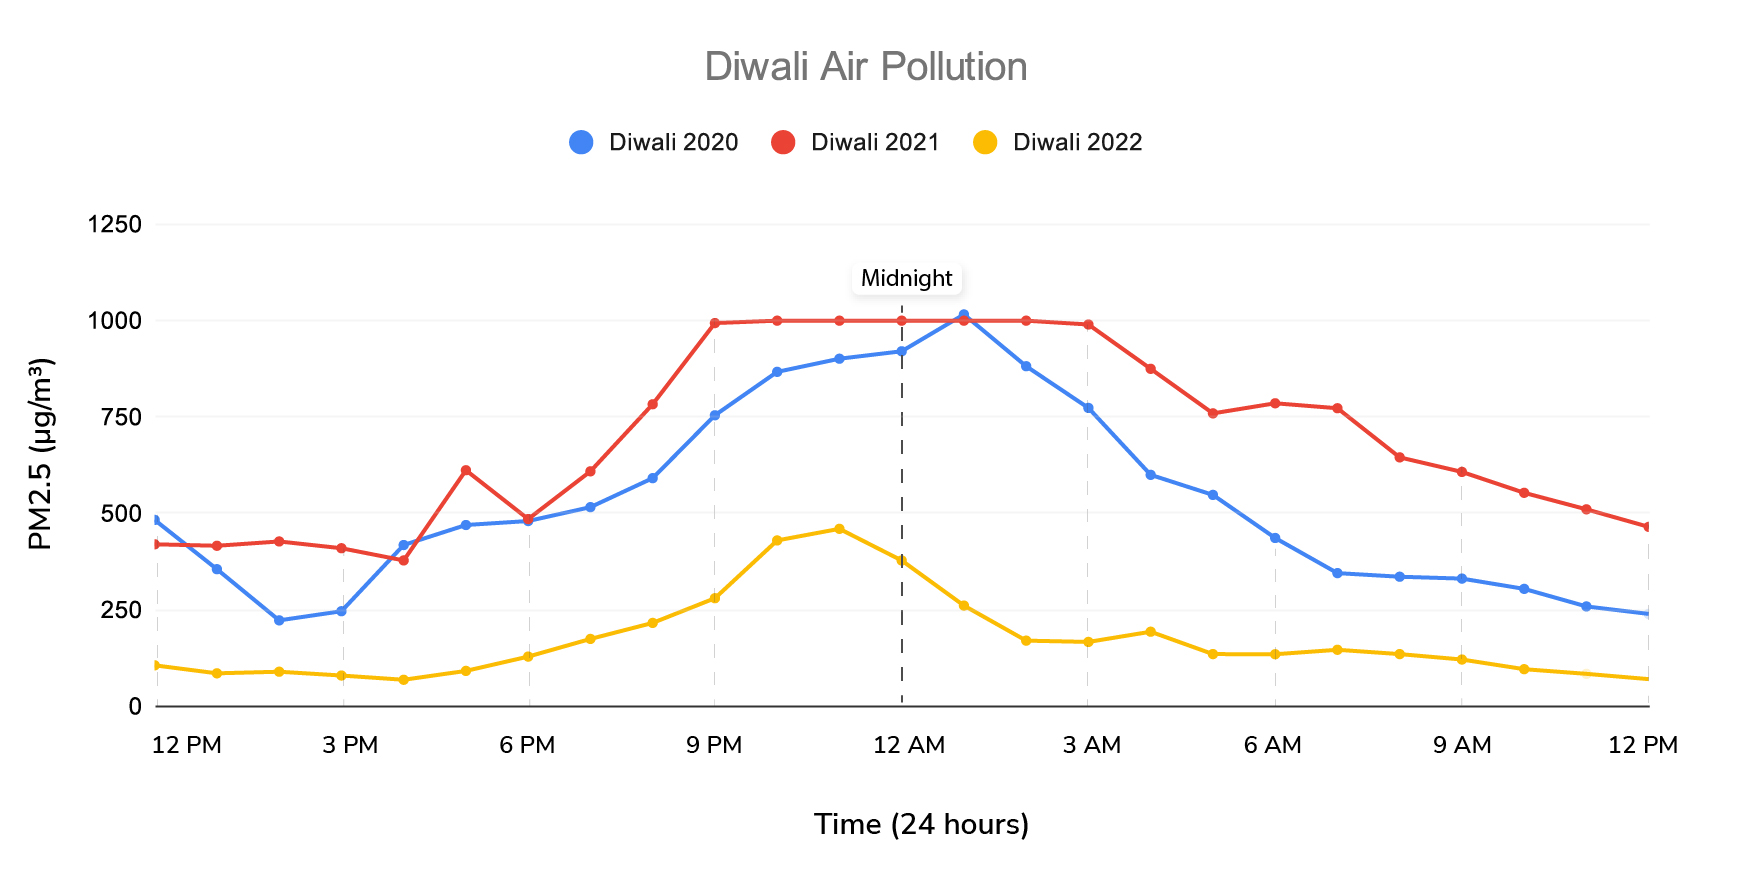
Fig. 1
As observed in the graph, the PM levels were the worst in 2021 (1AM, 1016.163μg/m3), followed by 2020 Diwali, and the least emissions were observed in the year 2022. The study point started at midday on Diwali and went on till the next day till 12PM. There is a substantial decrease in PM emissions this year.
The levels were expected to touch the hazardous levels, but the conditions improved this year. The reason behind the improved PM levels are the wind patterns and the warm weather.
In accordance with AQI India standards of 24-hour mean, i.e. 30μg/m3 , the PM levels during Diwali were
- 24th Nov, 2020: 532.16μg/m3, that is 17.7x times more than the expected levels.
- 4th Nov, 2021: 700.184μg/m3 , that is 23.3x times more than the expected levels.
- 24th Nov, 2022: 172.47μg/m3, that is 5.7x times more than the expected levels.
– The above data is measured as per Indian PM level standards.
2. Delhi PM levels on 24th October 2020, 2021, and 2022
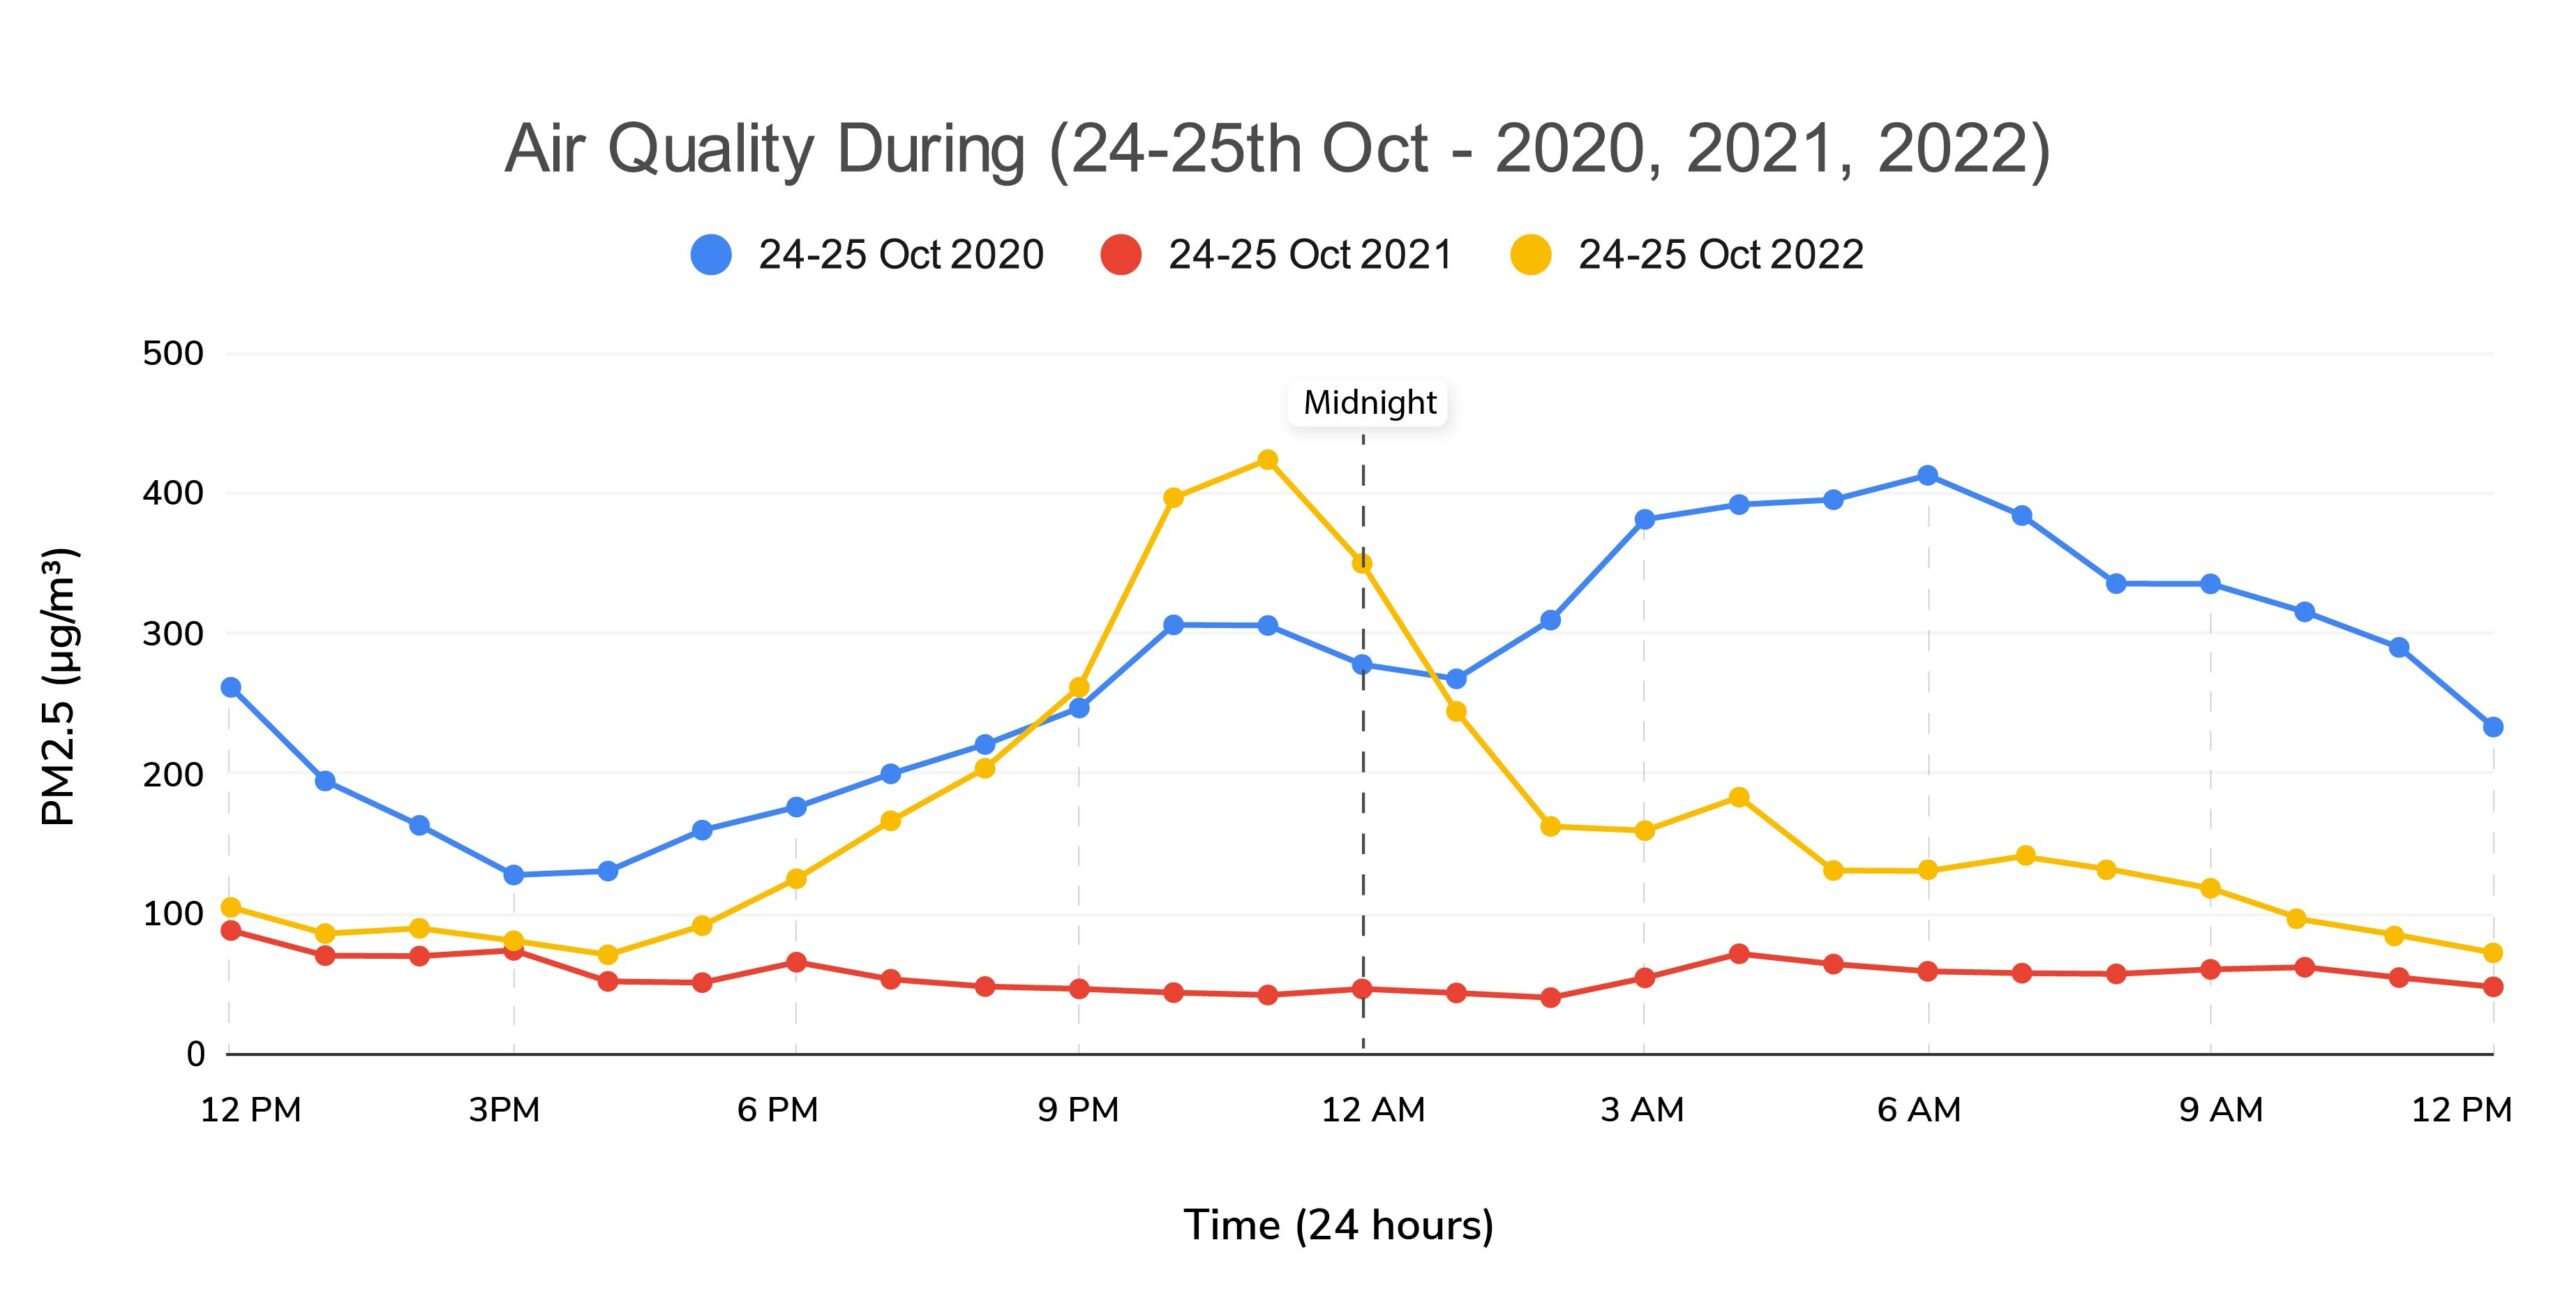
Fig. 2
The data monitored and displayed here is of the same day, i.e. 24th October. The 24 hour data represents the PM levels on 24th October for the three different years. It is observed that:
2020: The rise in PM levels was observed around 5PM, again piqued at 11 PM, and further reached the highest at 6AM the next day.
2021: Surprisingly the PM levels remained around the good to moderate category throughout the whole 24 hour timespan.
2022: PM levels started to rise from 5PM, reached its peak at 11PM (460.33) and started falling down. The peak time was observed as the increased amount of Diwali firecracker emissions. It again increased between 3-5AM the next day and then a gradual fall in the PM levels were observed.
3. Zone-wise PM concentration of Delhi on 24th October 2022
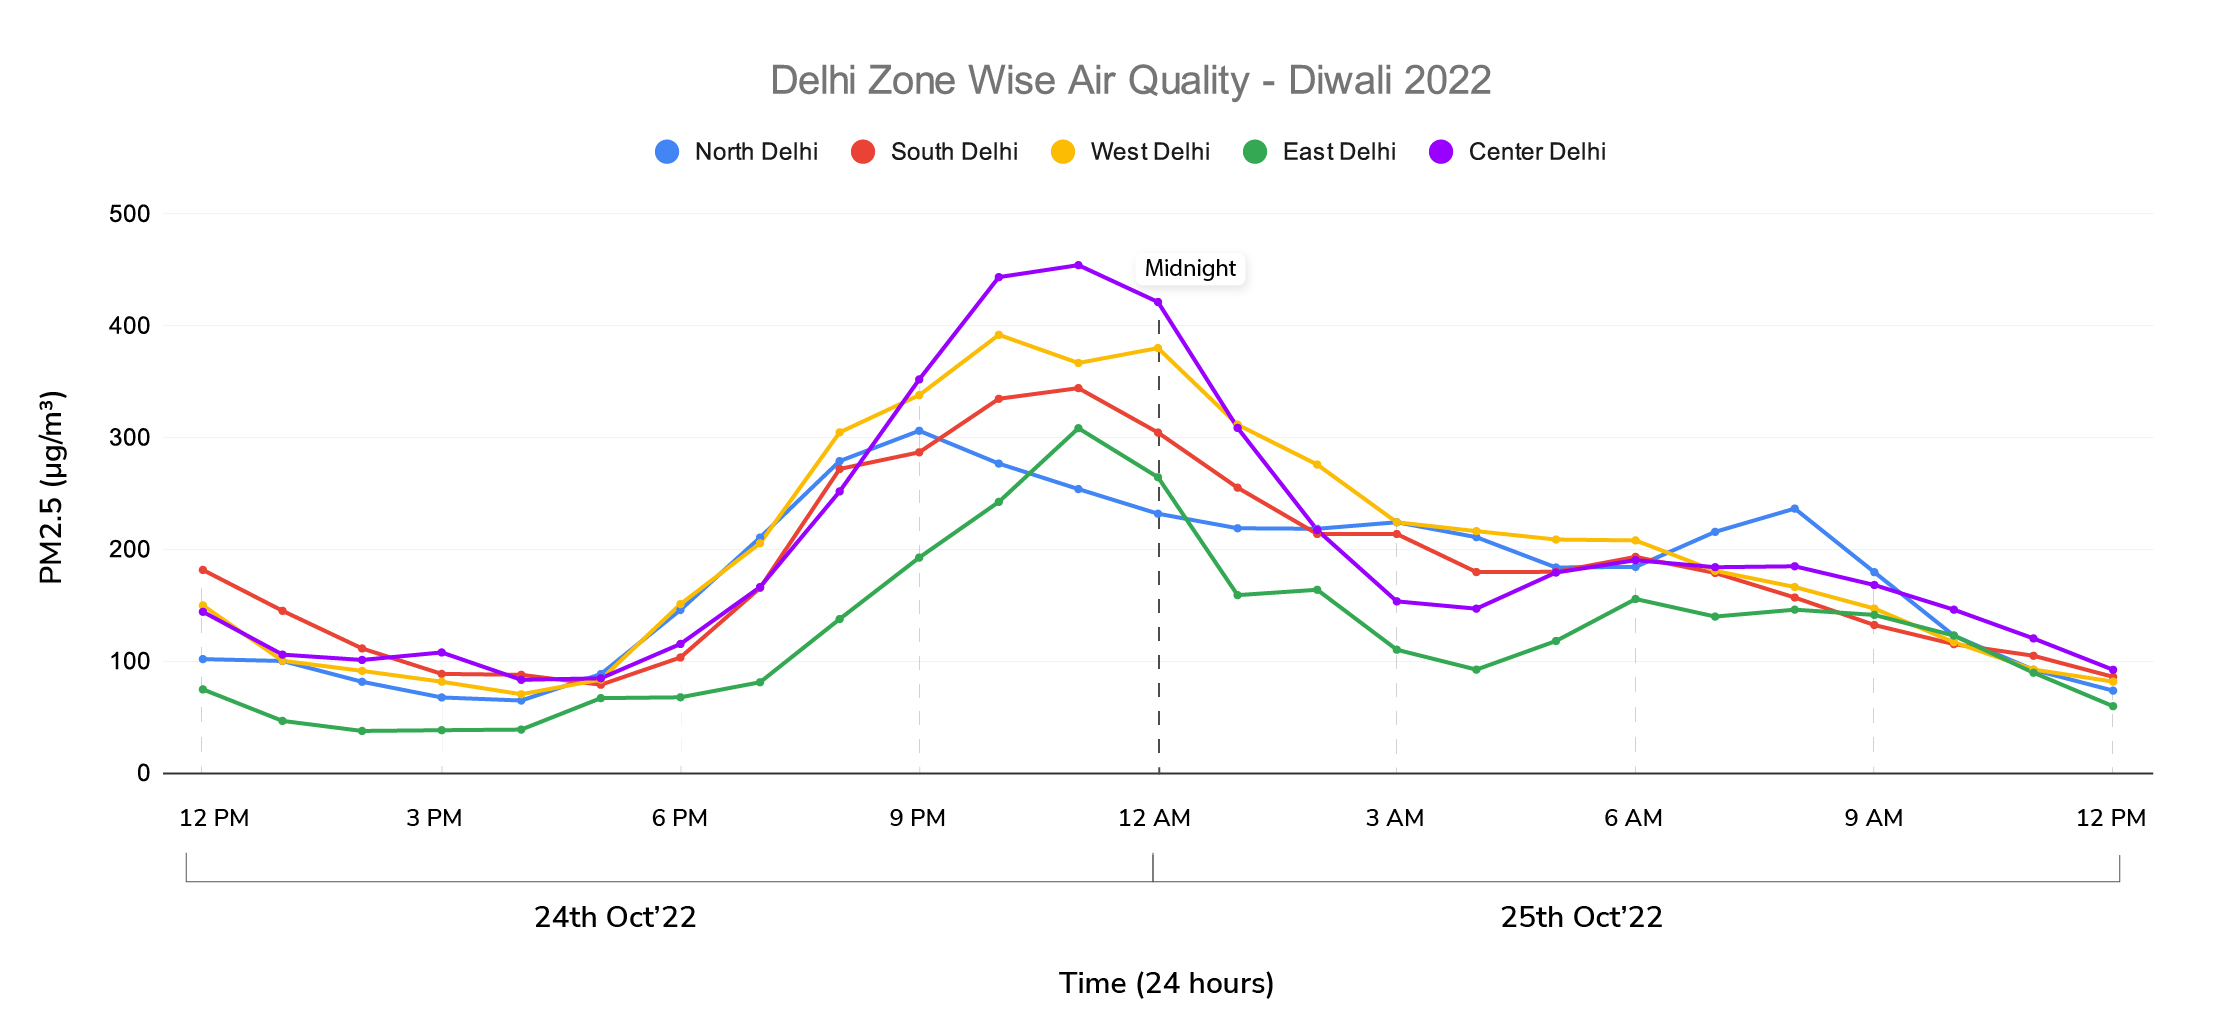
Fig. 3
Four key areas were observed and compared, East Delhi, North Delhi, West Delhi, South Delhi, and Centre Delhi for 24th October. Highest PM concentration measured was in Central Delhi, peak time being 11PM (454.05μg/m3). Followed by West Delhi, where peak time was around 10PM (337.783μg/m3) and 12AM (379.883μg/m3). Next comes in South Delhi, observing the peak PM levels around 11PM (344.067μg/m3). East and North Delhi were at the lowest, having peak time 11PM (308.227μg/m3) and 9PM (305.933μg/m3) respectively.
4. Diwali Air Quality in Metro Cities of India
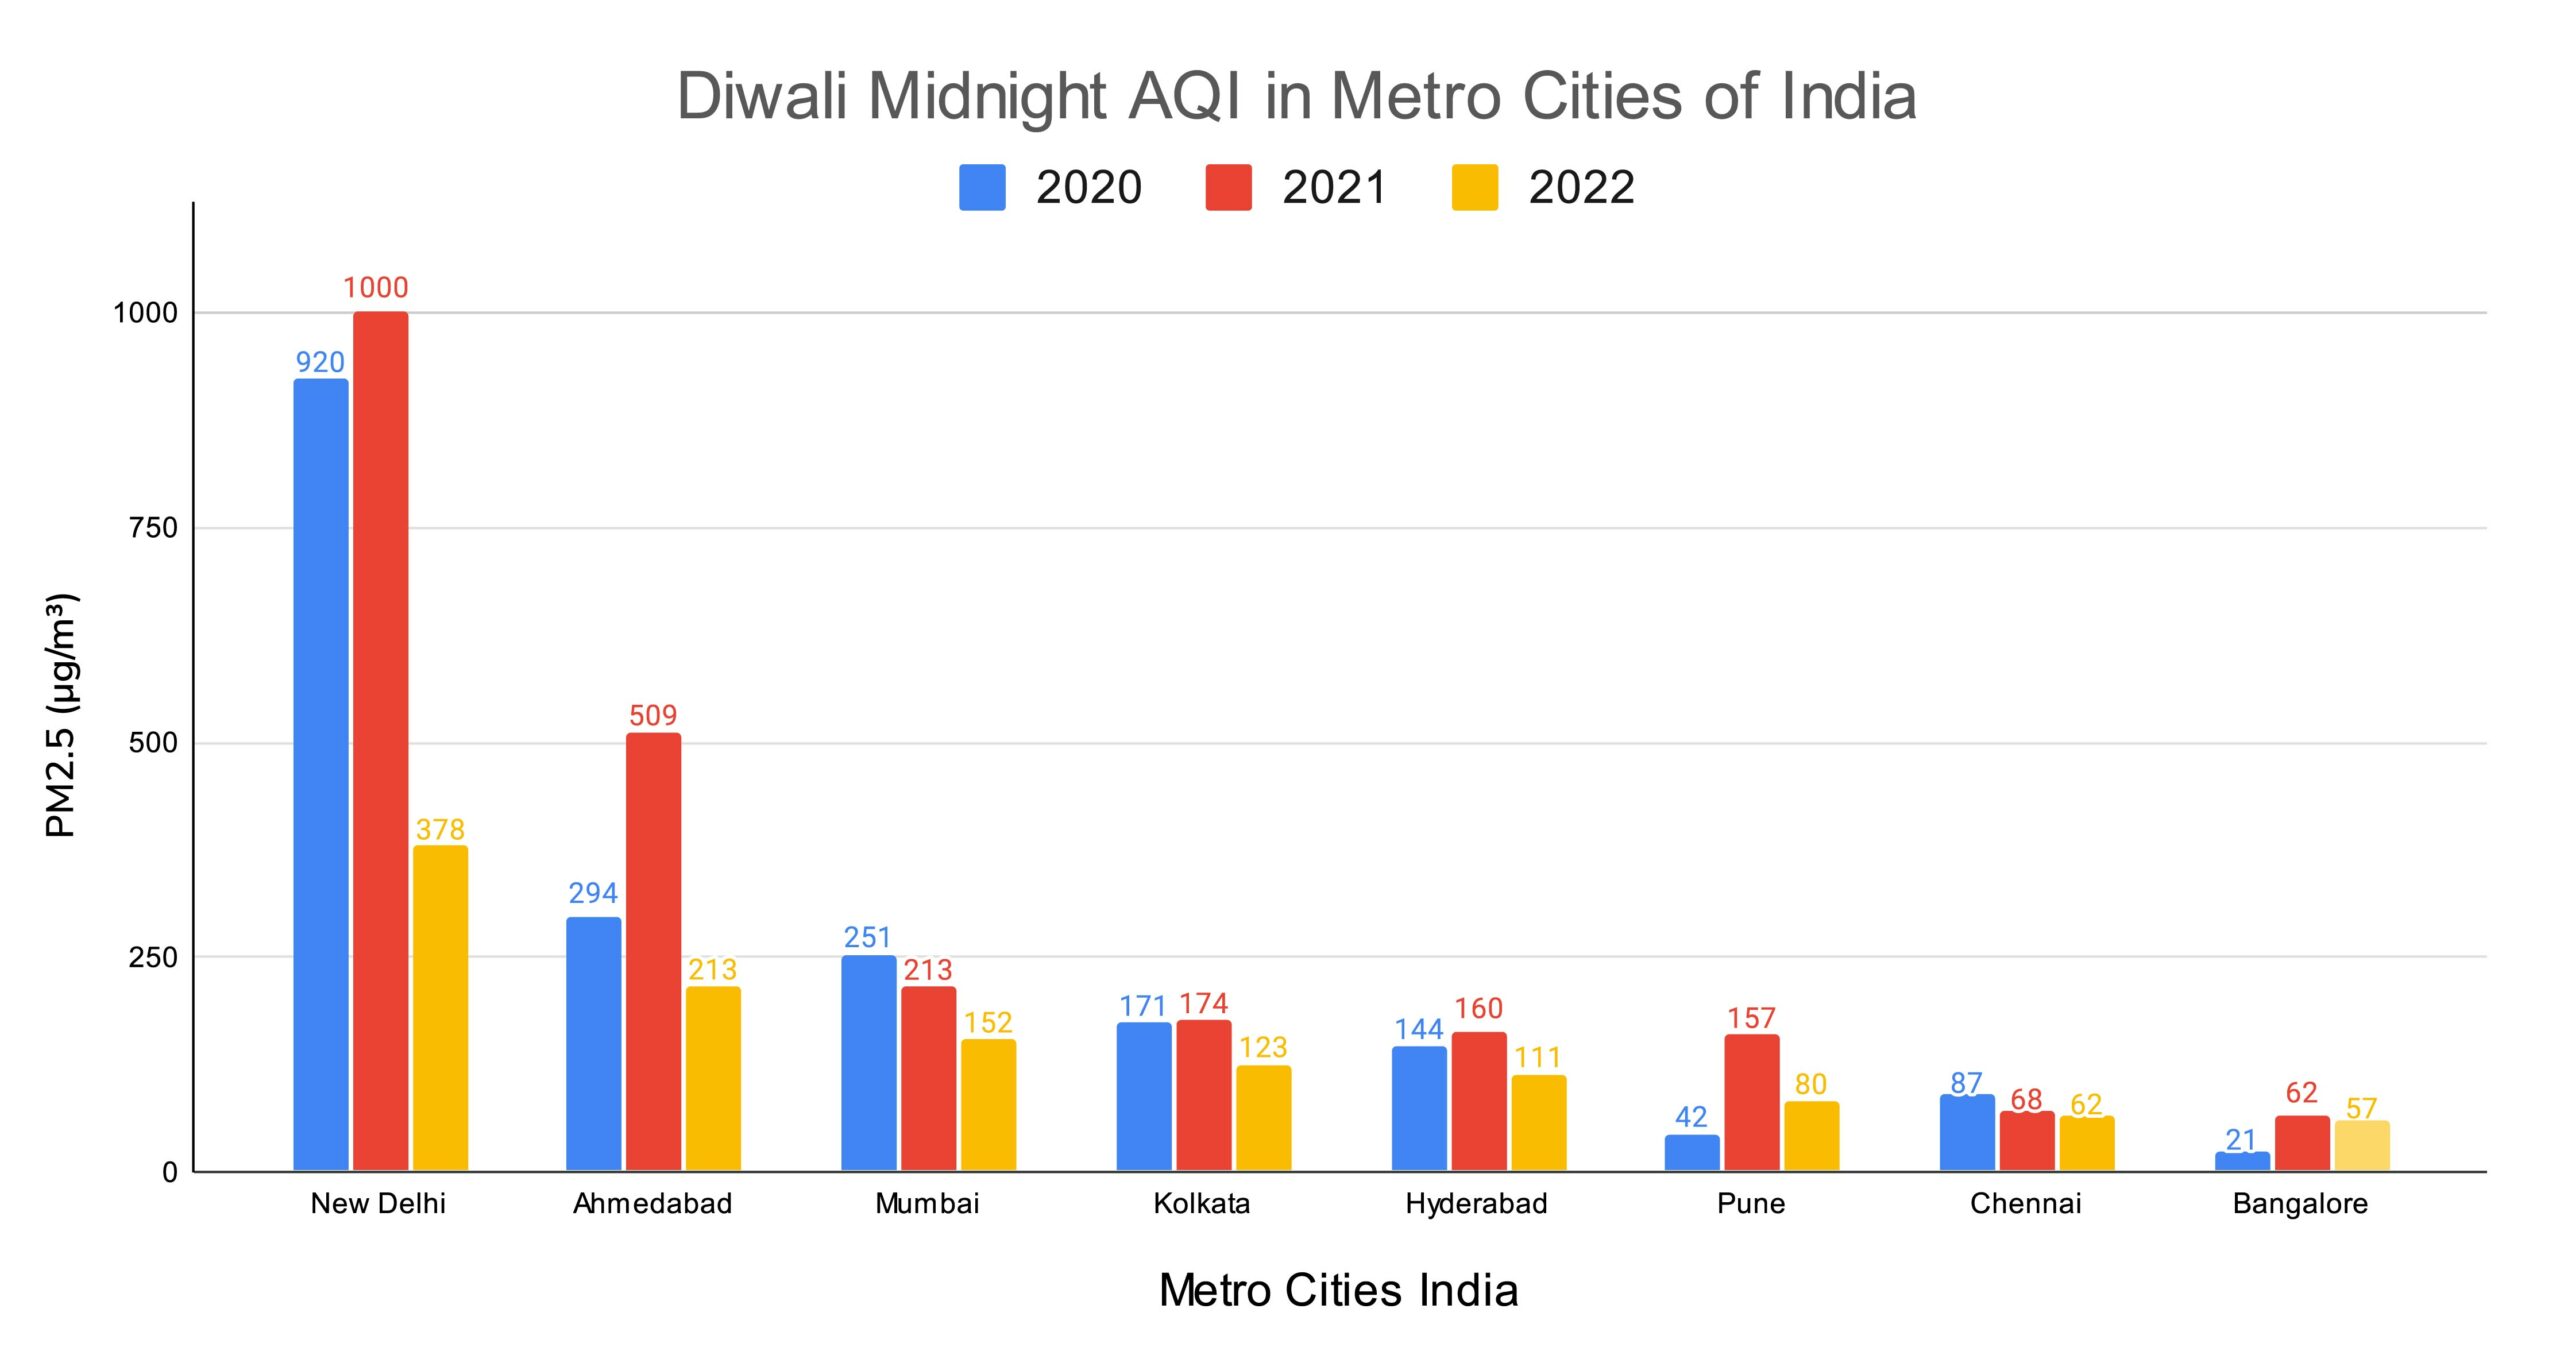
Fig. 4
This data represents the data of PM levels monitored during Diwali midnight of 8 metropolitan cities of India, for three consecutive years (2020, 2021, and 2022). The year 2021 is observed to have higher PM concentration among almost all the cities, with Delhi being on the top. The PM levels have improved this year for New Delhi, Ahmedabad, Mumbai, Kolkata, Hyderabad, and Chennai. Whereas, PM levels for Pune and Bangalore were lesser as compared to the previous year, i.e. 2021, but the levels are more as compared to 2020.
This post is also available in:
![]() Global
Global ![]() IND English
IND English ![]() UK English
UK English ![]() US English
US English