Keningau Air Quality Index (AQI) | Air Pollution
Real-time PM2.5, PM10 air pollution level in Kota Kinabalu
Last Updated: 06 Aug 2025, 07:24am (Local Time)


20 °C
Light rain showerKeningau
Trending in Malaysia
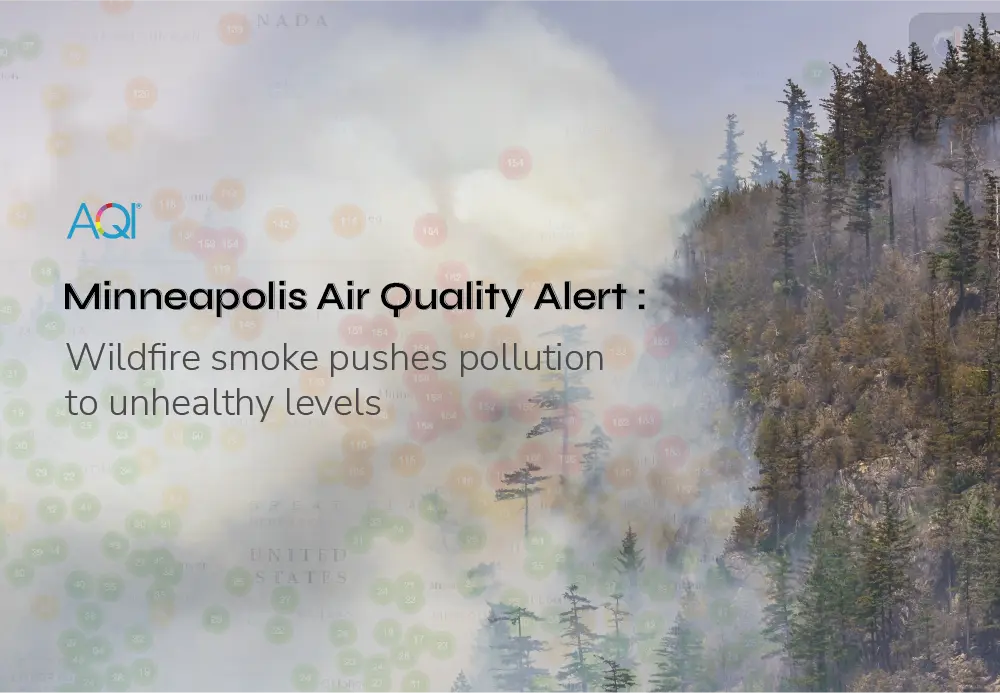
Minneapolis Air Quality Alert: Wildfire Smoke Pushes Pollution to Unhealthy Levels
AQI.IN's Community Air Quality Monitoring Get a Free AQI Monitor by Joining AQI.IN's Community Initiative.
Free Air Quality Monitor from AQI.in: How Anyone Can Track Pollution?
AQI Graph
Historical Air Quality Data
Keningau
No Data Available
Download 2024 Annual Data
World Air Quality Report

AQI Trends - Annual Air Quality Changes
Keningau, Kota Kinabalu, Sabah, Malaysia
Annual AQI Trends
Most & Least Polluted Months
* This data analysis is from year 2020 - 2025
Air Quality Calendar 2025
Keningau
Air Quality Solutions For Keningau
Explore the solutions of air quality monitoring & clean air.
Here are some applications that you can go through to find out the solutions.


Keningau's AQI Data Analytics Solutions
Air quality data monitoring platforms

Your area’s real-time data with detailed parameters.
Personalized health advice as per current AQI.
Analytical data to identify trends and conditions.
Connect and control your air quality devices.
Recent AQI Blogs
Read the latest news
Here are some latest blogs that you can go through to find out more air pollution.