


Thank You Air Quality Index (AQI) | Air Pollution
Real-time PM2.5, PM10 air pollution level in Springs
Last Updated: 2026-08-16 02:41 (Local Time)



7 °C
Clear

Currently, Springs ranks 85th among the most polluted cities globally.
 Map
MapThank You
AQI Graph
Historical Air Quality Data
Thank You
AQI (US) Trends - Annual Air Quality Changes
Thank You, Springs, Gauteng, South Africa
South Africa's Metro Cities
Air Quality Index


Air Quality Calendar 2026
Thank You
Health Advice For People Living In
Thank You
1.2Cigarettes per day

Breathing the air in this location is as harmful as smoking 1.2 cigarettes a day.
Source:
Berkeley Earth
Solutions for Current AQI (US)


Prevent Health Problems: Understand Your Risks
Thank You
 Asthma
 Heart Issues
 Allergies
 Sinus
Sinus Cold/Flu
 Chronic (COPD)


Most Polluted Cities 2026
South Africa
Analyze the real-time most air polluted cities in the country.
Standard Value
1.
Paarl, Western Cape
Poor
3xabove Standard
2.
Vanderbijlpark, Gauteng
Poor
3xabove Standard
3.
Brits, North West
Poor
3xabove Standard
4.
Gqeberha, Eastern Cape
Poor
2xabove Standard
5.
Springs, Gauteng
Poor
3xabove Standard
6.
Centurion, Gauteng
Moderate
2xabove Standard
7.
Port Elizabeth, Eastern Cape
Moderate
2xabove Standard
8.
Pretoria, Gauteng
Moderate
2xabove Standard
9.
Standerton, Mpumalanga
Moderate
2xabove Standard
10.
Klerksdorp, North West
Moderate
2xabove Standard
Last Updated: 16 Aug 2026, 12:46 AM
AQI City RankingsAir Quality Solutions For Thank You
Explore the solutions of air quality monitoring & clean air.
Here are some applications that you can go through to find out the solutions.
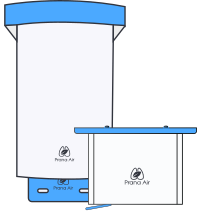
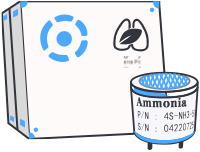
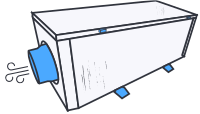


Thank You's AQI Data Analytics Solutions
Air quality data monitoring platforms
 Mobile App
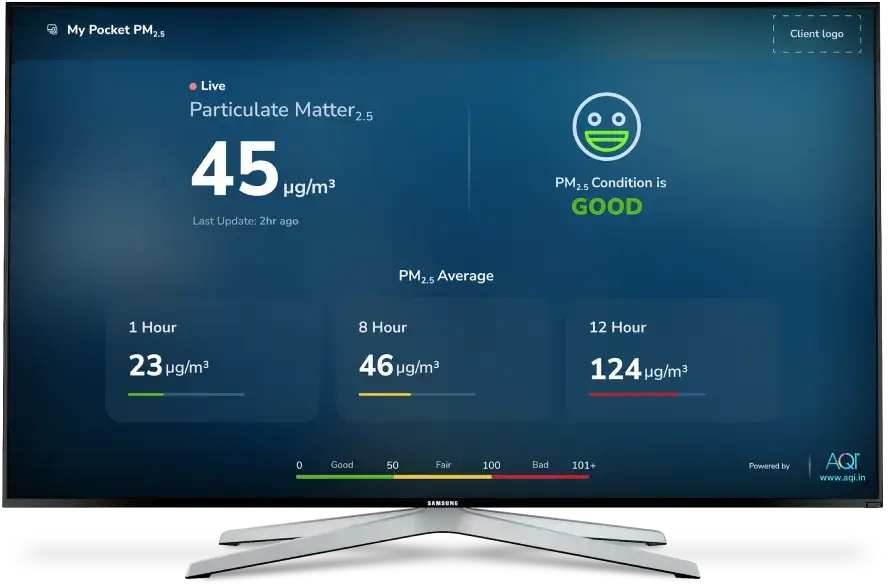
 Smart TV App
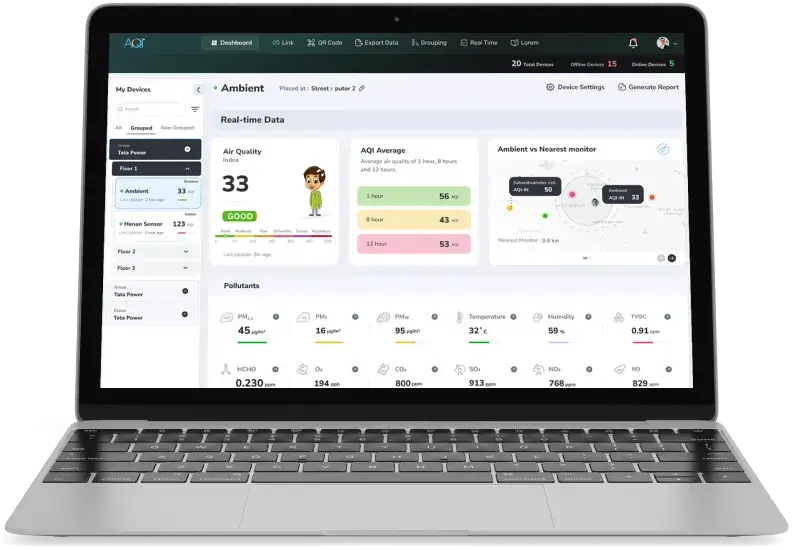
 Web Dashboard
 API
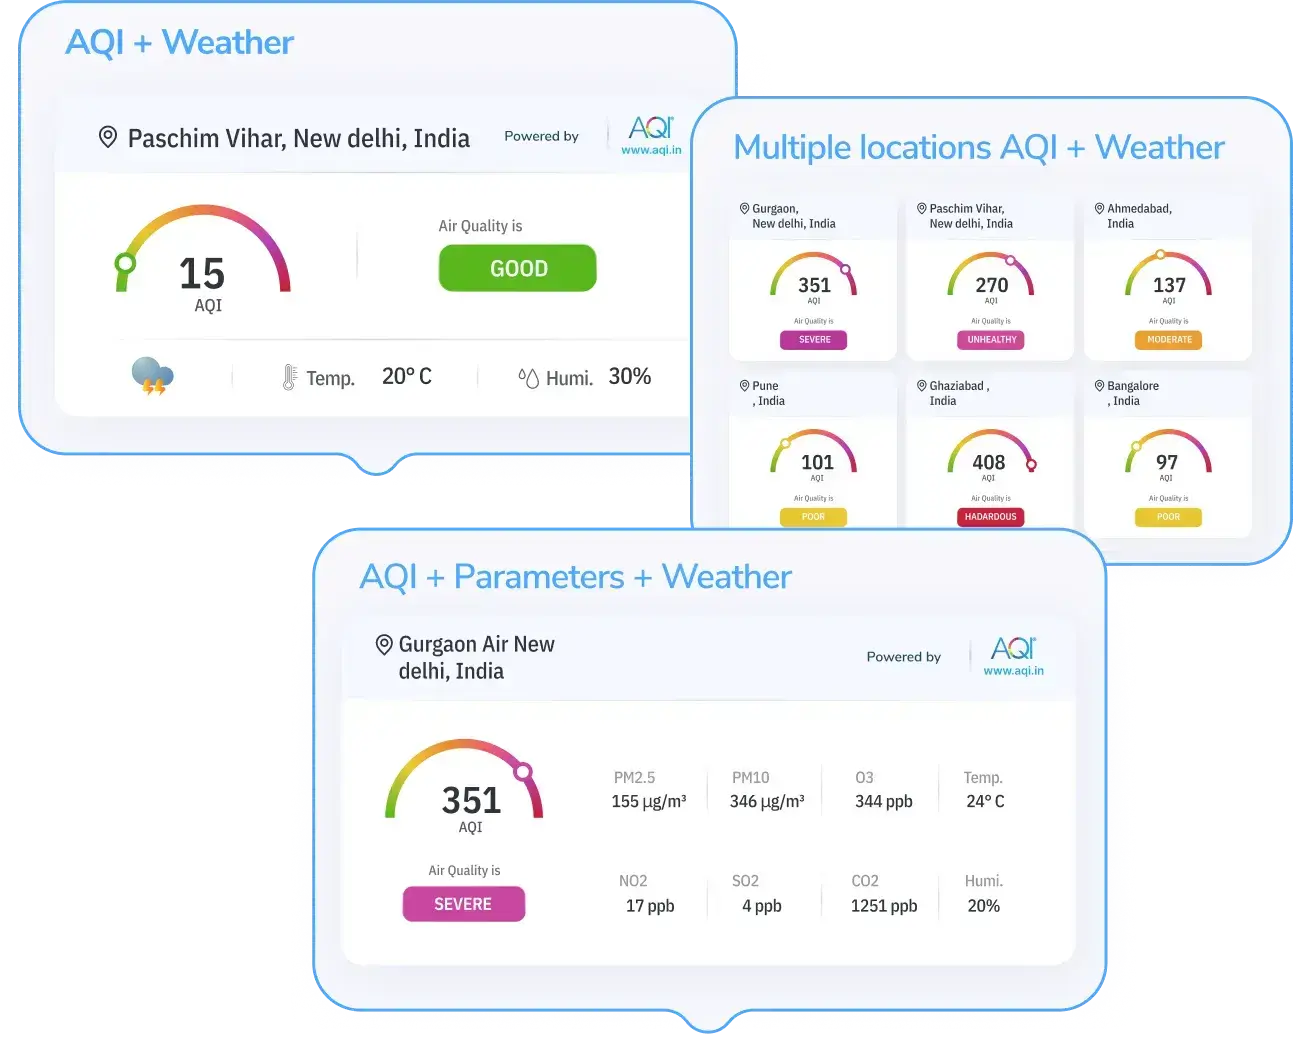
API Widgets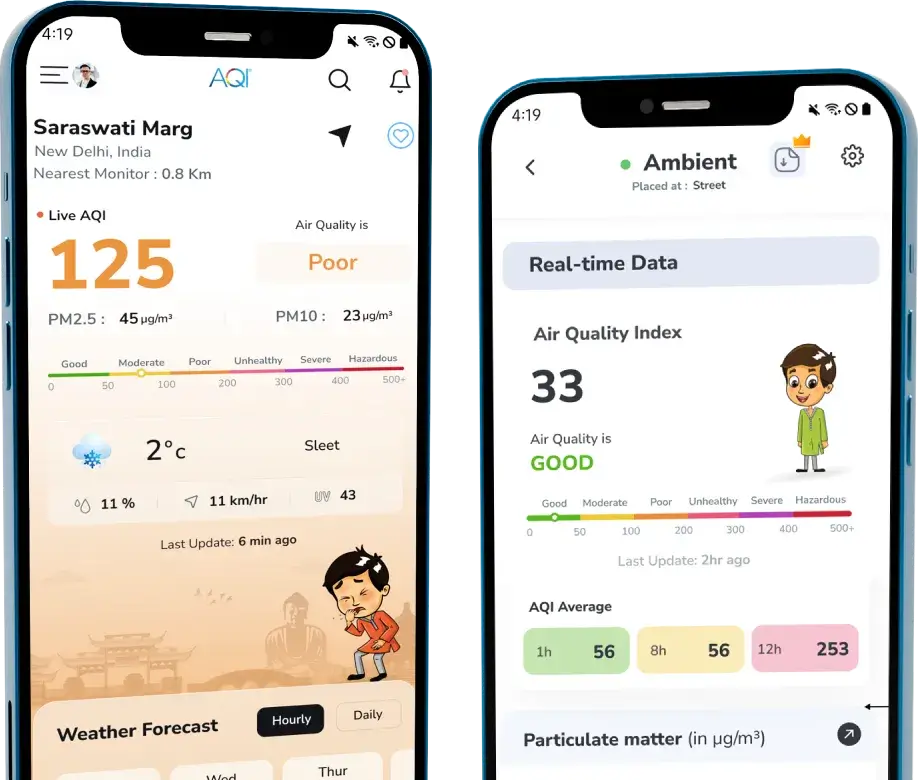











Air Quality FAQs
at Thank You
Frequently Asked Questions About Air Quality
1. What is the current AQI (US) level in Thank You?
1. What is the current AQI (US) level in Thank You?
The current real-time AQI (US) level in Thank You is 84 (Moderate). This was last updated 2026-08-16 02:41 (Local Time).
2. When was the best AQI (US) level in Thank You in the last 24 hours?
2. When was the best AQI (US) level in Thank You in the last 24 hours?
The best AQI (US) level was 38 (Good) at 2:01 PM, Aug 15, 2026 (Local Time) during the last 24 hours.
3. When was the worst AQI (US) level in Thank You in the last 24 hours?
3. When was the worst AQI (US) level in Thank You in the last 24 hours?
The worst AQI (US) level was 151 (Unhealthy) at 10:31 PM, Aug 15, 2026 (Local Time) during the last 24 hours.
4. What is the current trend of AQI (US) levels in Thank You during last 24 hours?
4. What is the current trend of AQI (US) levels in Thank You during last 24 hours?
The AQI (US) levels in Thank You have been fluctuating throughout the last 24 hours. The levels have increased by highest 151 at 10:31 PM, Aug 15, 2026 (Local Time), lowest 38 at 2:01 PM, Aug 15, 2026 (Local Time).
5. What actions are recommended as per the current AQI (US) level in Thank You?
5. What actions are recommended as per the current AQI (US) level in Thank You?
Current AQI (US) levels are acceptable; however, some pollutants may be a concern for a small number of sensitive individuals.
Recent AQI Blogs
Read the latest news
Here are some latest blogs that you can go through to find out more air pollution.


