Ban Tom Air Quality Index (AQI) | Air Pollution
Real-time PM2.5, PM10 air pollution level in Mueang Phayao District
Last Updated: 06 Aug 2025, 08:09pm (Local Time)


24 °C
MistBan Tom
Trending in Thailand
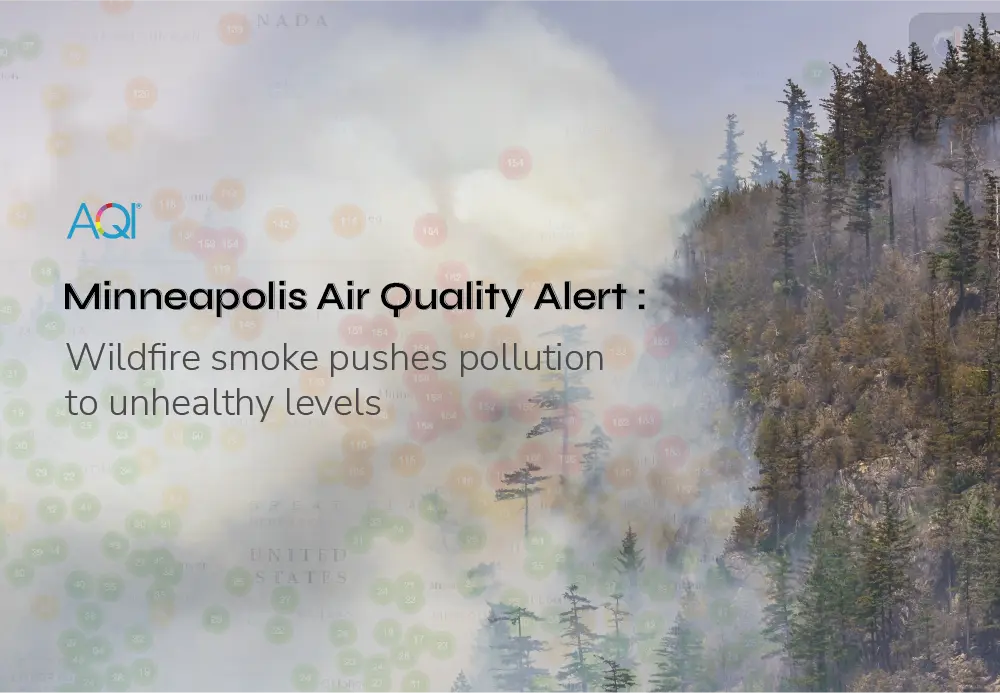
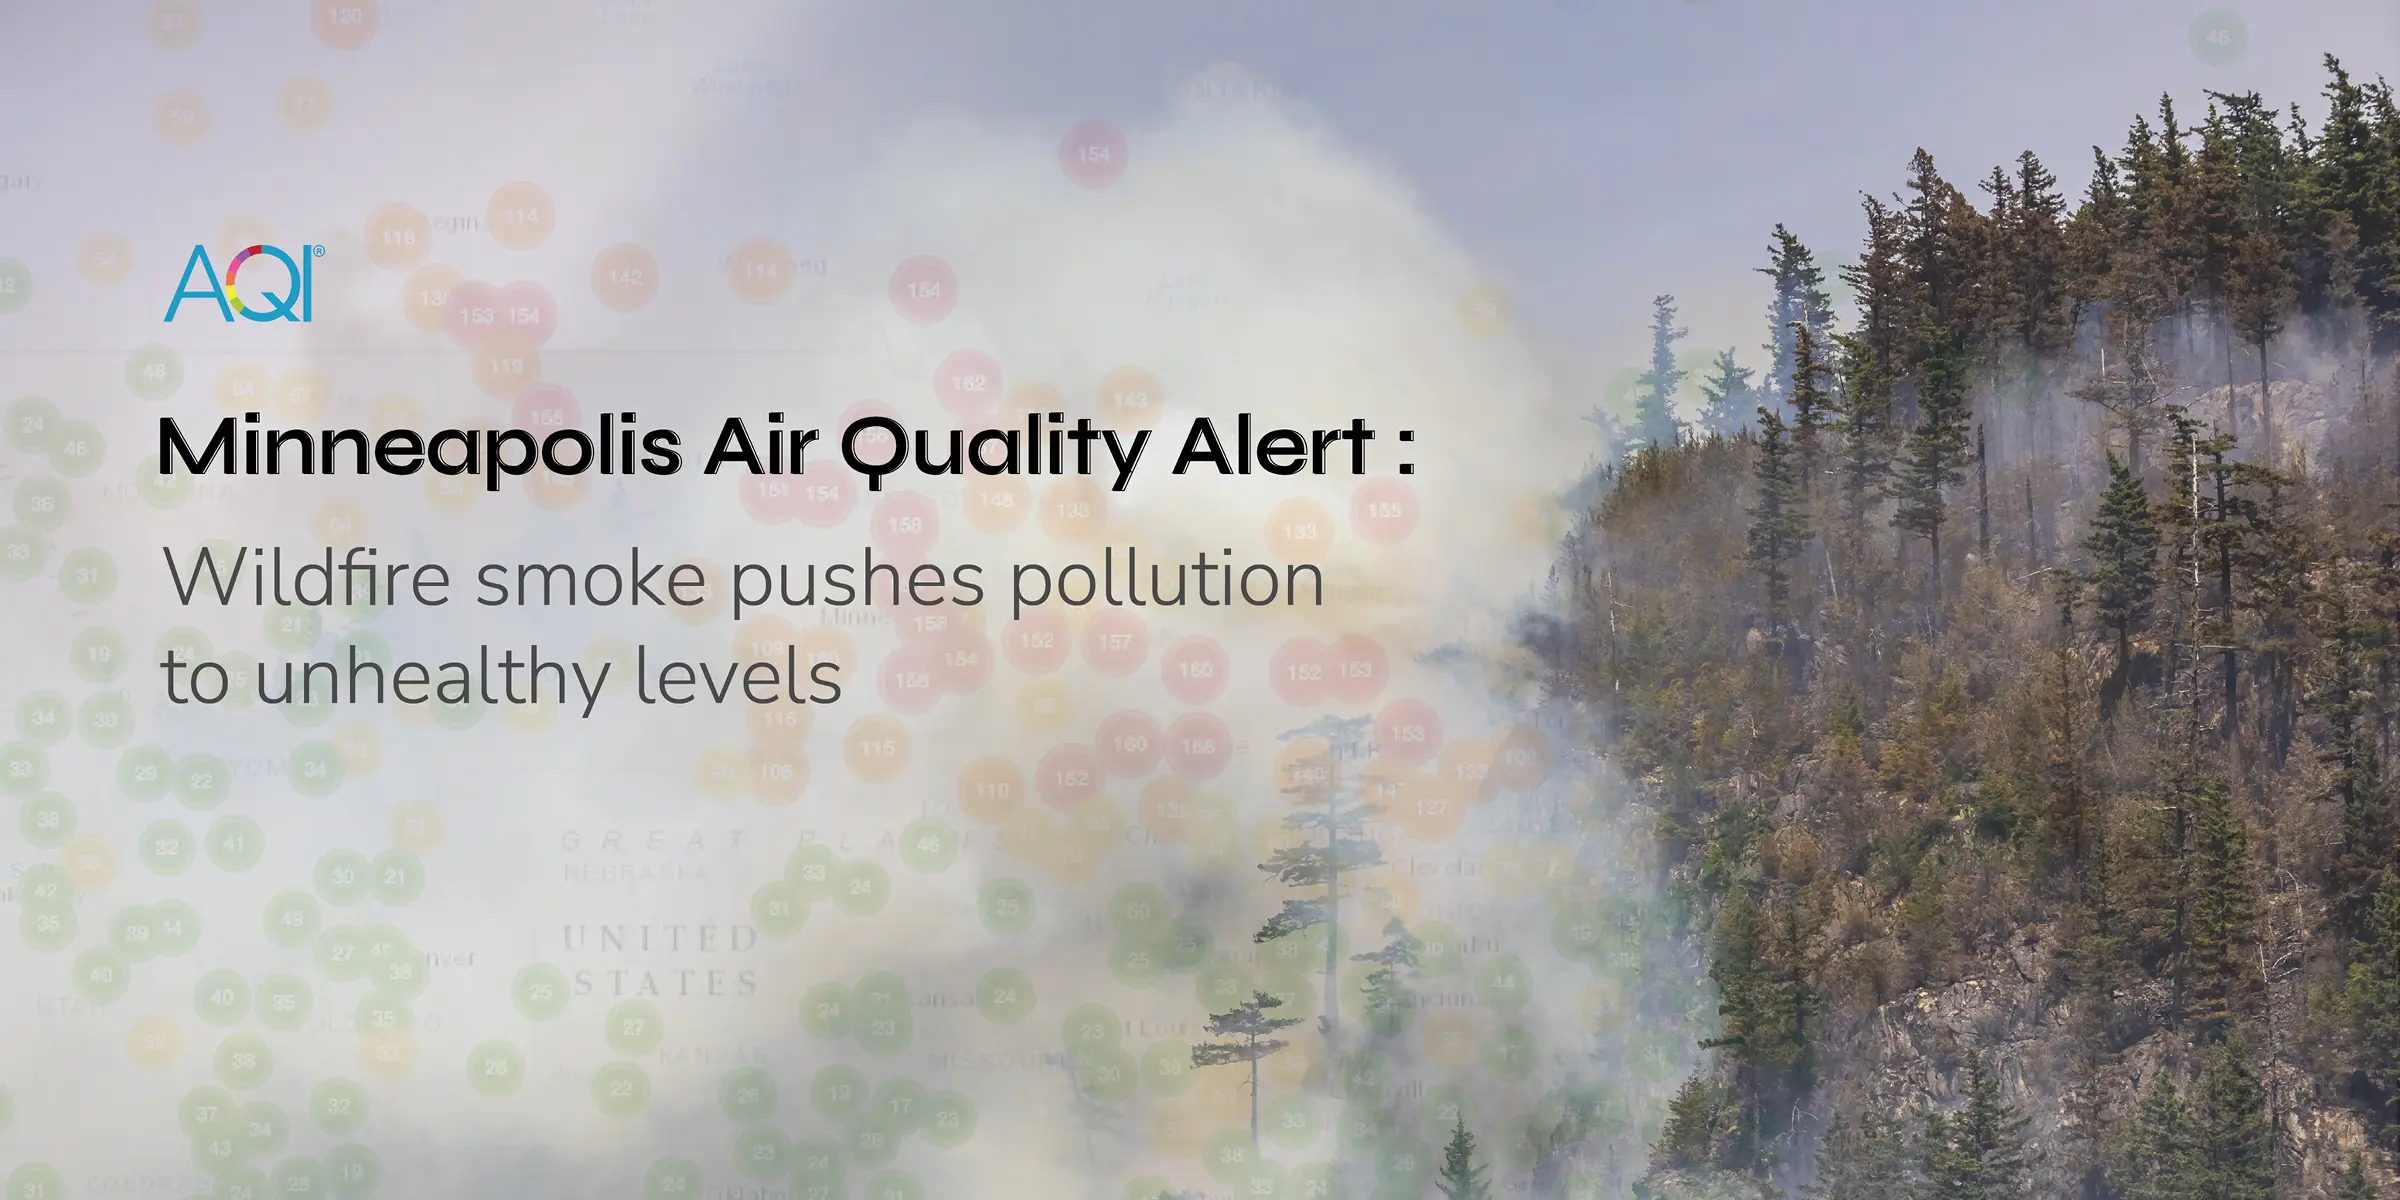
Minneapolis Air Quality Alert: Wildfire Smoke Pushes Pollution to Unhealthy Levels
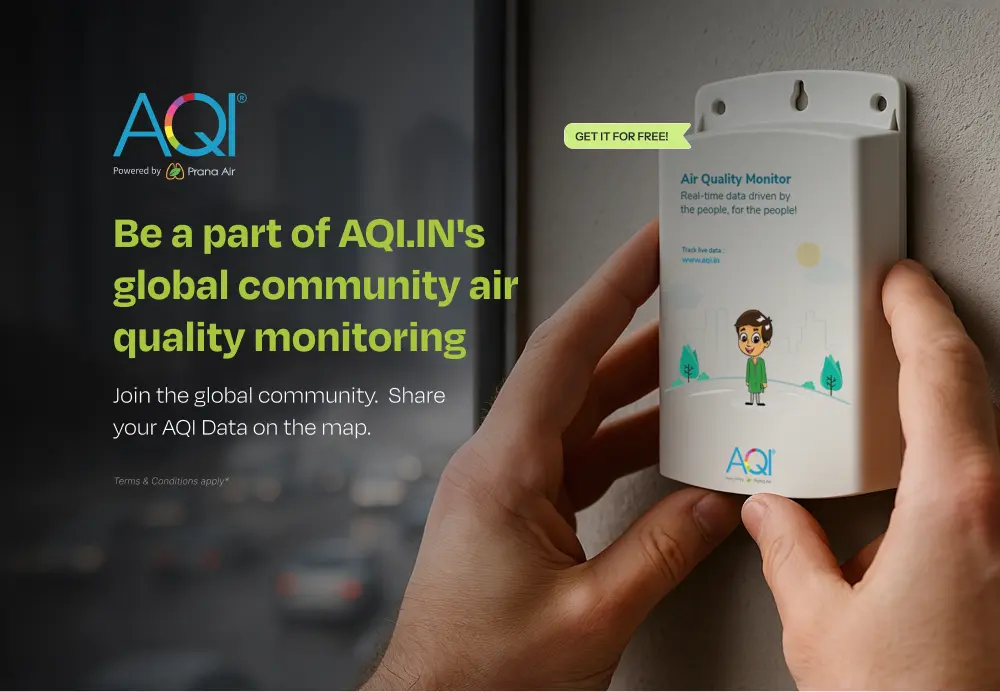
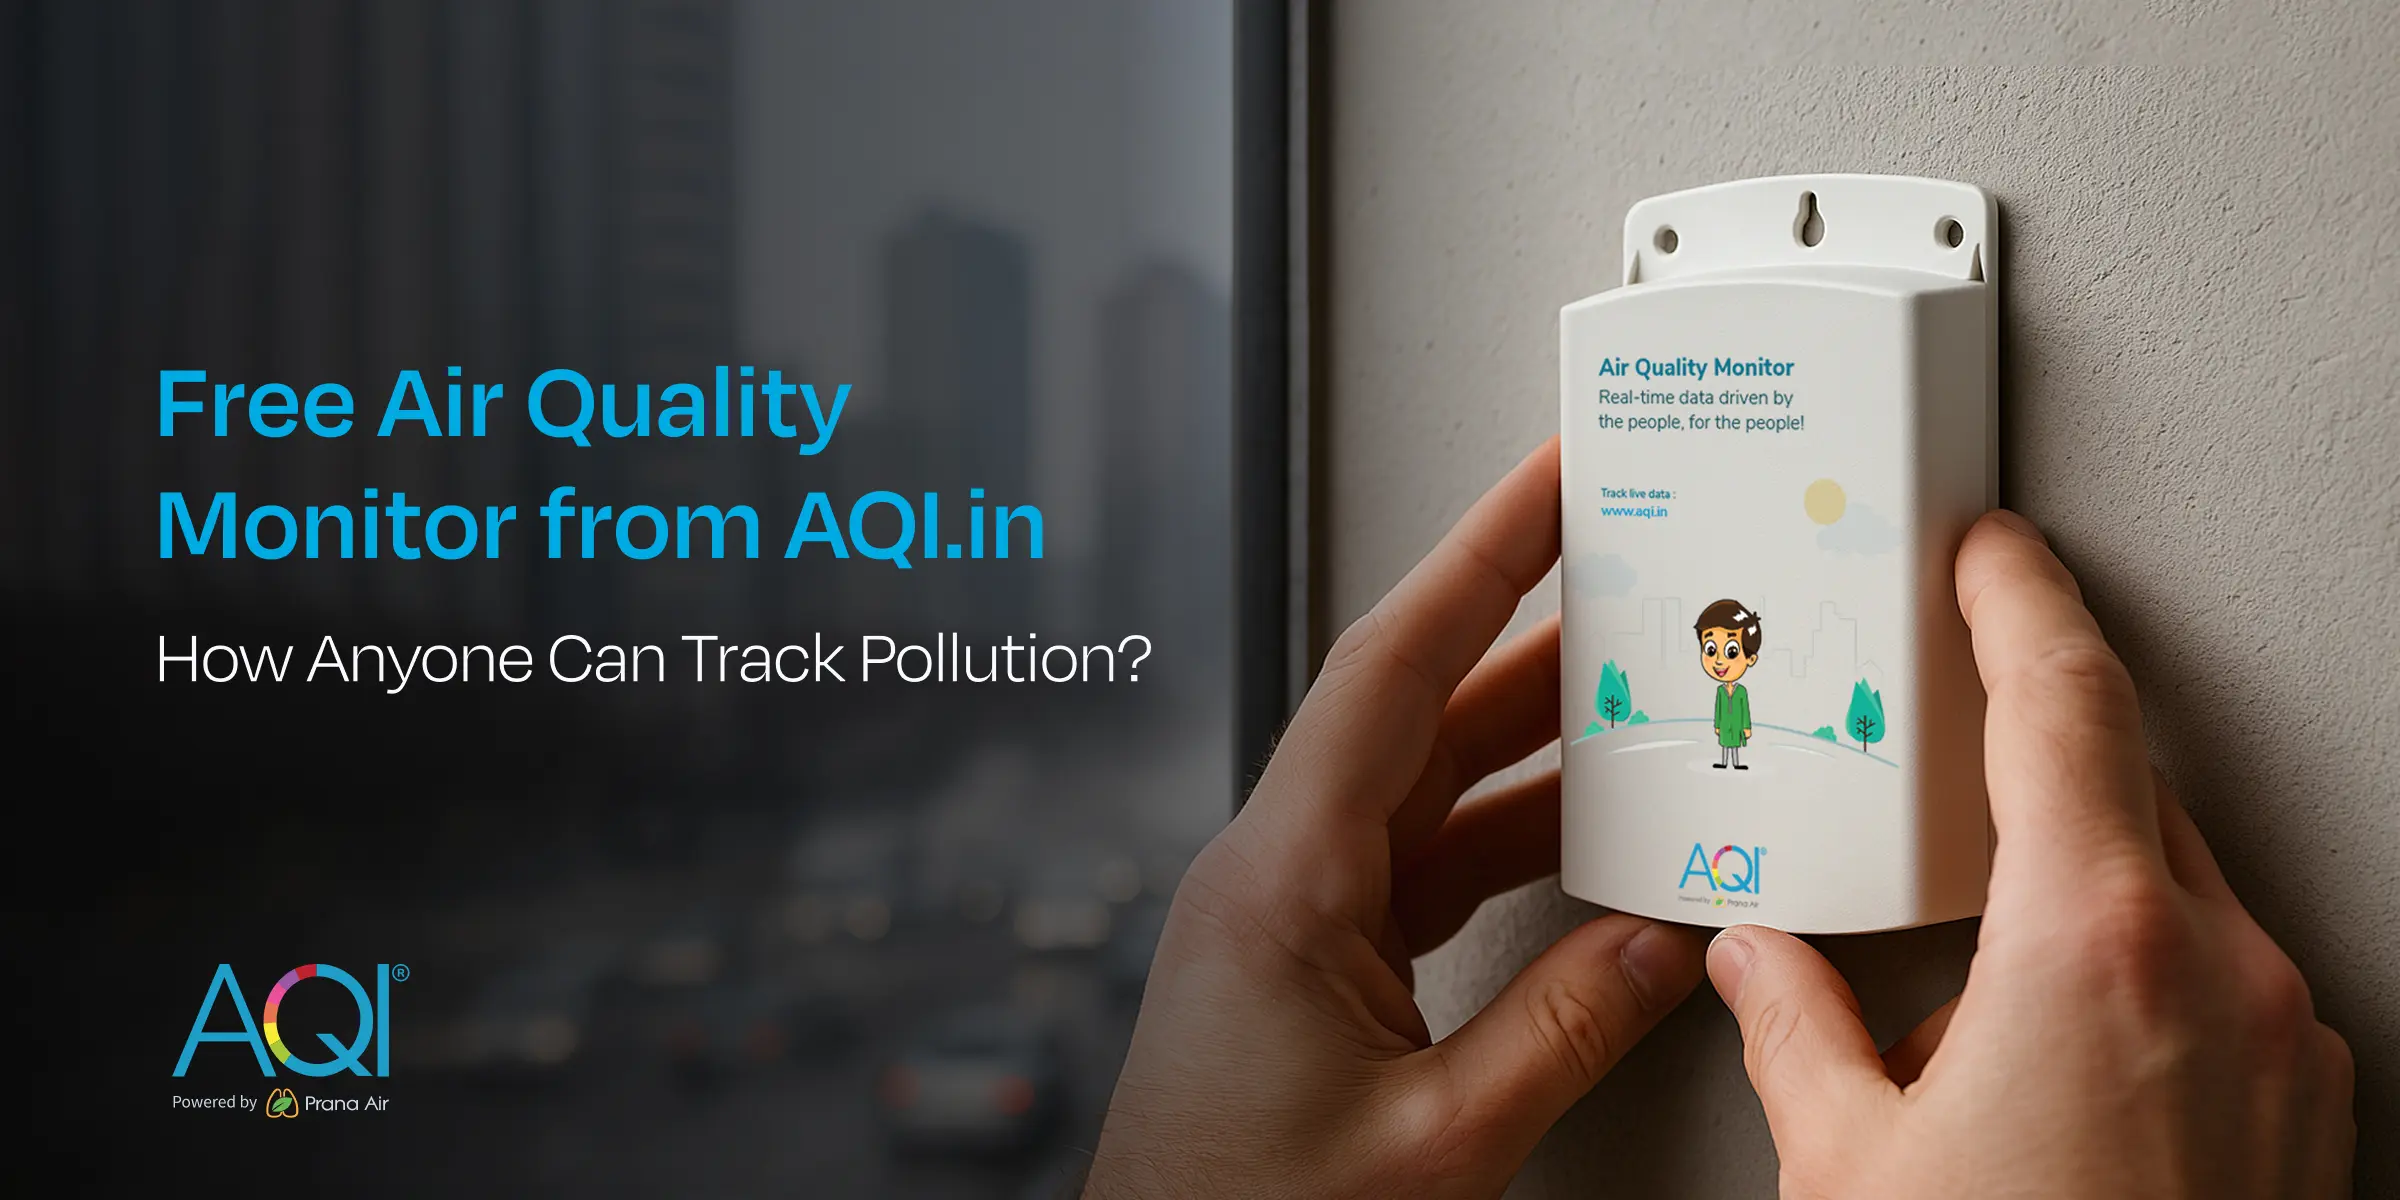
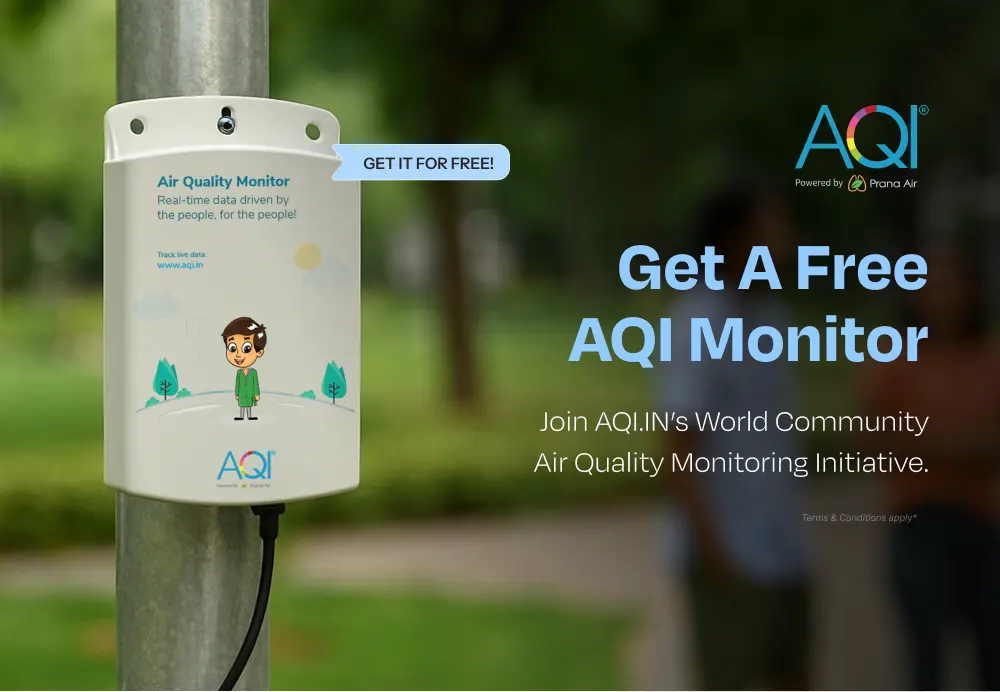
AQI.IN's Community Air Quality Monitoring Get a Free AQI Monitor by Joining AQI.IN's Community Initiative.
Free Air Quality Monitor from AQI.in: How Anyone Can Track Pollution?
AQI Graph
Historical Air Quality Data
Ban Tom
Download 2024 Annual Data
World Air Quality Report

AQI Trends - Annual Air Quality Changes
Ban Tom, Mueang Phayao District, Phayao, Thailand
Annual AQI Trends
Most & Least Polluted Months
* This data analysis is from year 2022 - 2025
Thailand's Metro Cities
Air Quality Index


Air Quality Calendar 2025
Ban Tom
Health Advice For People Living In
Ban Tom
0Cigarettes per day
Breathe easy and get active! The air quality is perfect for enjoying outdoor activities.
Source:
Berkeley Earth
Solutions for Current AQI
 Air PurifierTurn Off
 Car FilterAdvisable
 N95 MaskAdvisable
 Stay IndoorAdvisable
As per the current AQI, turn off the air purifier.
Get an Air PurifierPrevent Health Problems: Understand Your Risks
Ban Tom
 Asthma
 Heart Issues
 Allergies
 Sinus
Sinus Cold/Flu
 Chronic (COPD)

Low Chances of Asthma
Asthma
Risk of Asthma symptoms is Low when AQI is Good (0-50)
Mild symptoms such as slight wheezing, occasional cough, and minor shortness of breath
Do's :
Keep track of air quality to plan outdoor activities safely.
Drink water to keep airways moist and reduce irritation.
Include non-allergenic fruits and vegetables that support overall lung health, like apples, pears, and spinach.
Don'ts :
Skip medications that is prescribed by your doctor.
Engage in outdoor activities in early morning during high pollen hours.
Most Polluted Cities 2025
Thailand
Analyze the real-time most air polluted cities in the country.
Standard Value
1.
Ban Lam Sam Kaeo, Thailand
2.
Khu Khot, Thailand
3.
Sam Phran, Thailand
4.
Muen Wai, Thailand
5.
Ban Om Noi, Thailand
6.
Bangkok, Thailand
7.
Lop Buri, Thailand
8.
Ban Krathum Lom, Thailand
9.
Ban Talat Rangsit, Thailand
10.
Samut Prakan, Thailand
Last Updated: 06 Aug 2025, 01:22 PM
AQI City RankingsAir Quality Solutions For Ban Tom
Explore the solutions of air quality monitoring & clean air.
Here are some applications that you can go through to find out the solutions.


Ban Tom's AQI Data Analytics Solutions
Air quality data monitoring platforms

Your area’s real-time data with detailed parameters.
Personalized health advice as per current AQI.
Analytical data to identify trends and conditions.
Connect and control your air quality devices.
Air Quality FAQs
at Ban Tom
Frequently Asked Questions About Air Quality
What is the current AQI level in Ban Tom?
The current real-time AQI level in Ban Tom is 41 (Good) due to recent rainfall by 0.02mm/hr. This was last updated 06 Aug 2025, 08:09pm (Local Time).
When was the best AQI level in Ban Tom in the last 24 hours?
The best AQI level was 32 (Good) at 3:10 PM (Local Time) during the last 24 hours.
When was the worst AQI level in Ban Tom in the last 24 hours?
The worst AQI level was 55 (Moderate) at 11:10 PM, Aug 5, 2025 (Local Time) during the last 24 hours.
What is the current trend of AQI levels in Ban Tom during last 24 hours?
The AQI levels in Ban Tom have been fluctuating throughout the last 24 hours. The levels have increased by highest 55 at 11:10 PM, Aug 5, 2025 (Local Time), lowest 32 at 3:10 PM (Local Time).
What actions are recommended as per the current AQI level in Ban Tom?
The air quality is satisfactory, and air pollution poses little or no risk. No special precautions are needed; enjoy outdoor activities freely.
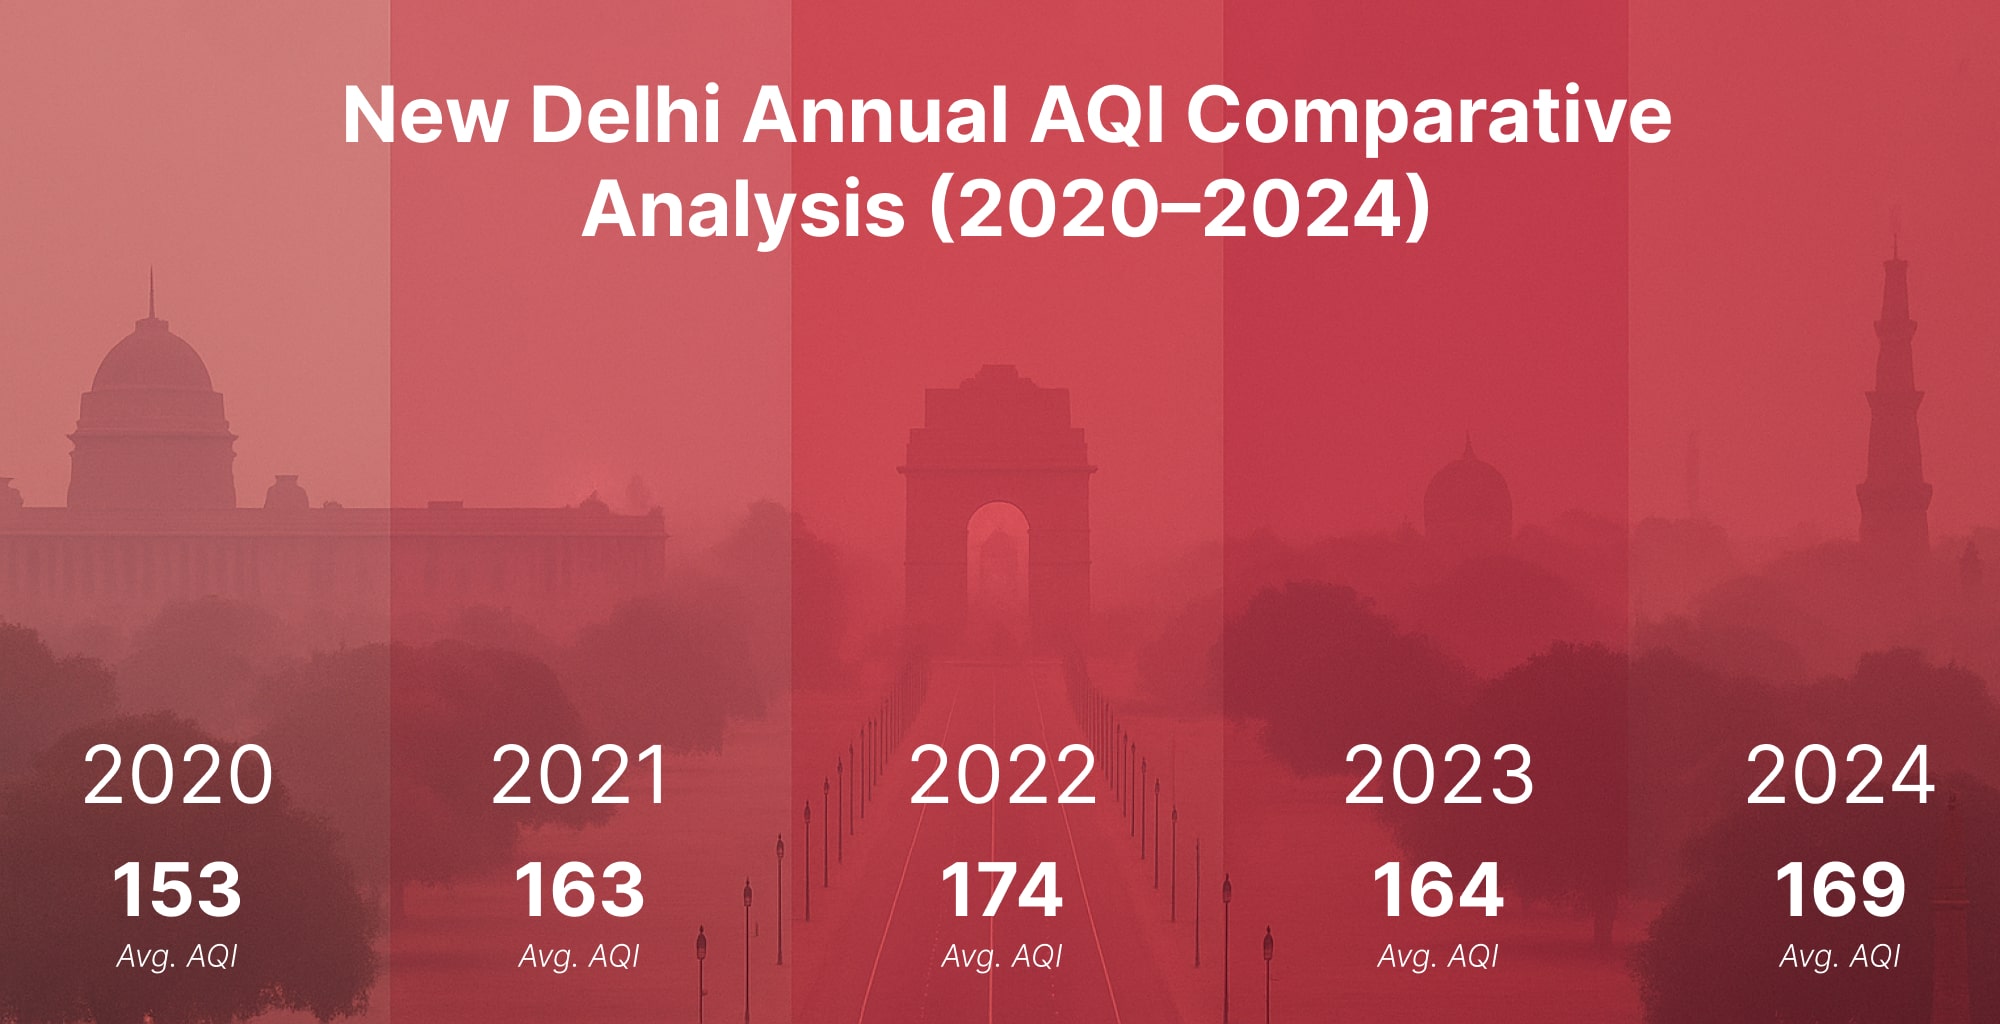
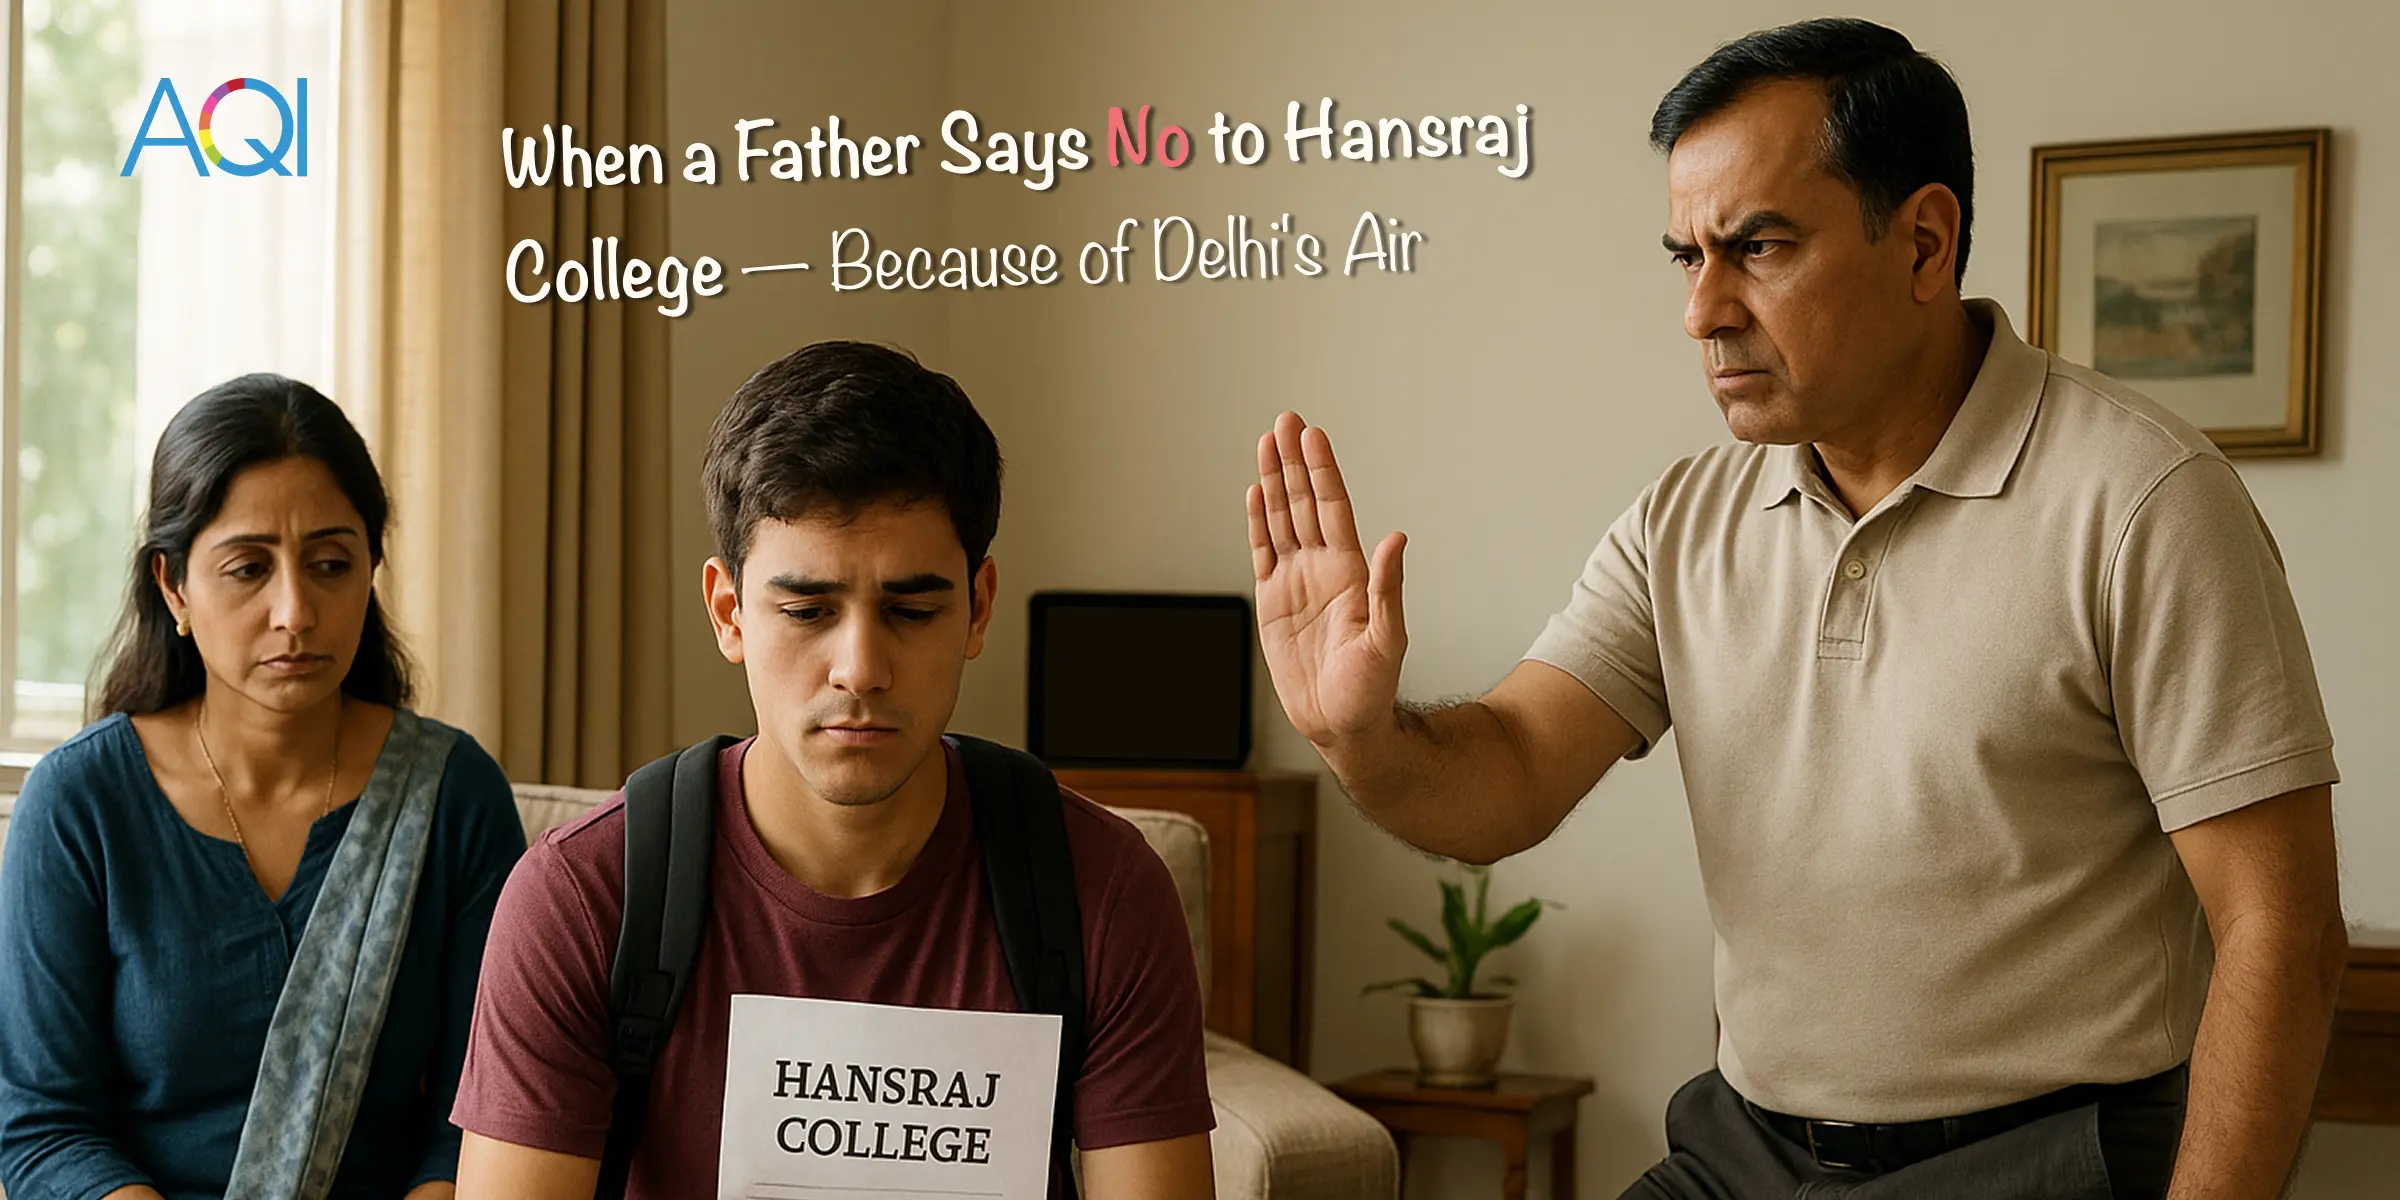
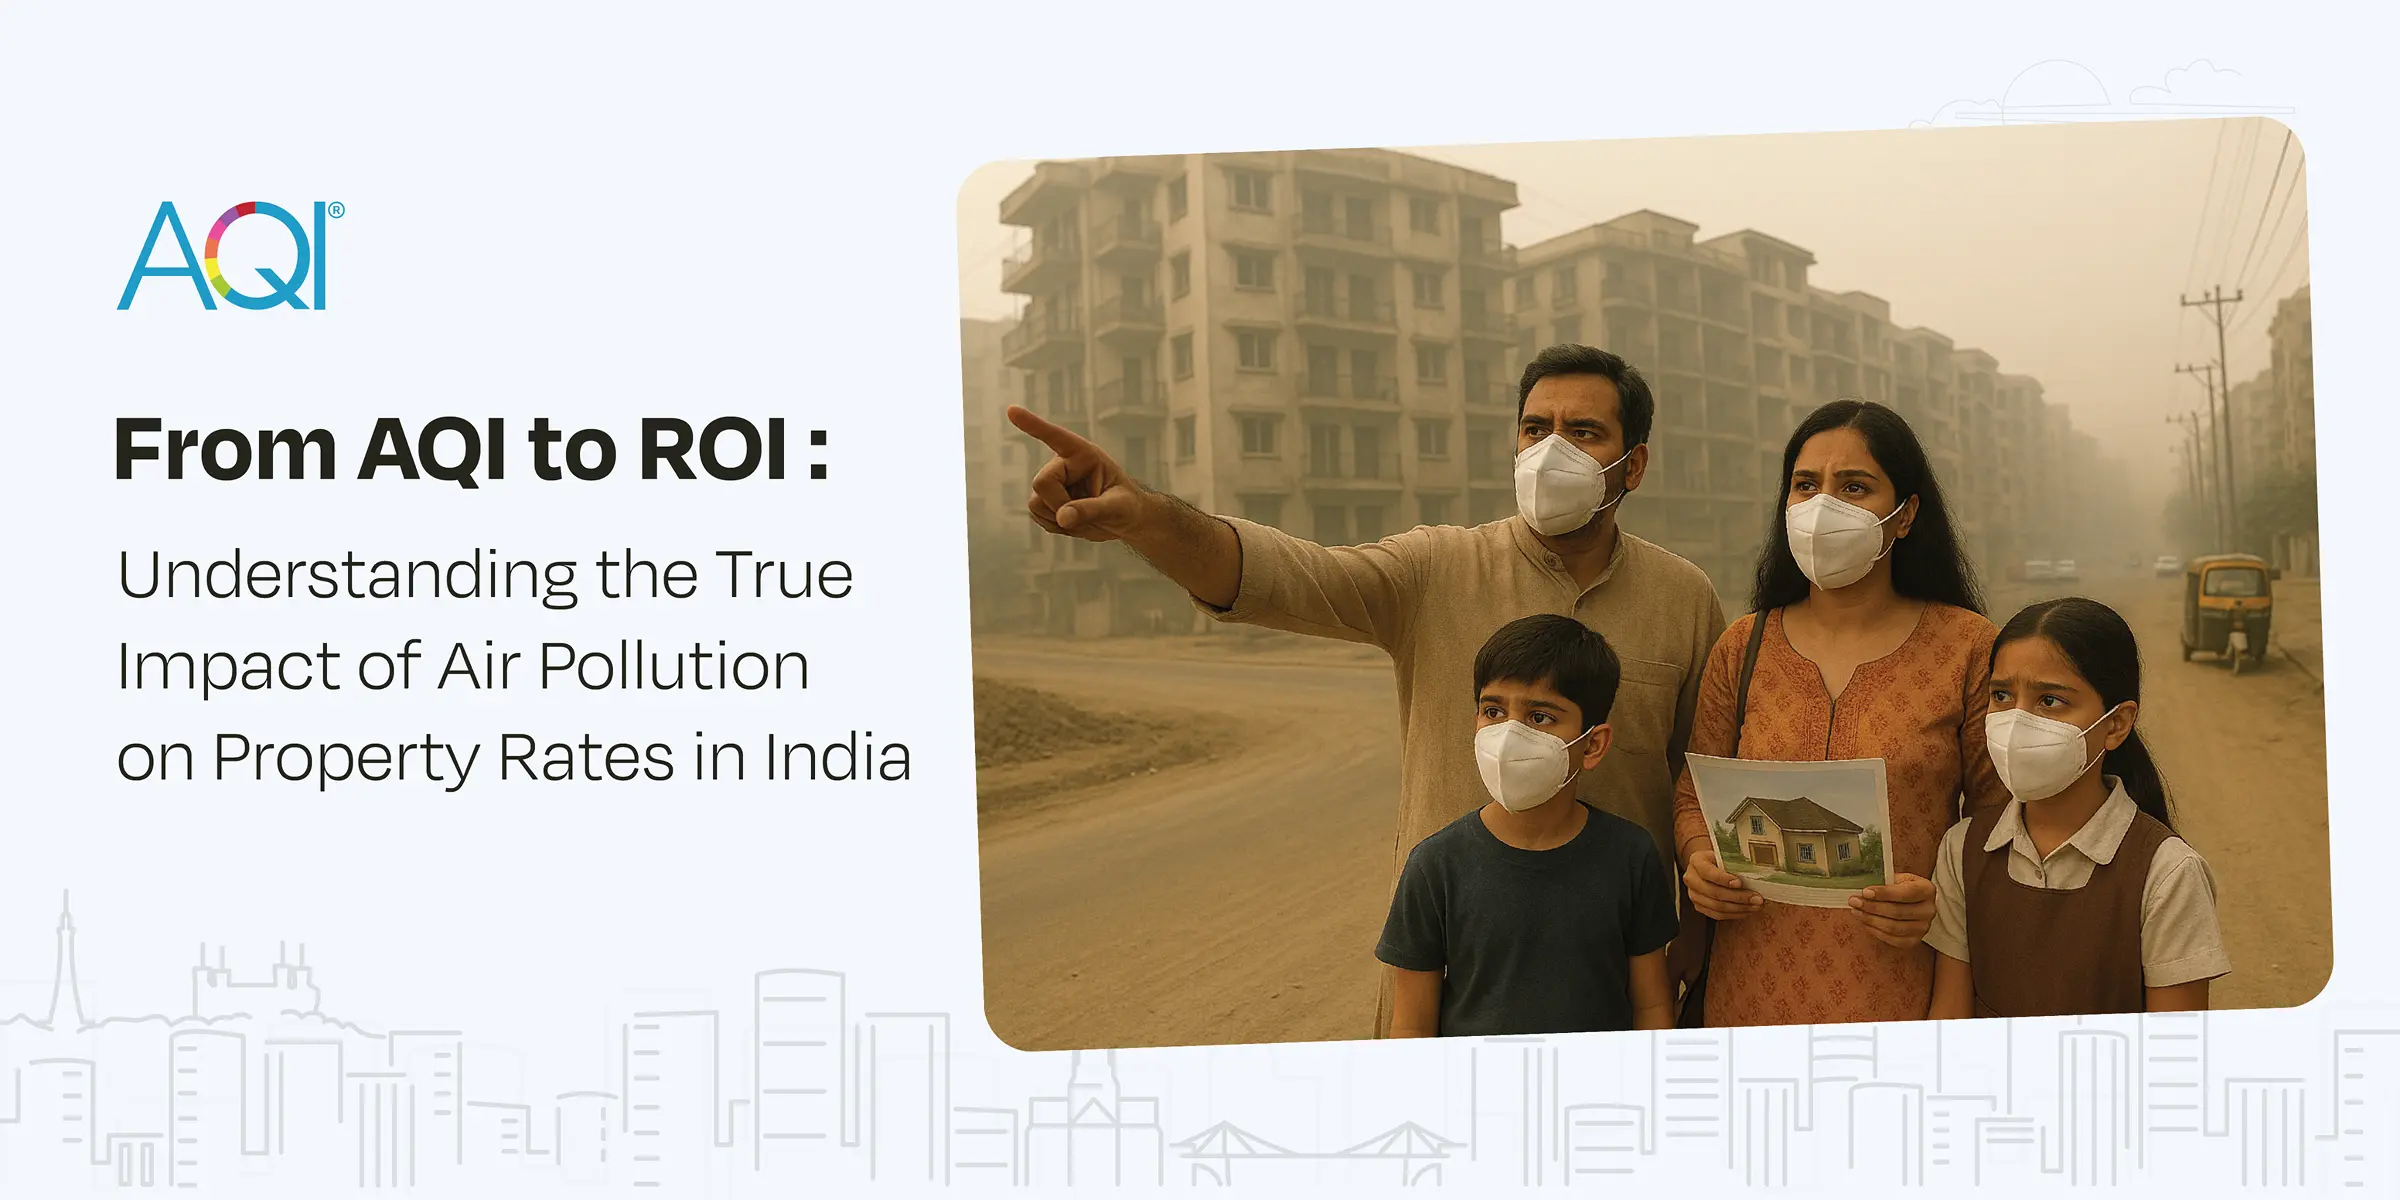
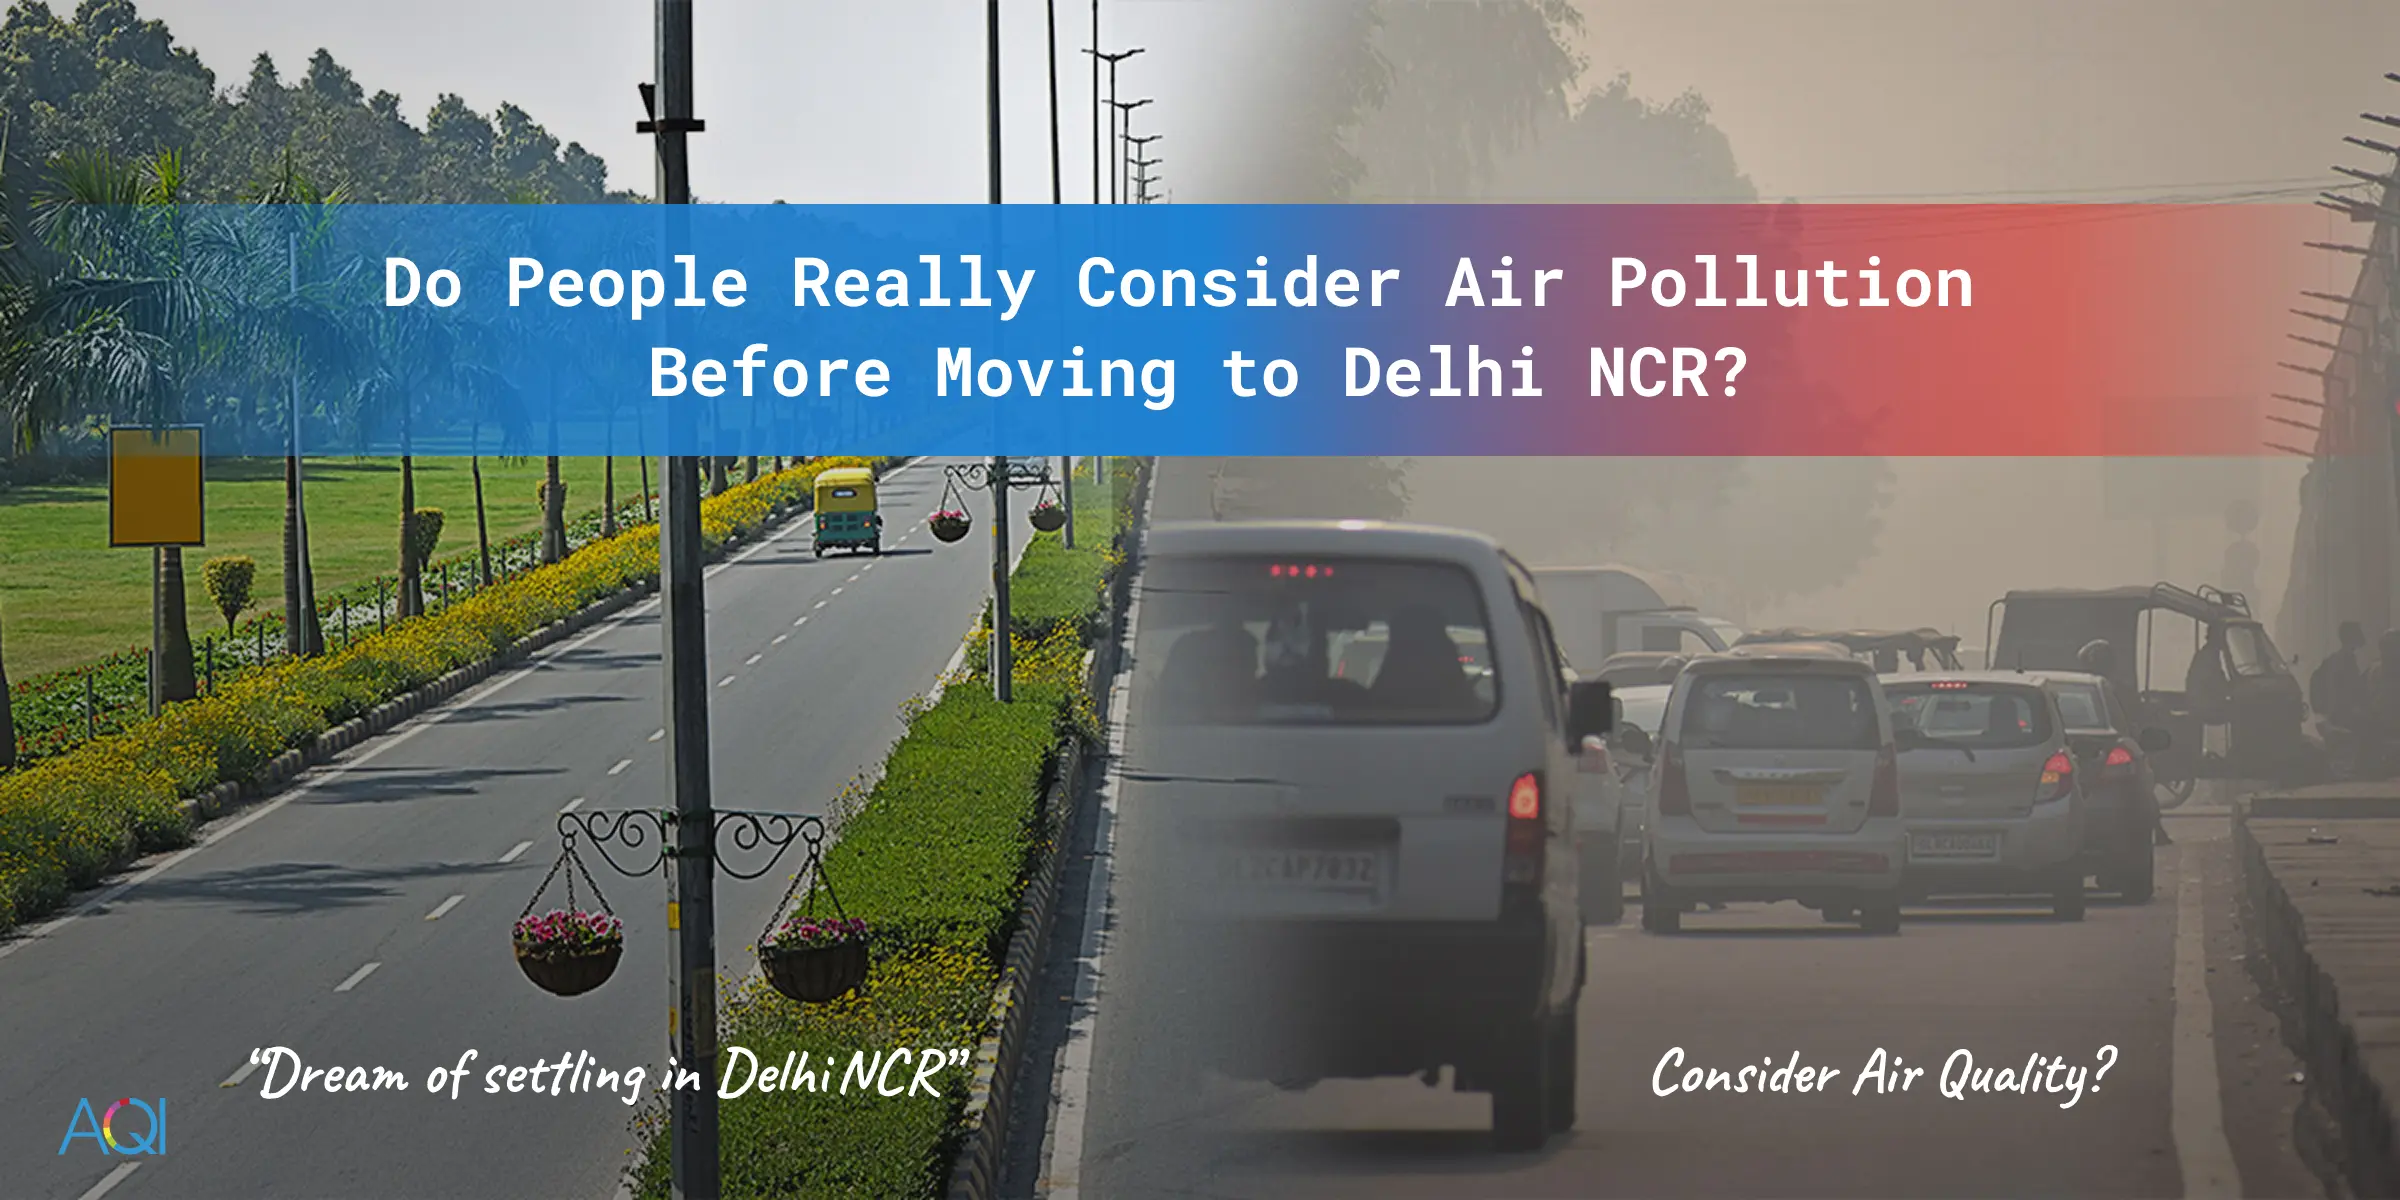
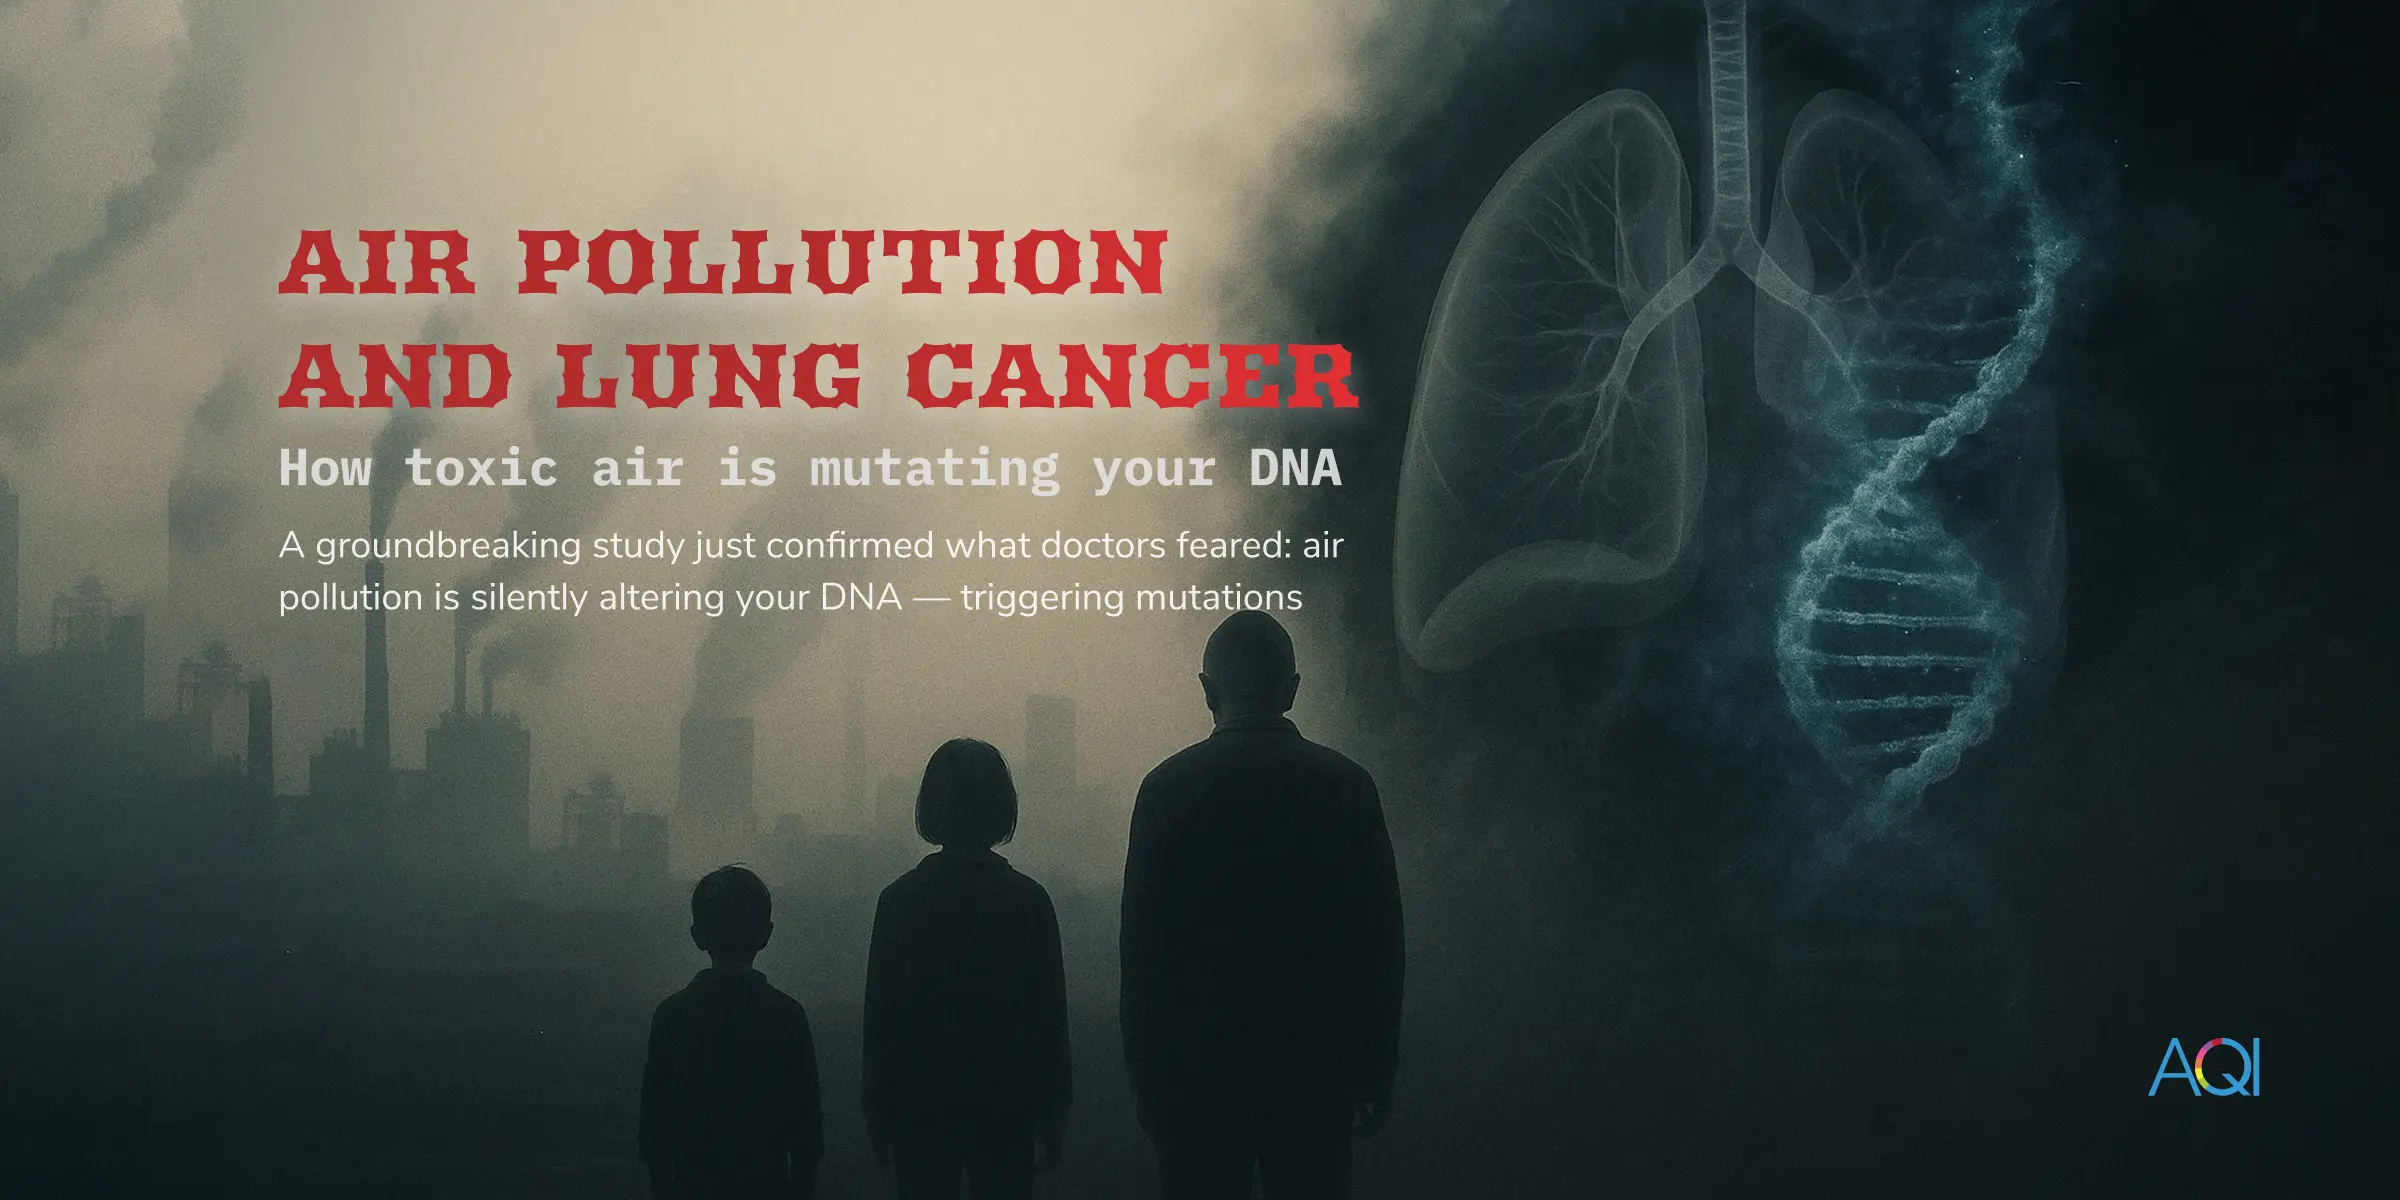
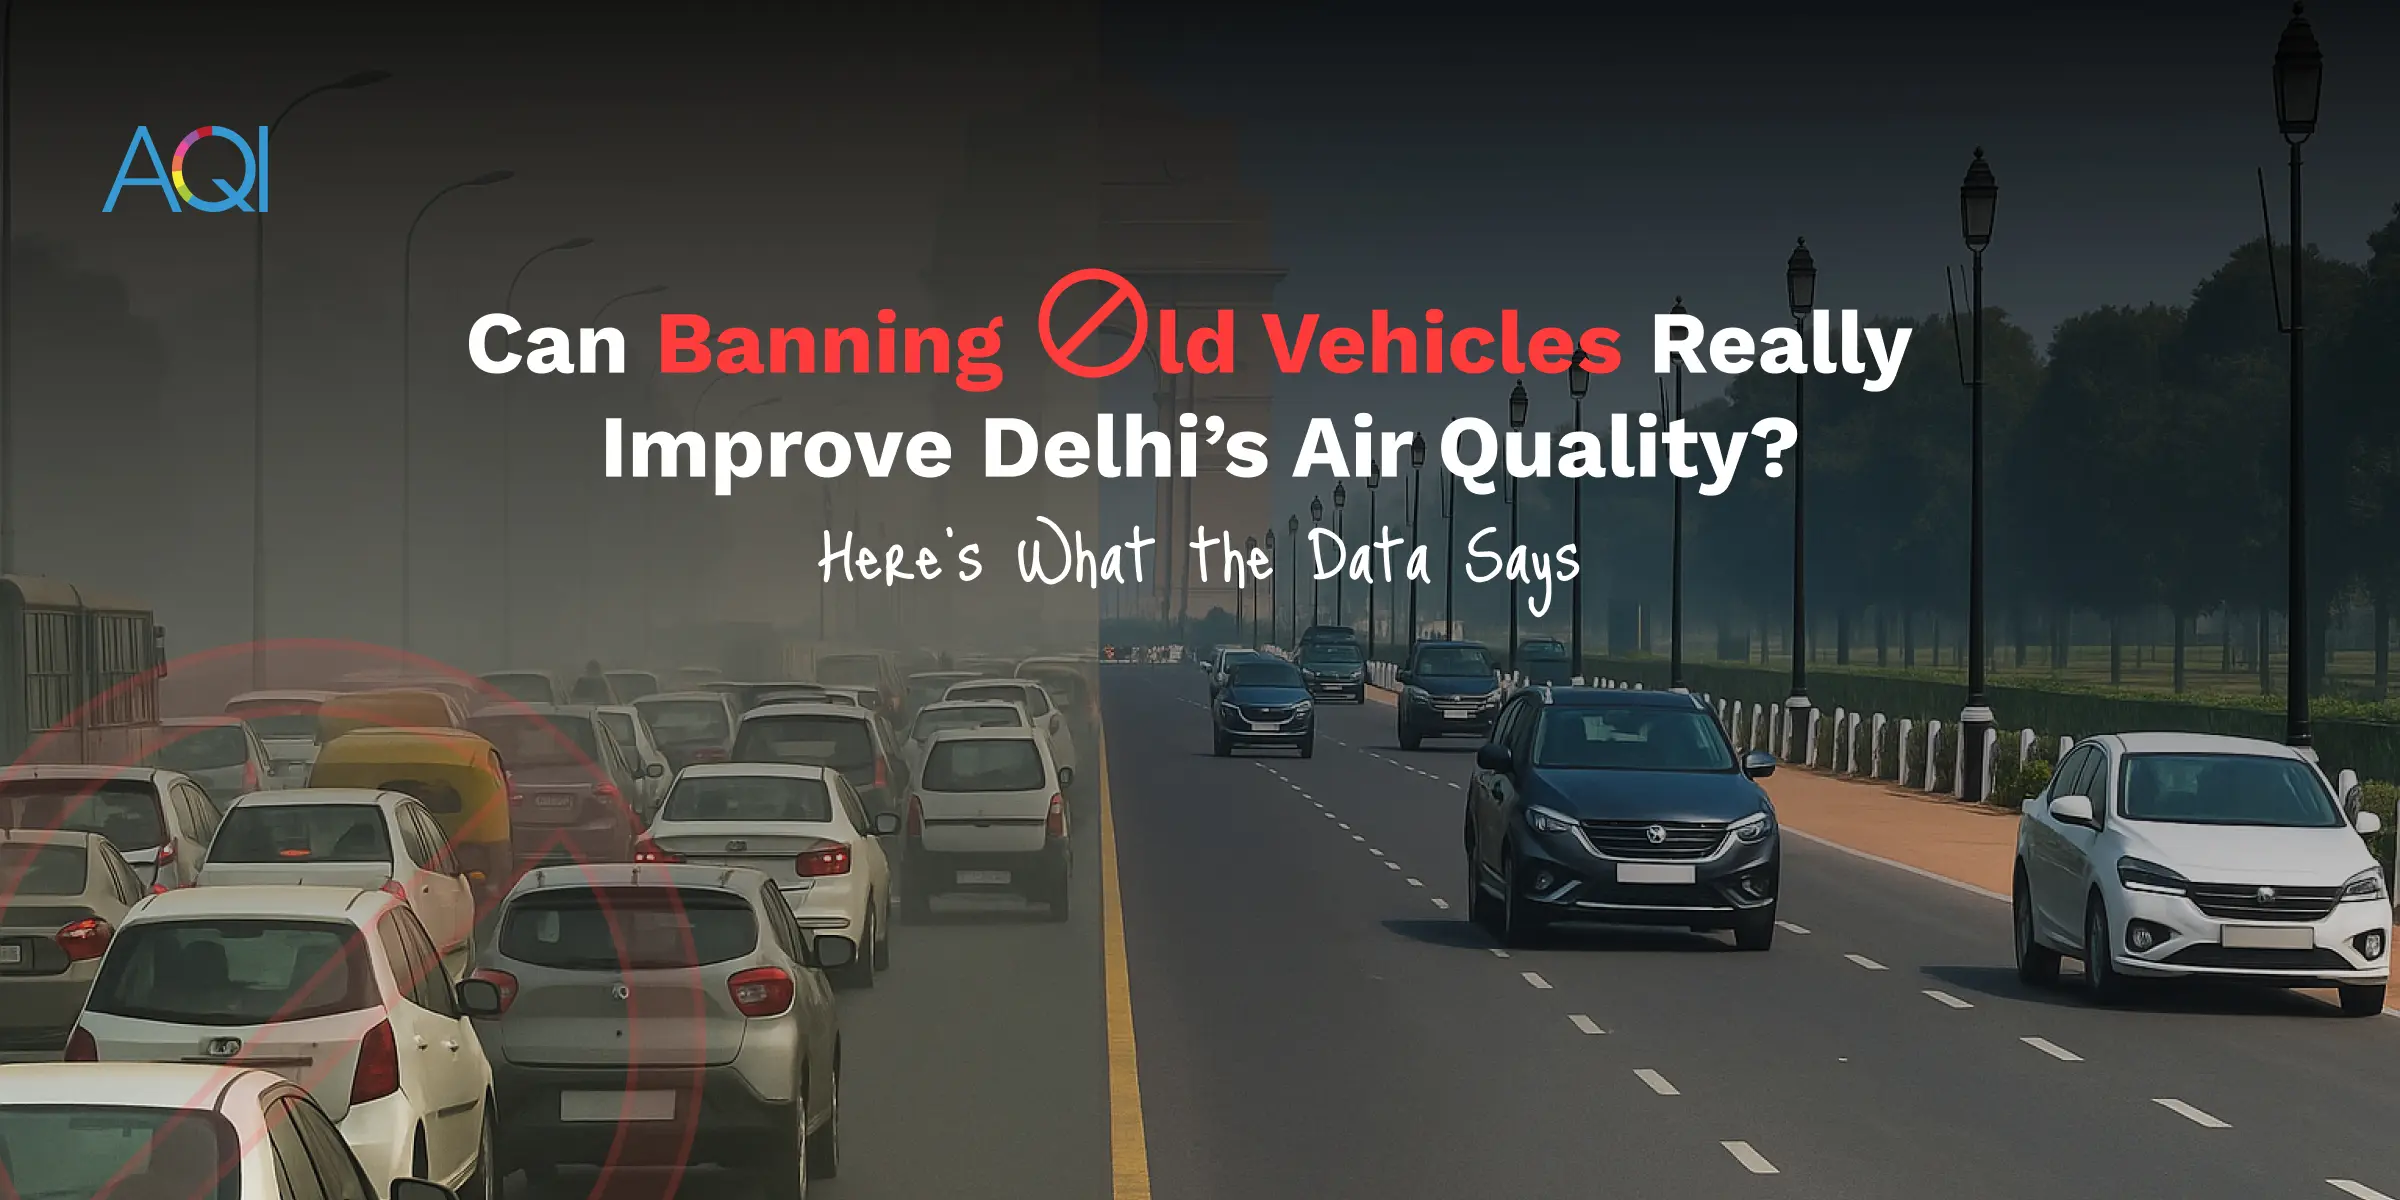
Recent AQI Blogs
Read the latest news
Here are some latest blogs that you can go through to find out more air pollution.