Kentucky Air Quality Index (AQI) | Air Pollution
Real-time PM2.5, PM10 air pollution level in Kentucky
Check the air quality level of thecities in Kentucky

Kentucky
Kentucky's Cities
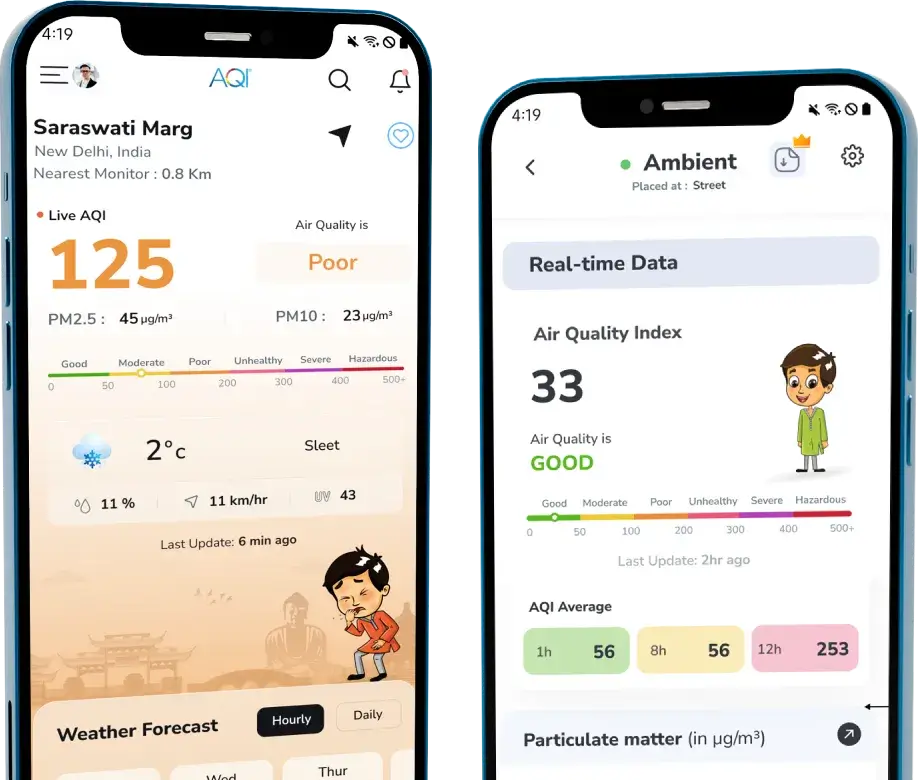
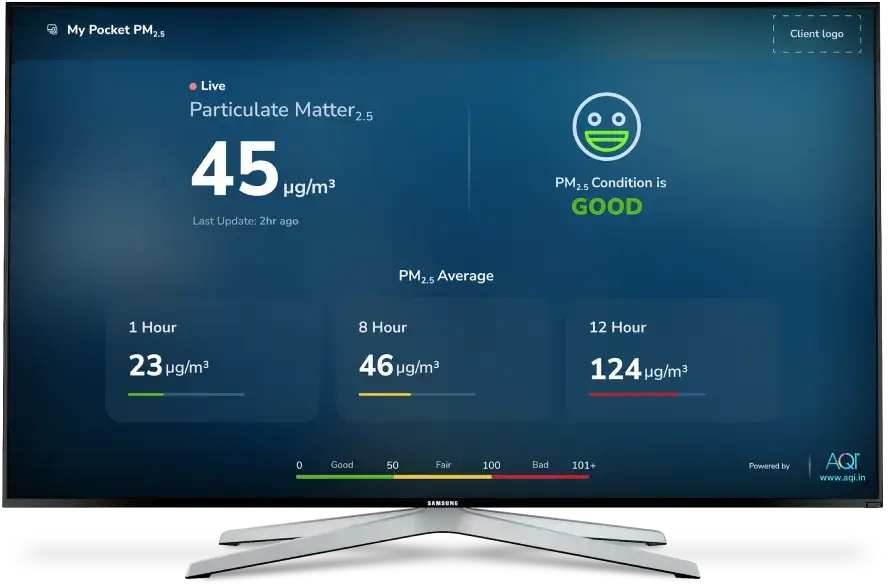
Real-time Air Pollution Level
United States's Metro Cities
Air Quality Index


Most Polluted Cities 2026
United States
Analyze the real-time most air polluted cities in the country.
Standard Value
1.
Fairbanks, Alaska
Unhealthy
4xabove Standard
2.
Anchorage, Alaska
Unhealthy
4xabove Standard
3.
Knik Fairview, Alaska
Unhealthy
4xabove Standard
4.
Bellingham, Washington
Poor
3xabove Standard
5.
Chelan, Washington
Poor
2xabove Standard
6.
Socorro, Texas
Poor
2xabove Standard
7.
Omak, Washington
Moderate
2xabove Standard
8.
Havre, Montana
Moderate
2xabove Standard
9.
Las Cruces, New Mexico
Moderate
2xabove Standard
10.
Deming, New Mexico
Moderate
2xabove Standard
Last Updated: 01 Aug 2026, 06:27 AM
AQI City RankingsAir Quality Solutions For Kentucky
Explore the solutions of air quality monitoring & clean air.
Here are some applications that you can go through to find out the solutions.


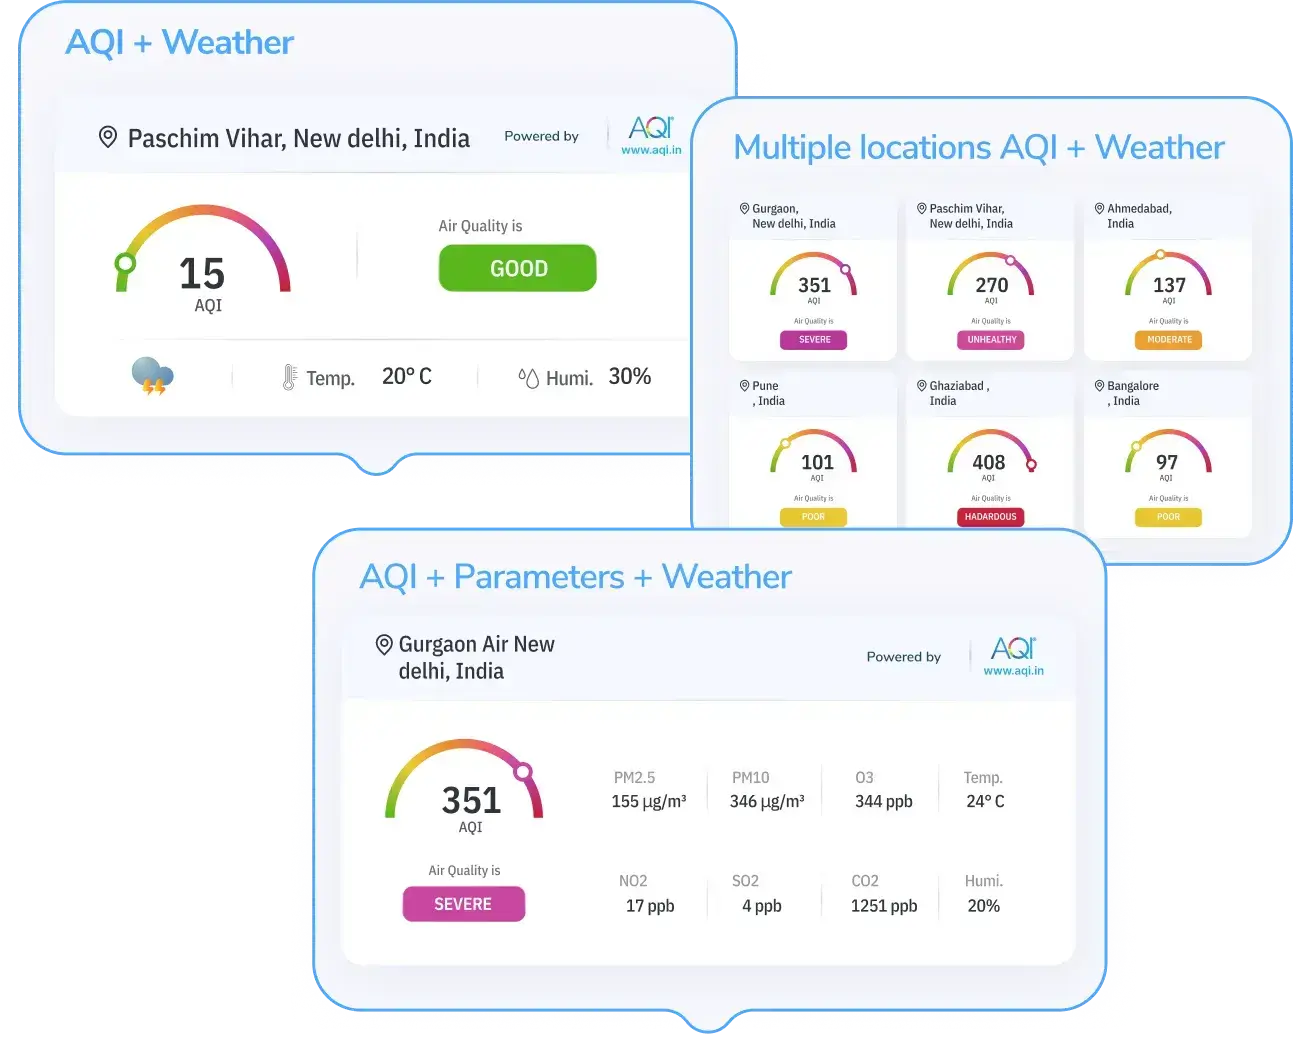
Kentucky's AQI Data Analytics Solutions
Air quality data monitoring platforms


Recent AQI Blogs
Read the latest news
Here are some latest blogs that you can go through to find out more air pollution.


