Kilkunda Particulate Matter (PM10) Level
Tamil Nadu, India

55µg/m³
Last Updated: 2025-10-08 06:10:20 AM (Local Time)

Kilkunda
What is the Current PM10 Level?
Kilkunda
The current PM10 level in Kilkunda based on the average air quality level across the city is 55 µg/m³ making it acceptable, but sensitive individuals should be cautious.
The current PM10 level in Kilkunda is 1.2x Above the recommended WHO guideline of 45 µg/m³.
Trending in India

Air Quality Monitoring for Logistics: Smarter Deliveries with Data
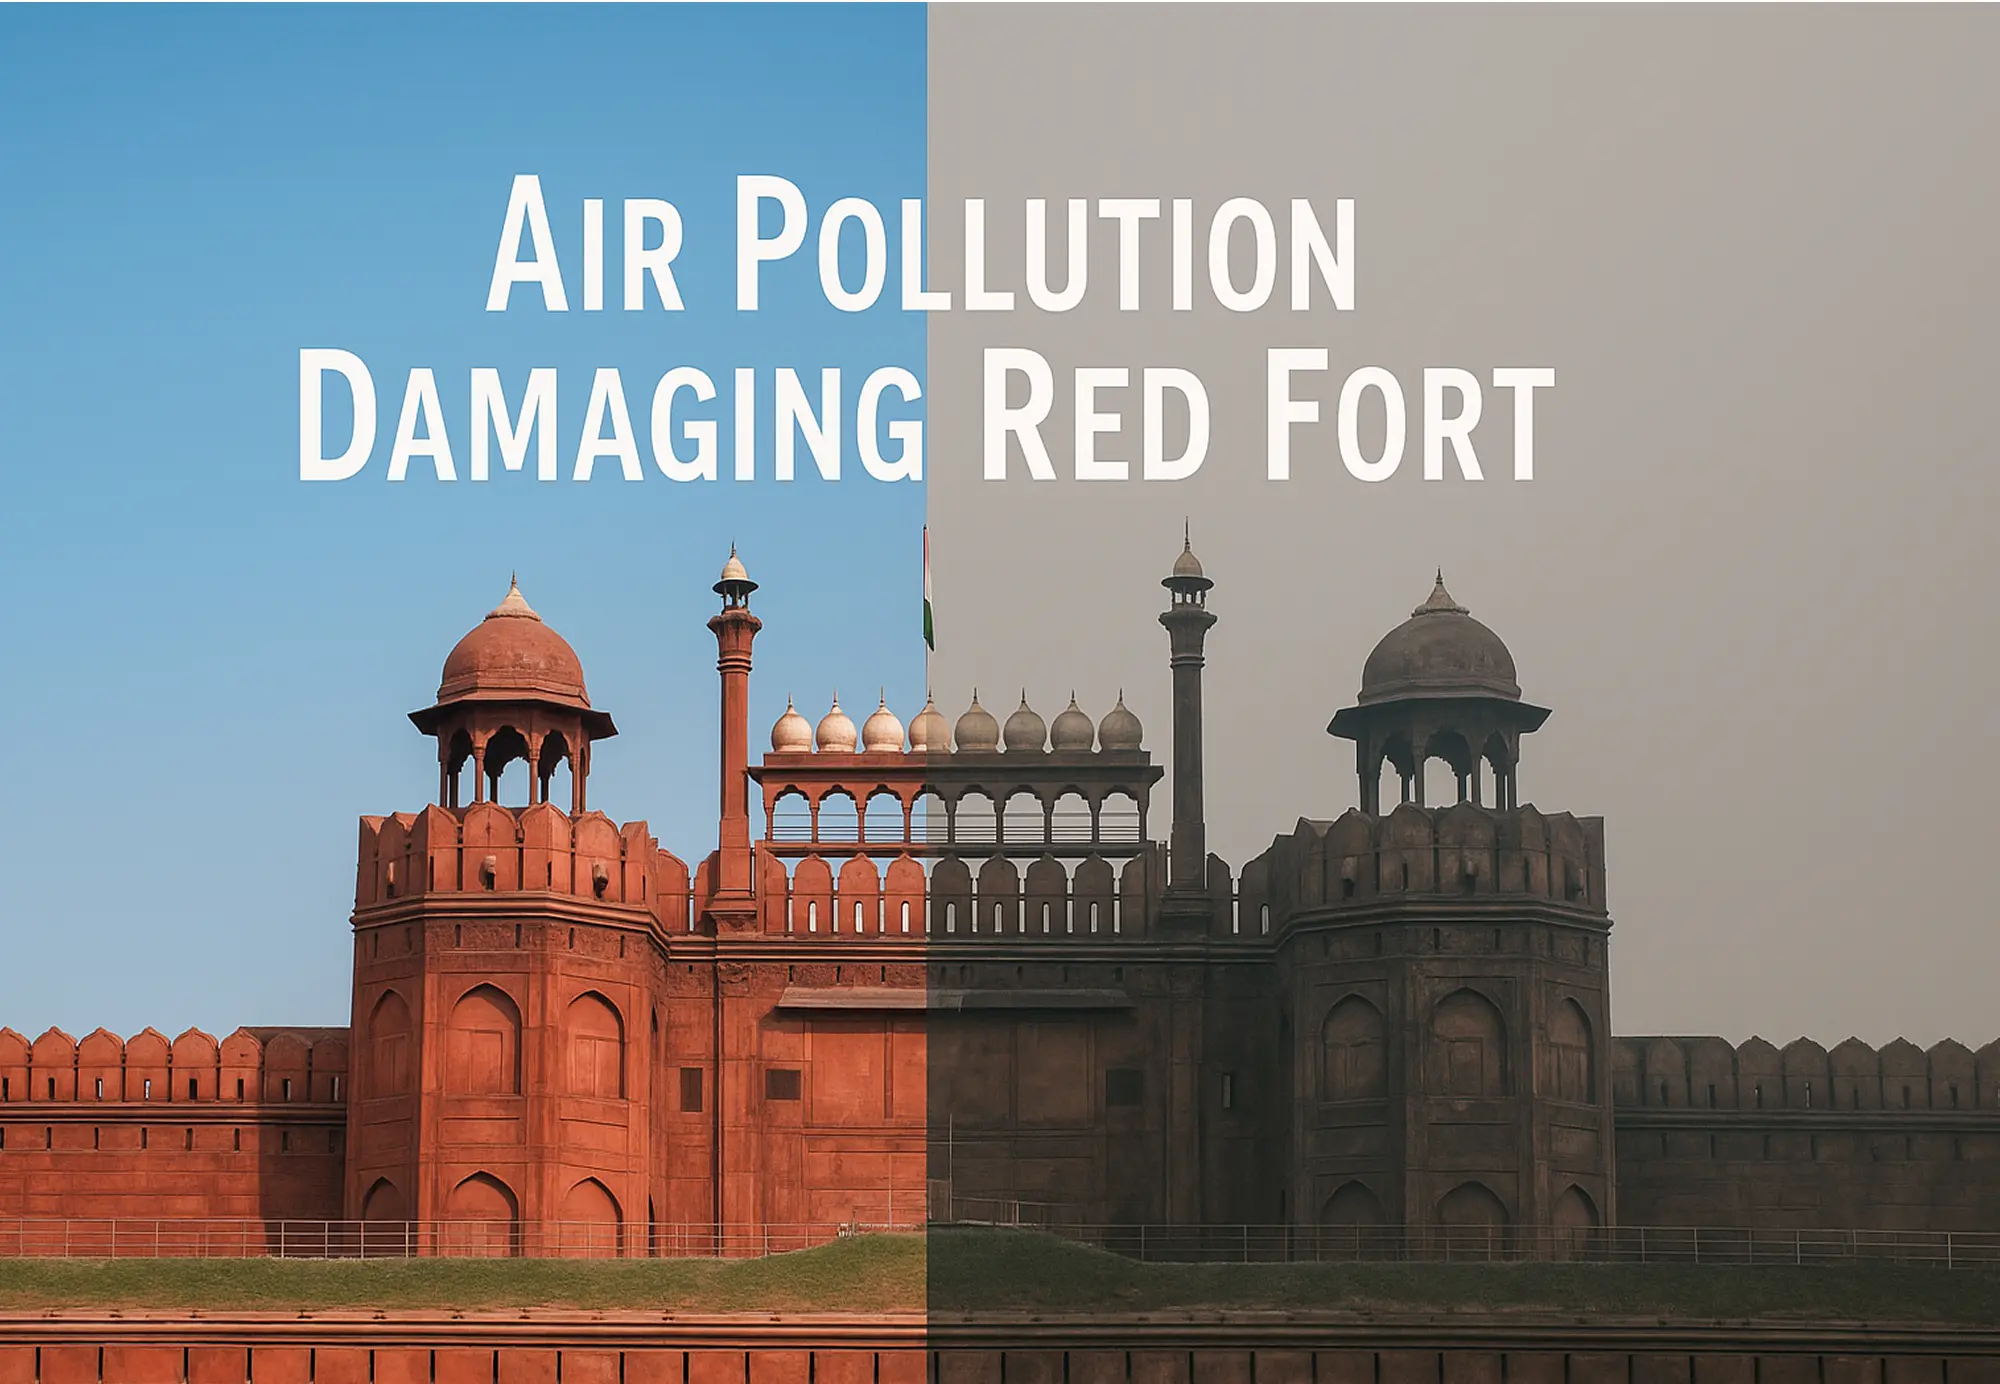
Red Fort in Delhi is Not Red Anymore! It is Turning Black: Air Pollution Damaging Red Fort

What’s the Connection Between Air Pollution and Blood Cancer?
AQI Graph
Historical Air Quality Data
Kilkunda
Download 2024 Annual Data
World Air Quality Report

PM10 particles are with a diameter of 10 micrometers (µm) or smaller and human hair has a diameter of 50 to 70 (µm). It makes PM10 1/5 to 1/7 of the human hair size.

Uncovering the Sources of Particulate Matter (PM10): Where Does It Come From?

Wind-blown dust
Dust lifted and spread by the wind from bare soil.
Construction sites
Dust and pollutants from building activities.
Industries
Releases various pollutants from different processes.
Waste burning
Smoke and toxins from burning waste materials.
Landfills
Emissions from decomposing waste in big landfills.
Vehicles exhausts
Emissions of harmful gases and particles from cars.Short-Term PM10 Exposure Impacts

Allergies
Airborne allergens causing sneezing and itching.
Cough and runny nose
Respiratory irritation cause to coughing
Eyes irritations
Redness and discomfort in the eyes.
Chest tightness
Constriction feeling in the chest.
Breathing difficulty
Trouble in breathing or discomfort in the chest.Health Advice Based on Current PM10 Level In
Kilkunda


Must turn on the air purifier to enjoy fresh air.
Get an Air PurifierRecommendations by 


Why you should care about Particulate Matter (PM10)?
Know More About PM10 Sensor
Air Quality FAQs
at Kilkunda
Frequently Asked Questions About Air Quality
What is the current PM10 level in Kilkunda?
The current real-time PM10 level in Kilkunda is 55 µg/m³ (Moderate). This was last updated 2025-10-08 06:10:20 AM (Local Time).
When was the best PM10 level in Kilkunda in the last 24 hours?
The best PM10 level was 44 µg/m³ (Good) at 3:04 AM (Local Time) during the last 24 hours.
When was the worst PM10 level in Kilkunda in the last 24 hours?
The worst PM10 level was 58 µg/m³ (Moderate) at 11:04 PM, Oct 7, 2025 (Local Time) during the last 24 hours.
What is the current trend of PM10 levels in Kilkunda during last 24 hours?
The PM10 levels in Kilkunda have been fluctuating throughout the last 24 hours. The levels have increased by highest 58 µg/m³ at 11:04 PM, Oct 7, 2025 (Local Time), lowest 44 µg/m³ at 3:04 AM (Local Time).
What actions are recommended as per the current PM10 level in Kilkunda?
Current PM10 levels are acceptable; however, some pollutants may be a concern for a small number of sensitive individuals.
