2024年の年次データをダウンロード
世界の大気品質レポート

空気質指数 (AQI) スケール
周囲の空気が属する空気質指数 (AQI) のカテゴリーとその意味を知りましょう。
良い(0 から 50)
空気は新鮮で、毒素が含まれていません。健康に関する懸念なく屋外活動を楽しんでください。

適度(51 から 100)
空気質はほとんどの人にとって許容範囲ですが、敏感な人々は軽度の不快感を感じるかもしれません。

悪い(101 から 150)
呼吸がわずかに不快になる可能性があり、特に呼吸器系の問題を抱える人々にとっては特にそうです。

不健康(151 から 200)
この空気質は特に子供、妊婦、高齢者にとってリスクがあります。屋外活動を制限してください。

深刻(201 から 300)
長時間の曝露は慢性的な健康問題や臓器損傷を引き起こす可能性があります。屋外活動を避けてください。

危険(301+)
危険なほど高い汚染レベル。長時間の曝露によって生命を脅かす健康リスクがあります。屋内に留まり、注意してください。


Cair +
Indoor Air Quality Monitor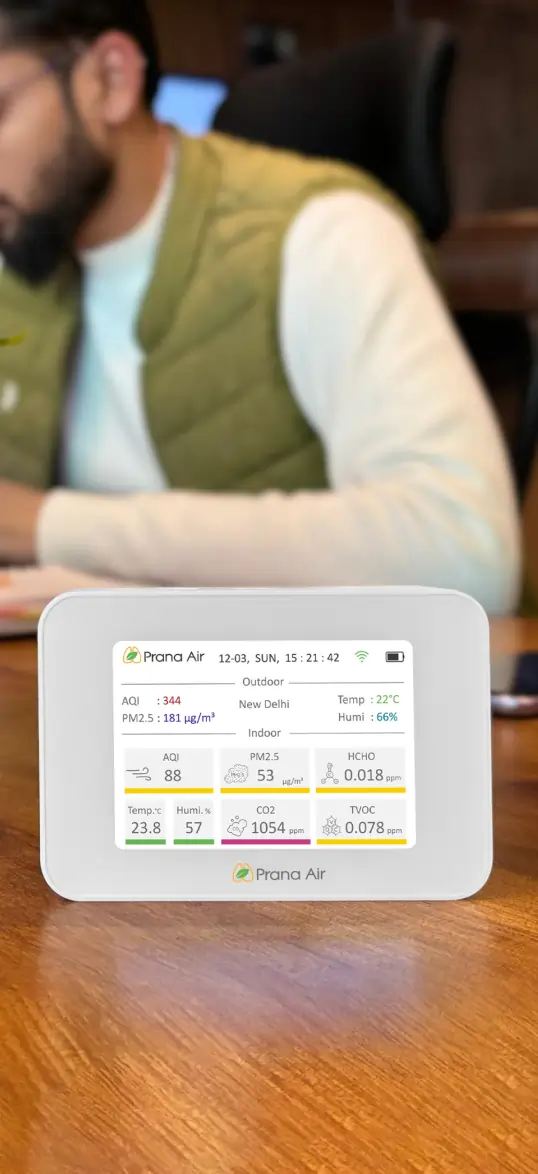
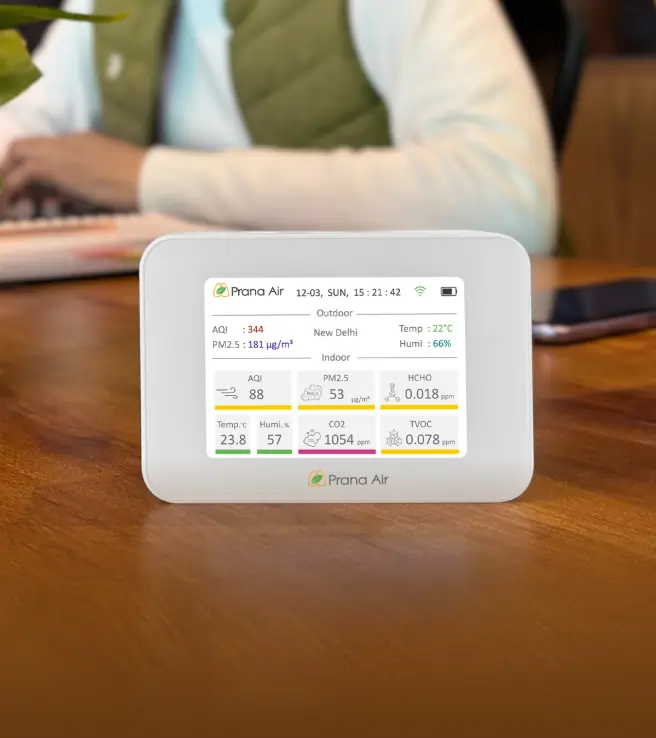
AQIデータ分析ソリューション
空気質データモニタリングプラットフォーム

詳細なパラメータを含む地域のリアルタイムデータ.
現在のAQIに基づいたパーソナライズされた健康アドバイス.
トレンドや状態を特定するための分析データ.
空気質デバイスを接続し、制御します。
空気質ソリューション
空気質モニタリングとクリーンエアのソリューションを探索しましょう。
こちらは、ソリューションを見つけるために確認できるアプリケーションです。


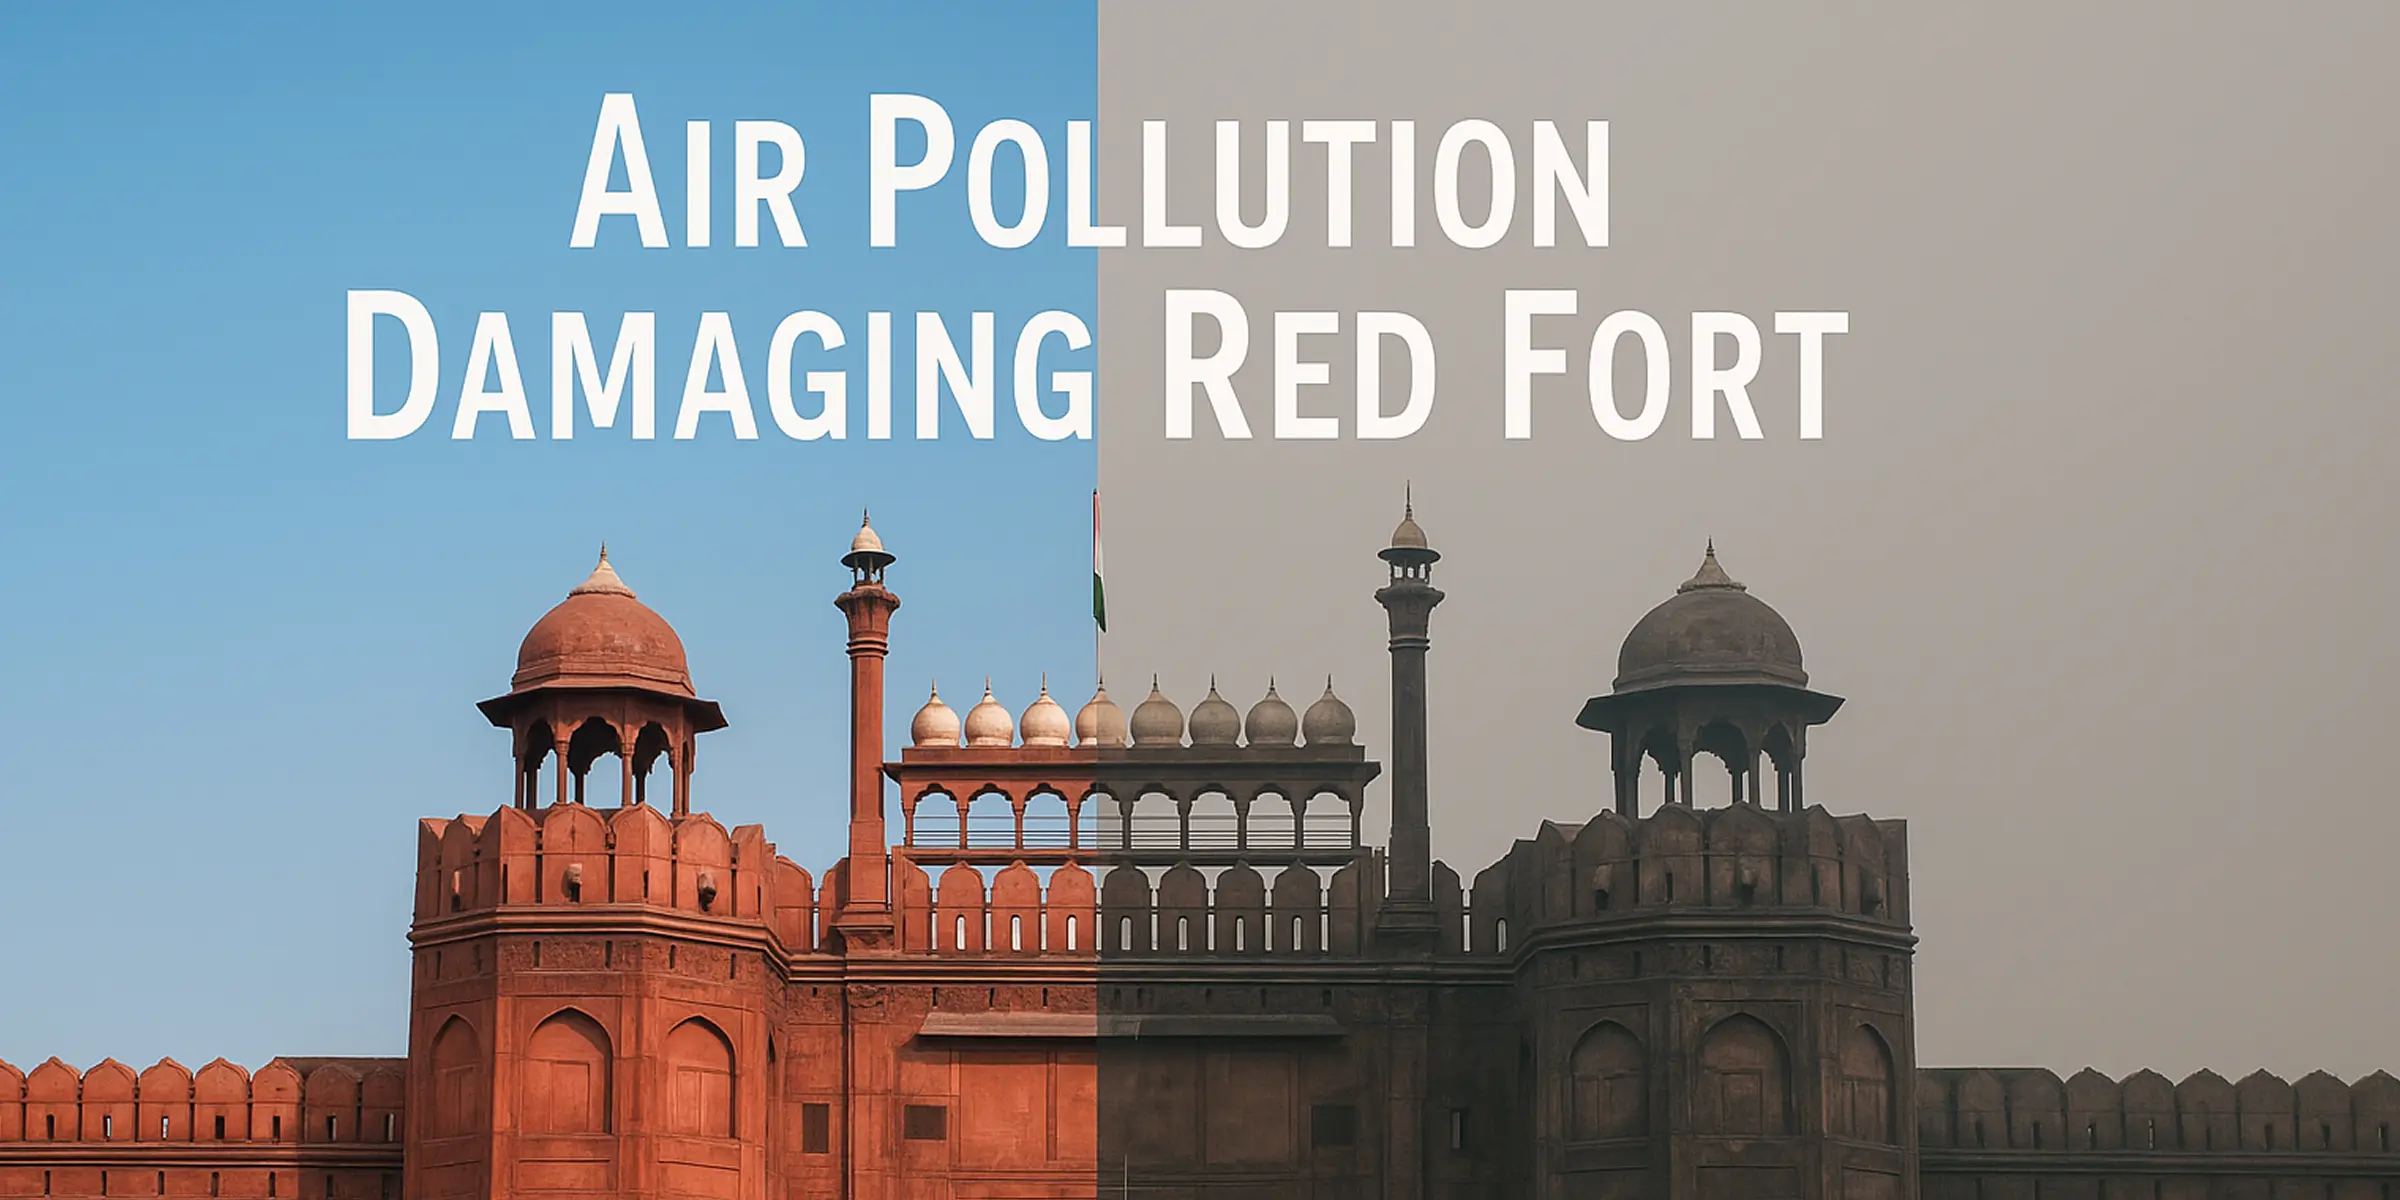
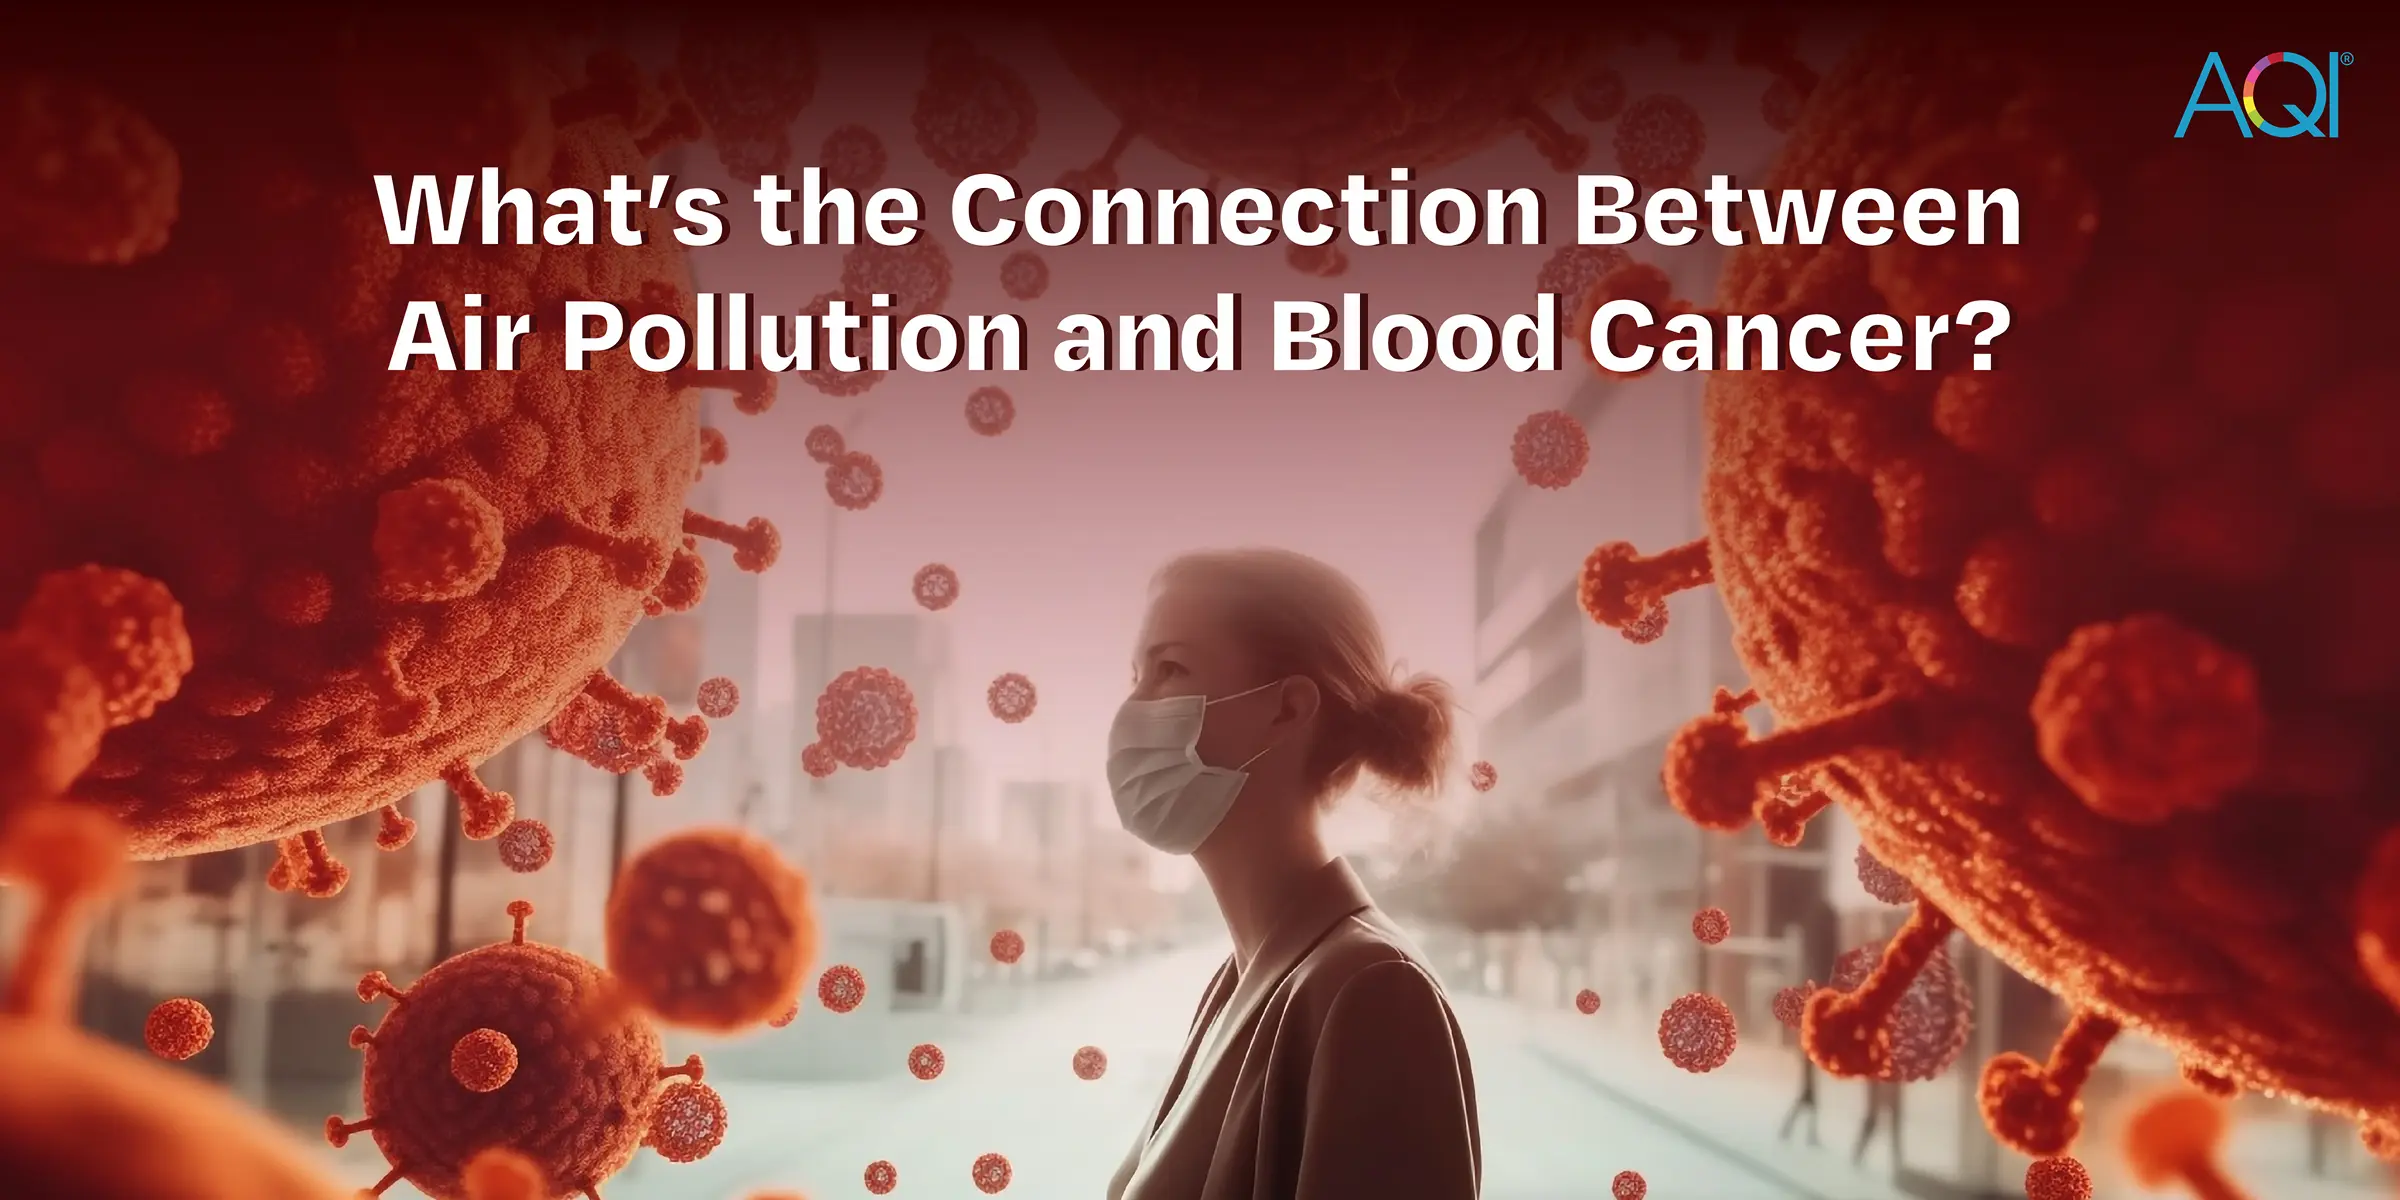
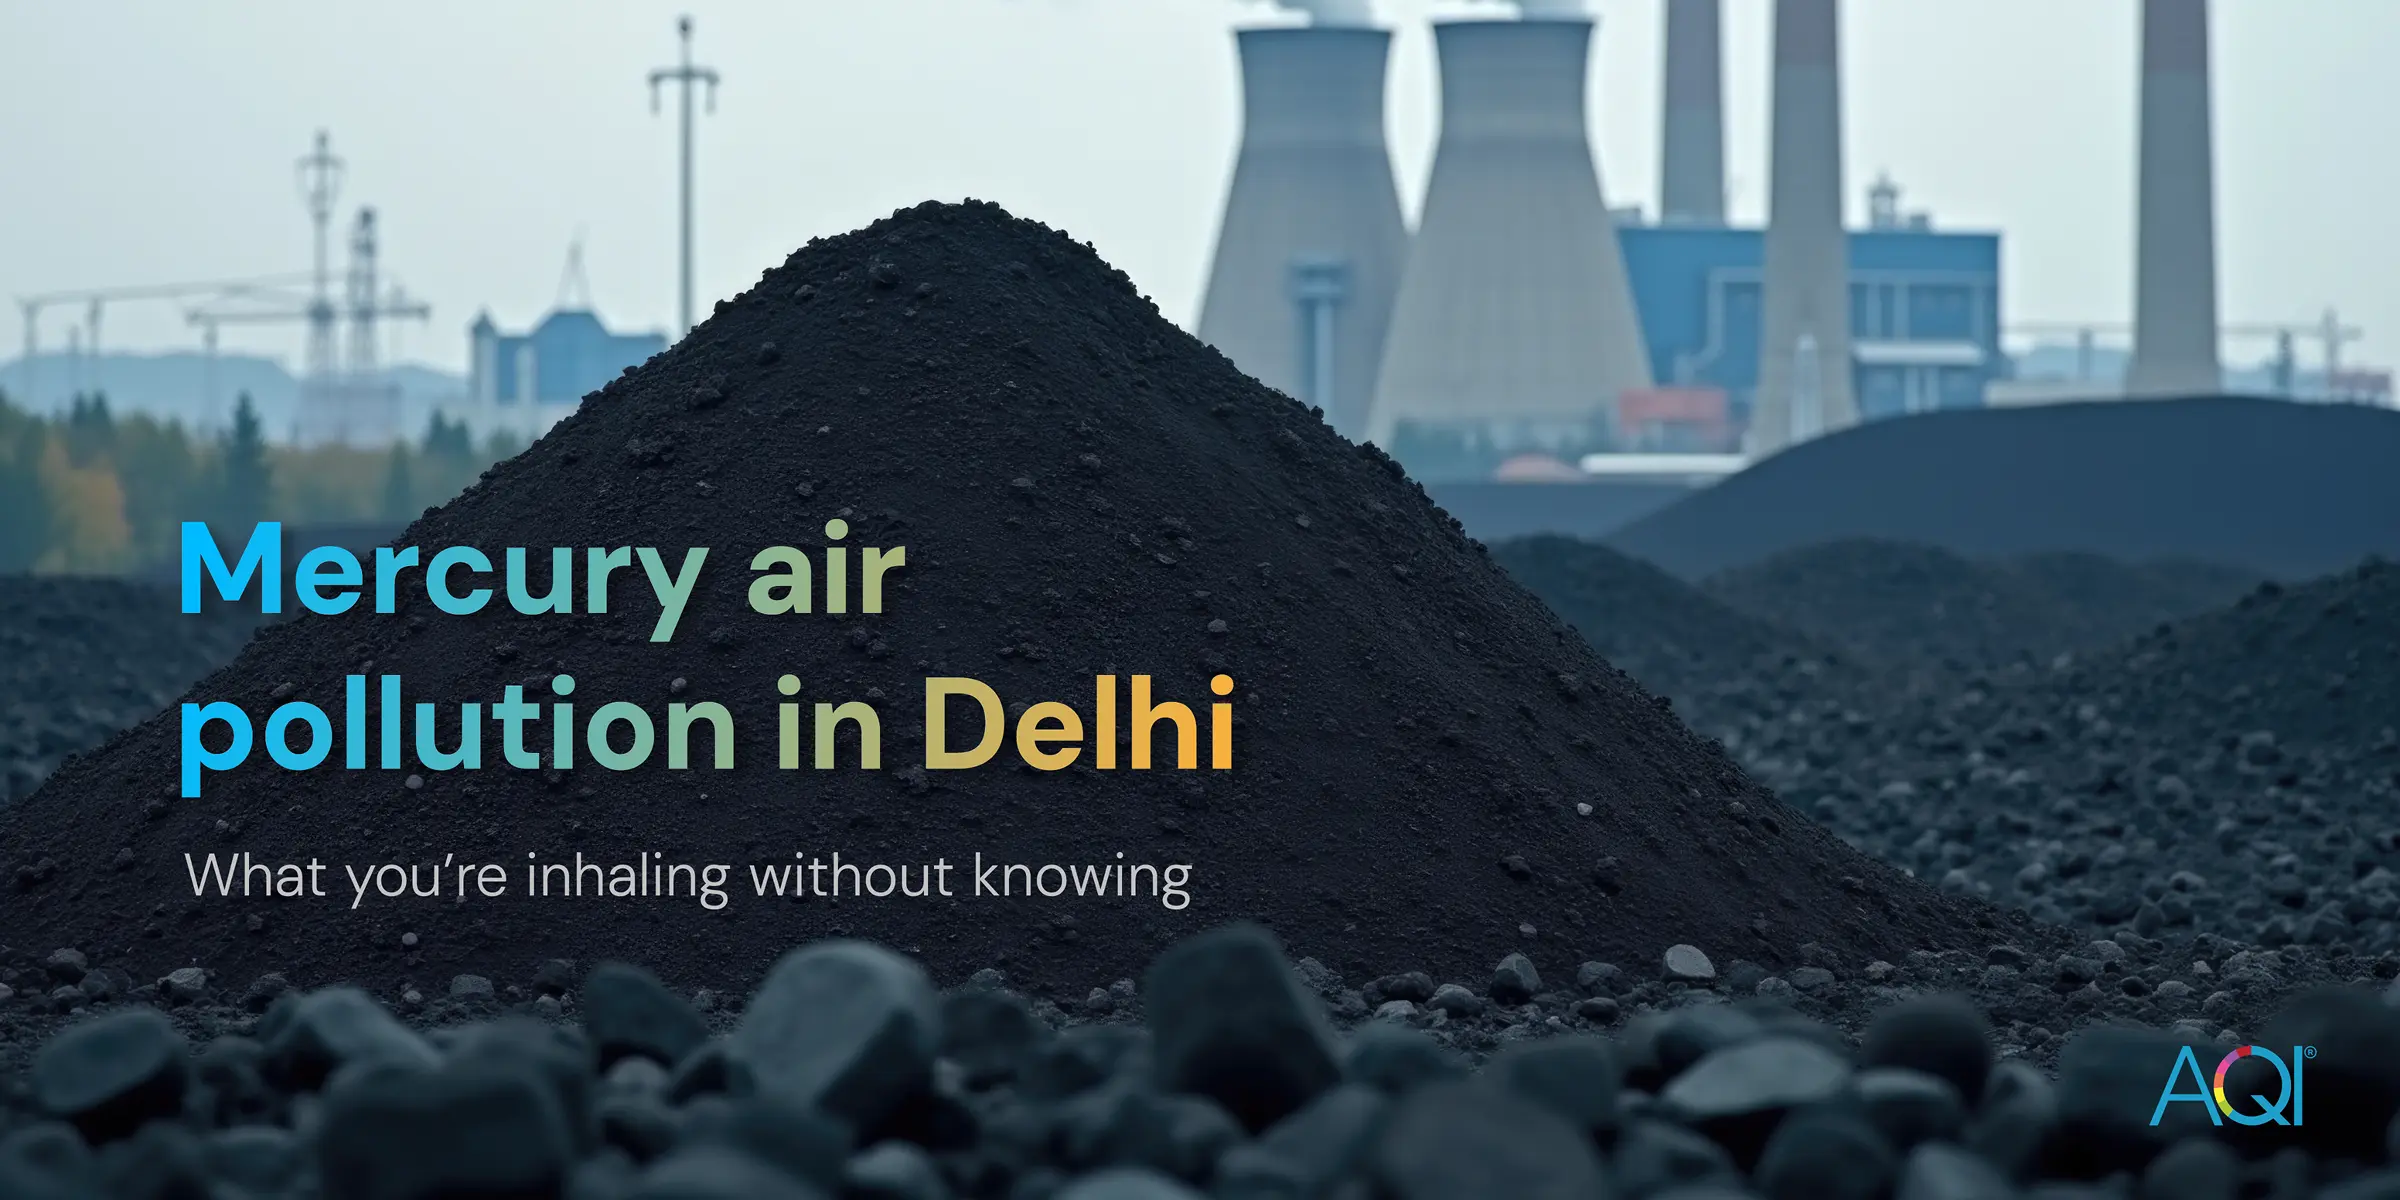
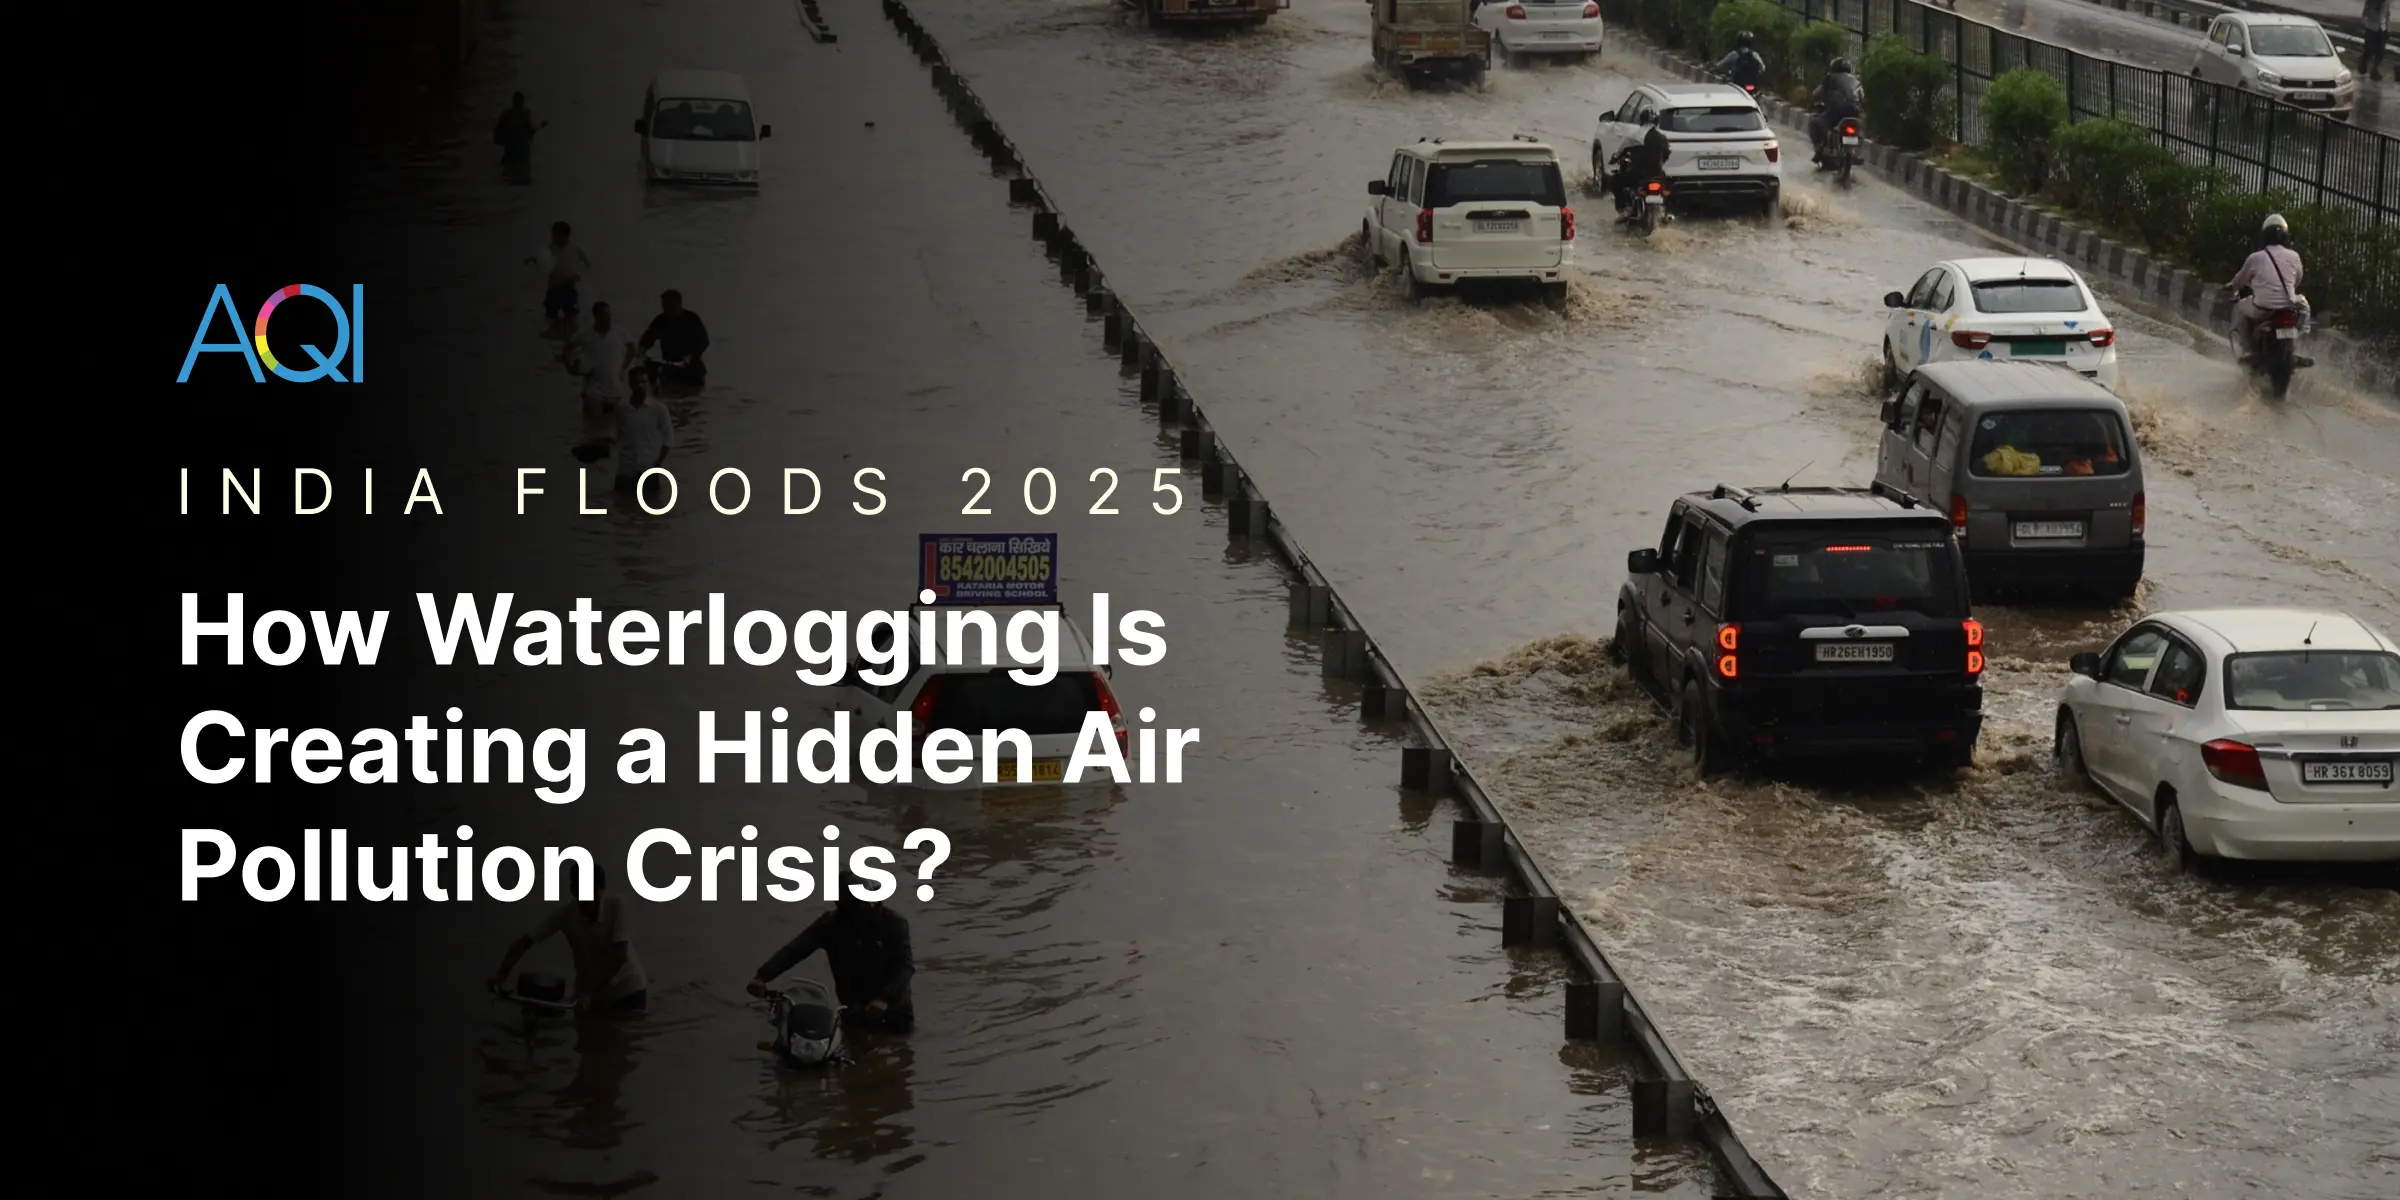
最近のAQIブログ
最新ニュースを読む
こちらは、空気汚染についてさらに知るための最新ブログです。


メディア報道
AQIはその顕著な成長と革新によりメディアで取り上げられています

信頼されています
業界のトップ組織の一部


世界の空気質
世界中のリアルタイム空気質モニタリング。
