Raghunathpur Air Quality Index (AQI) | Air Pollution
Real-time PM2.5, PM10 air pollution level in Dum Dum
Last Updated: 21 Nov 2025, 06:04am (Local Time)

19 °C
MistRaghunathpur
Trending in India
.png)
Dust vs Smoke: Why Cleaning Your Home Doesn’t Clean Your Air

What Our Politicians Breathe? Devices Reveal The Truth | Delhi Air Pollution | Ground Report
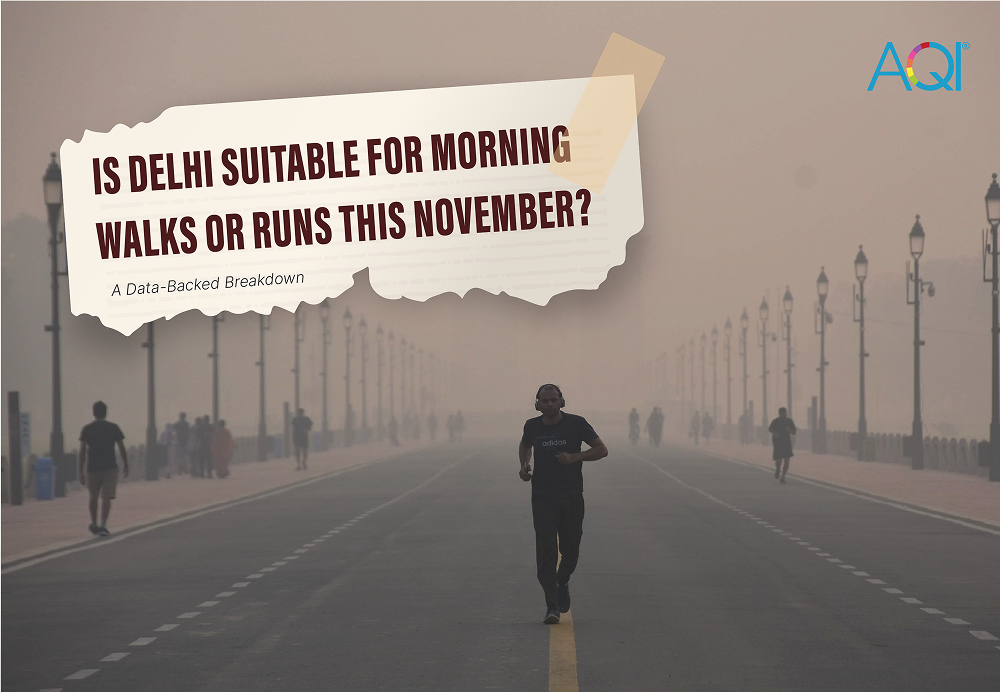
Is Delhi suitable for Morning Walks or Runs This November? A Data-Backed Breakdown
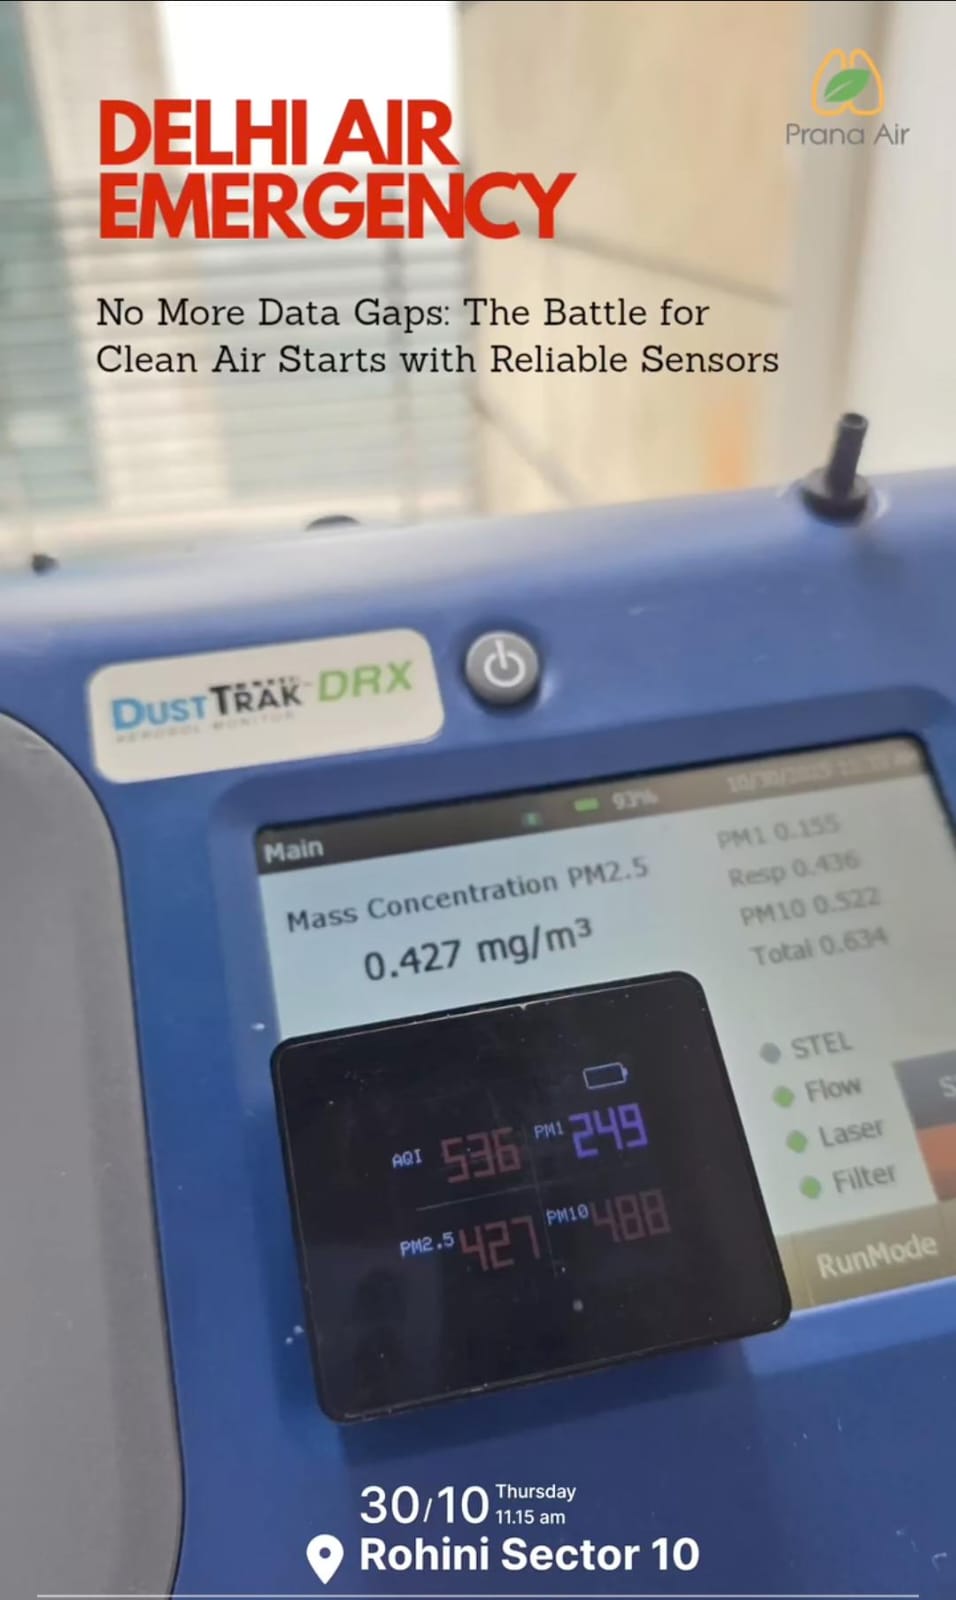
PM 2.5 Readings from TSI Dusstrak and Prana Air Pocket PM 2.5 Monitpr
-(1).png)
Why Every Smart Home in 2025 Needs a Smart Air Monitor
-(1).png)
Beyond the Smog : What’s Fueling India’s Air Crisis
.png)
Delhi’s Geography: The Invisible Trap Behind Its Worsening Air Pollution
AQI Graph
Historical Air Quality Data
Raghunathpur
Download 2024 Annual Data
World Air Quality Report

AQI Trends - Annual Air Quality Changes
Raghunathpur, Dum Dum, West Bengal, India
Annual AQI Trends
Most & Least Polluted Months
* This data analysis is from year 2021 - 2025
India's Metro Cities
Air Quality Index


Air Quality Calendar 2025
Raghunathpur
Health Advice For People Living In
Raghunathpur
5.9Cigarettes per day

Breathing the air in this location is as harmful as smoking 5.9 cigarettes a day.
Source:
Berkeley Earth
Solutions for Current AQI
 Air PurifierTurn On
 Car FilterMust
 N95 MaskMust
 Stay IndoorMust
Must turn on the air purifier to enjoy fresh air.
Get an Air PurifierPrevent Health Problems: Understand Your Risks
Raghunathpur
 Asthma
 Heart Issues
 Allergies
 Sinus
Sinus Cold/Flu
 Chronic (COPD)

High Chances of Asthma
Asthma
Risk of Asthma symptoms is High when AQI is Severe (150-301)
Severe symptoms including intense wheezing, severe shortness of breath, significant chest tightness, and persistent coughing that may disrupt daily activities.
Do's :
Avoid going outside and keep windows closed to reduce exposure to pollutants.
Take prescribed medications as directed by your healthcare provider.
Maintain clean indoor air with air purifiers, especially in bedrooms and living areas.
Don'ts :
Smoke or expose yourself to secondhand smoke.
Engage in physical exertion outdoors.
Most Polluted Cities 2025
India
Analyze the real-time most air polluted cities in the country.
Standard Value
1.
Khairabad, India
2.
Begampur, India
3.
Ghaziabad, India
4.
Siktaur, India
5.
Naultha, India
6.
Baghpat, India
7.
Noida, India
8.
Kaimla, India
9.
Sonipat, India
10.
Khalilabad, India
Last Updated: 21 Nov 2025, 12:37 AM
AQI City RankingsAir Quality Solutions For Raghunathpur
Explore the solutions of air quality monitoring & clean air.
Here are some applications that you can go through to find out the solutions.


Raghunathpur's AQI Data Analytics Solutions
Air quality data monitoring platforms

Your area’s real-time data with detailed parameters.
Personalized health advice as per current AQI.
Analytical data to identify trends and conditions.
Connect and control your air quality devices.
Air Quality FAQs
at Raghunathpur
Frequently Asked Questions About Air Quality
What is the current AQI level in Raghunathpur?
The current real-time AQI level in Raghunathpur is 282 (Severe). This was last updated 21 Nov 2025, 06:04am (Local Time).
When was the best AQI level in Raghunathpur in the last 24 hours?
The best AQI level was 147 (Poor) at 1:05 PM, Nov 20, 2025 (Local Time) during the last 24 hours.
When was the worst AQI level in Raghunathpur in the last 24 hours?
The worst AQI level was 291 (Severe) at 5:04 AM (Local Time) during the last 24 hours.
What is the current trend of AQI levels in Raghunathpur during last 24 hours?
The AQI levels in Raghunathpur have been fluctuating throughout the last 24 hours. The levels have increased by highest 291 at 5:04 AM (Local Time), lowest 147 at 1:05 PM, Nov 20, 2025 (Local Time).
What actions are recommended as per the current AQI level in Raghunathpur?
Current AQI levels are 'Very Unhealthy,' it is recommended to stay indoors, limit outdoor activities, use air purifiers, and wear masks if going outside is necessary.
Recent AQI Blogs
Read the latest news
Here are some latest blogs that you can go through to find out more air pollution.