United Kingdom Air Quality Index (AQI) | Air Pollution
Real-time PM2.5, PM10 air pollution level in United Kingdom
Last Updated: 8 minutes ago (Local Time)


18 °C
Partly cloudyUnited Kingdom
Trending in United Kingdom

Why Air Quality Monitoring and Clean Air is Necessary for Schools?

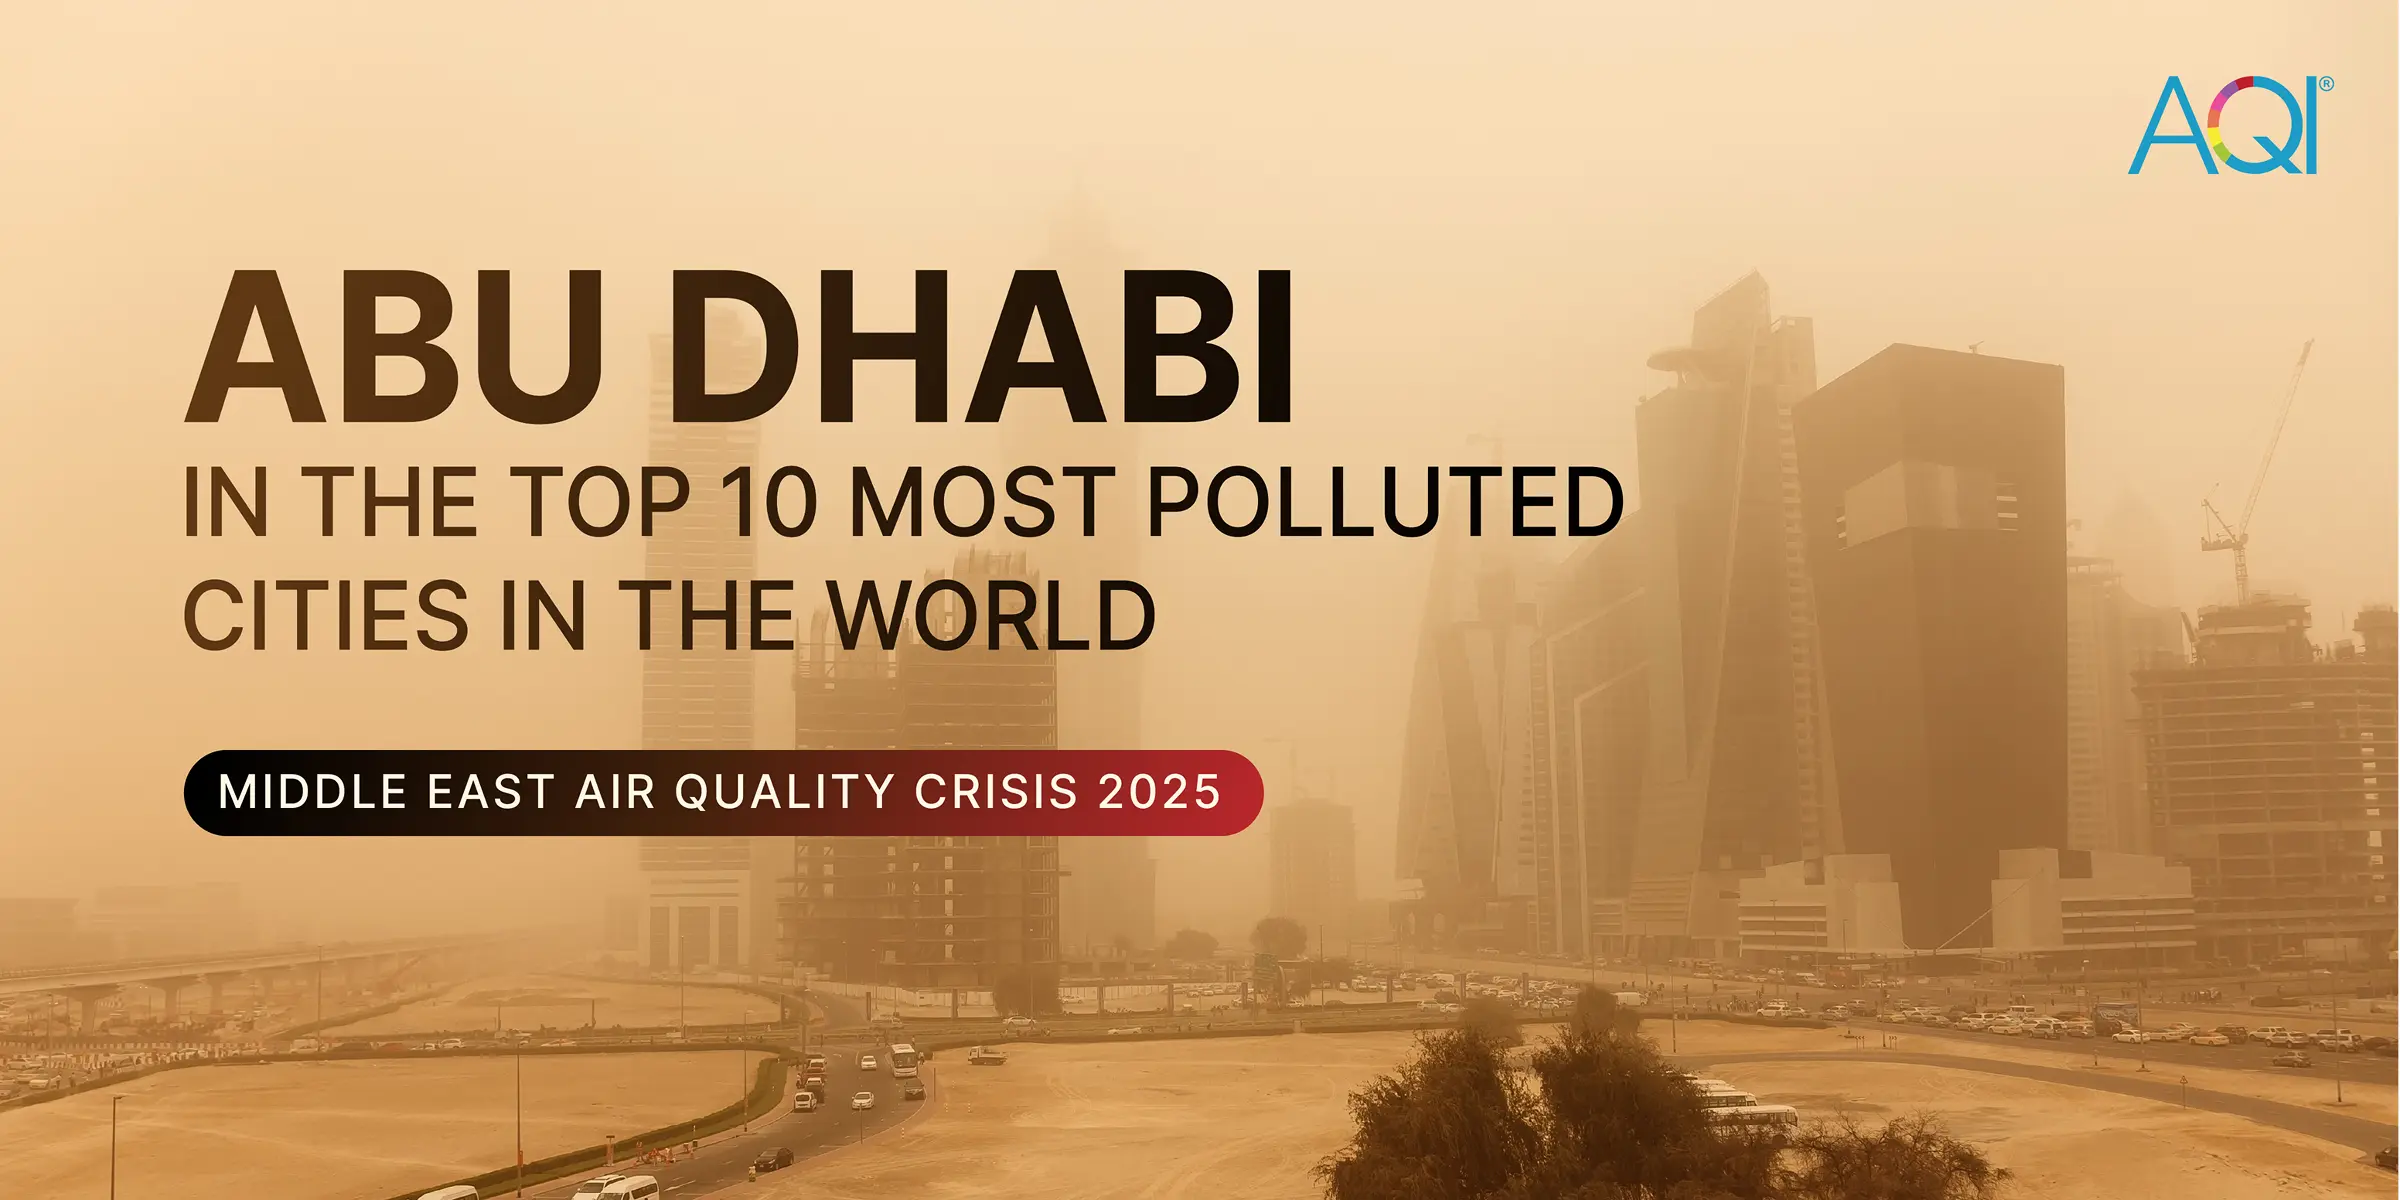
Abu Dhabi in the Top 10 Most Polluted Cities in the World: Middle East Air Quality Crisis 2025
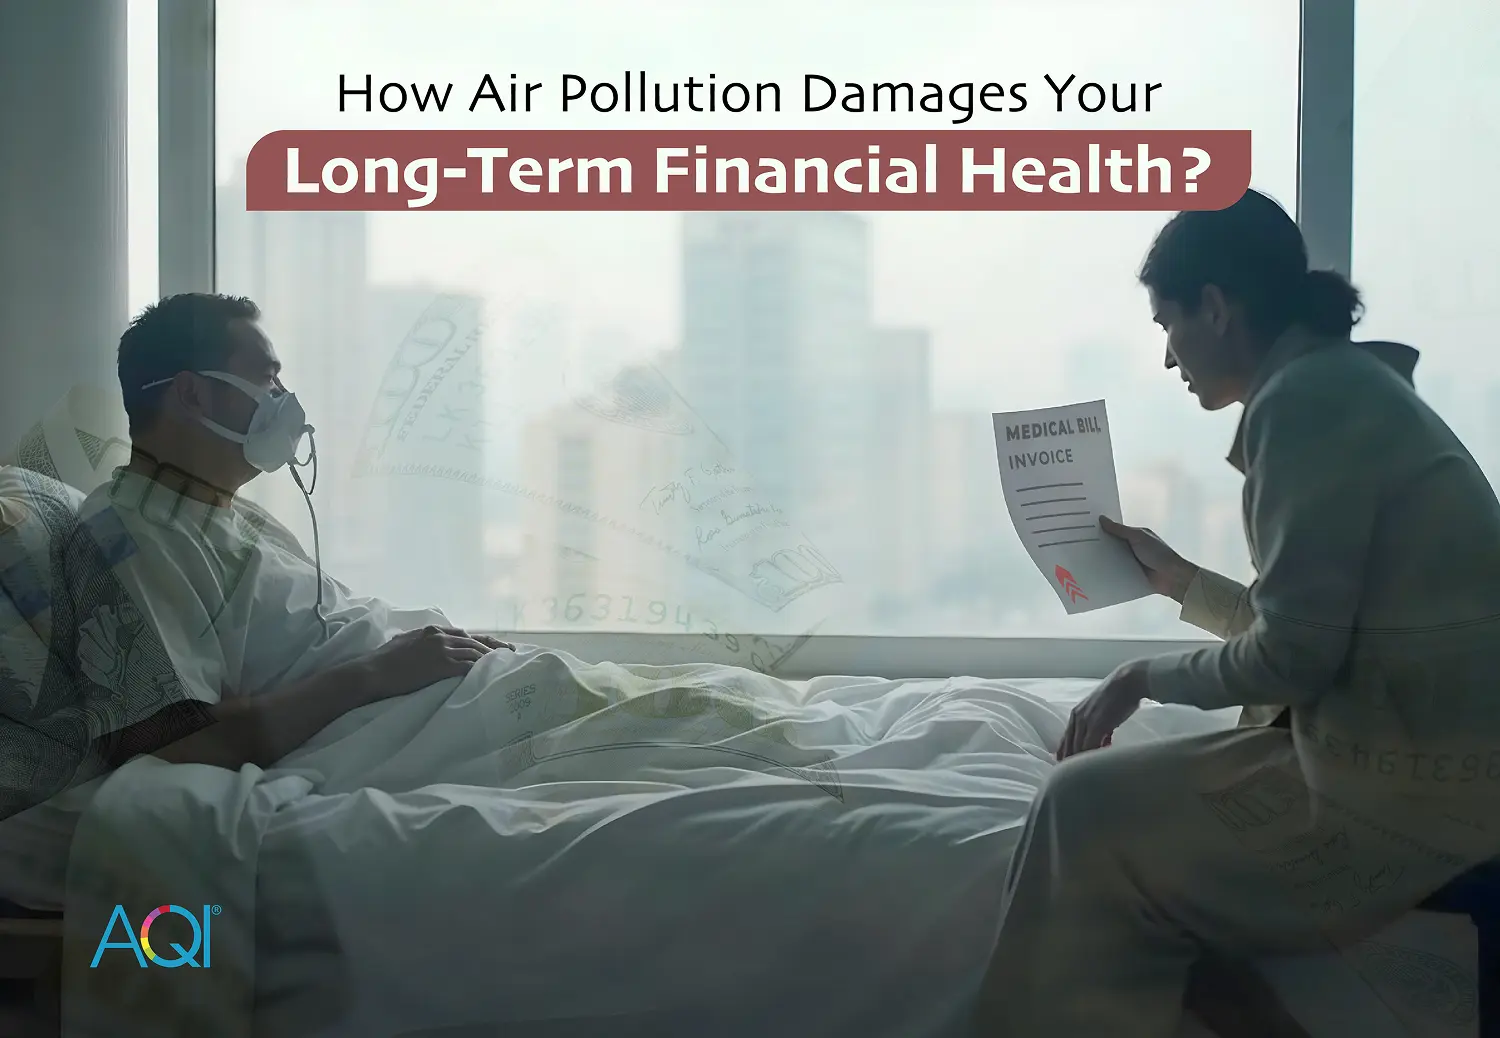
How Air Pollution Damages Your Long-Term Financial Health?

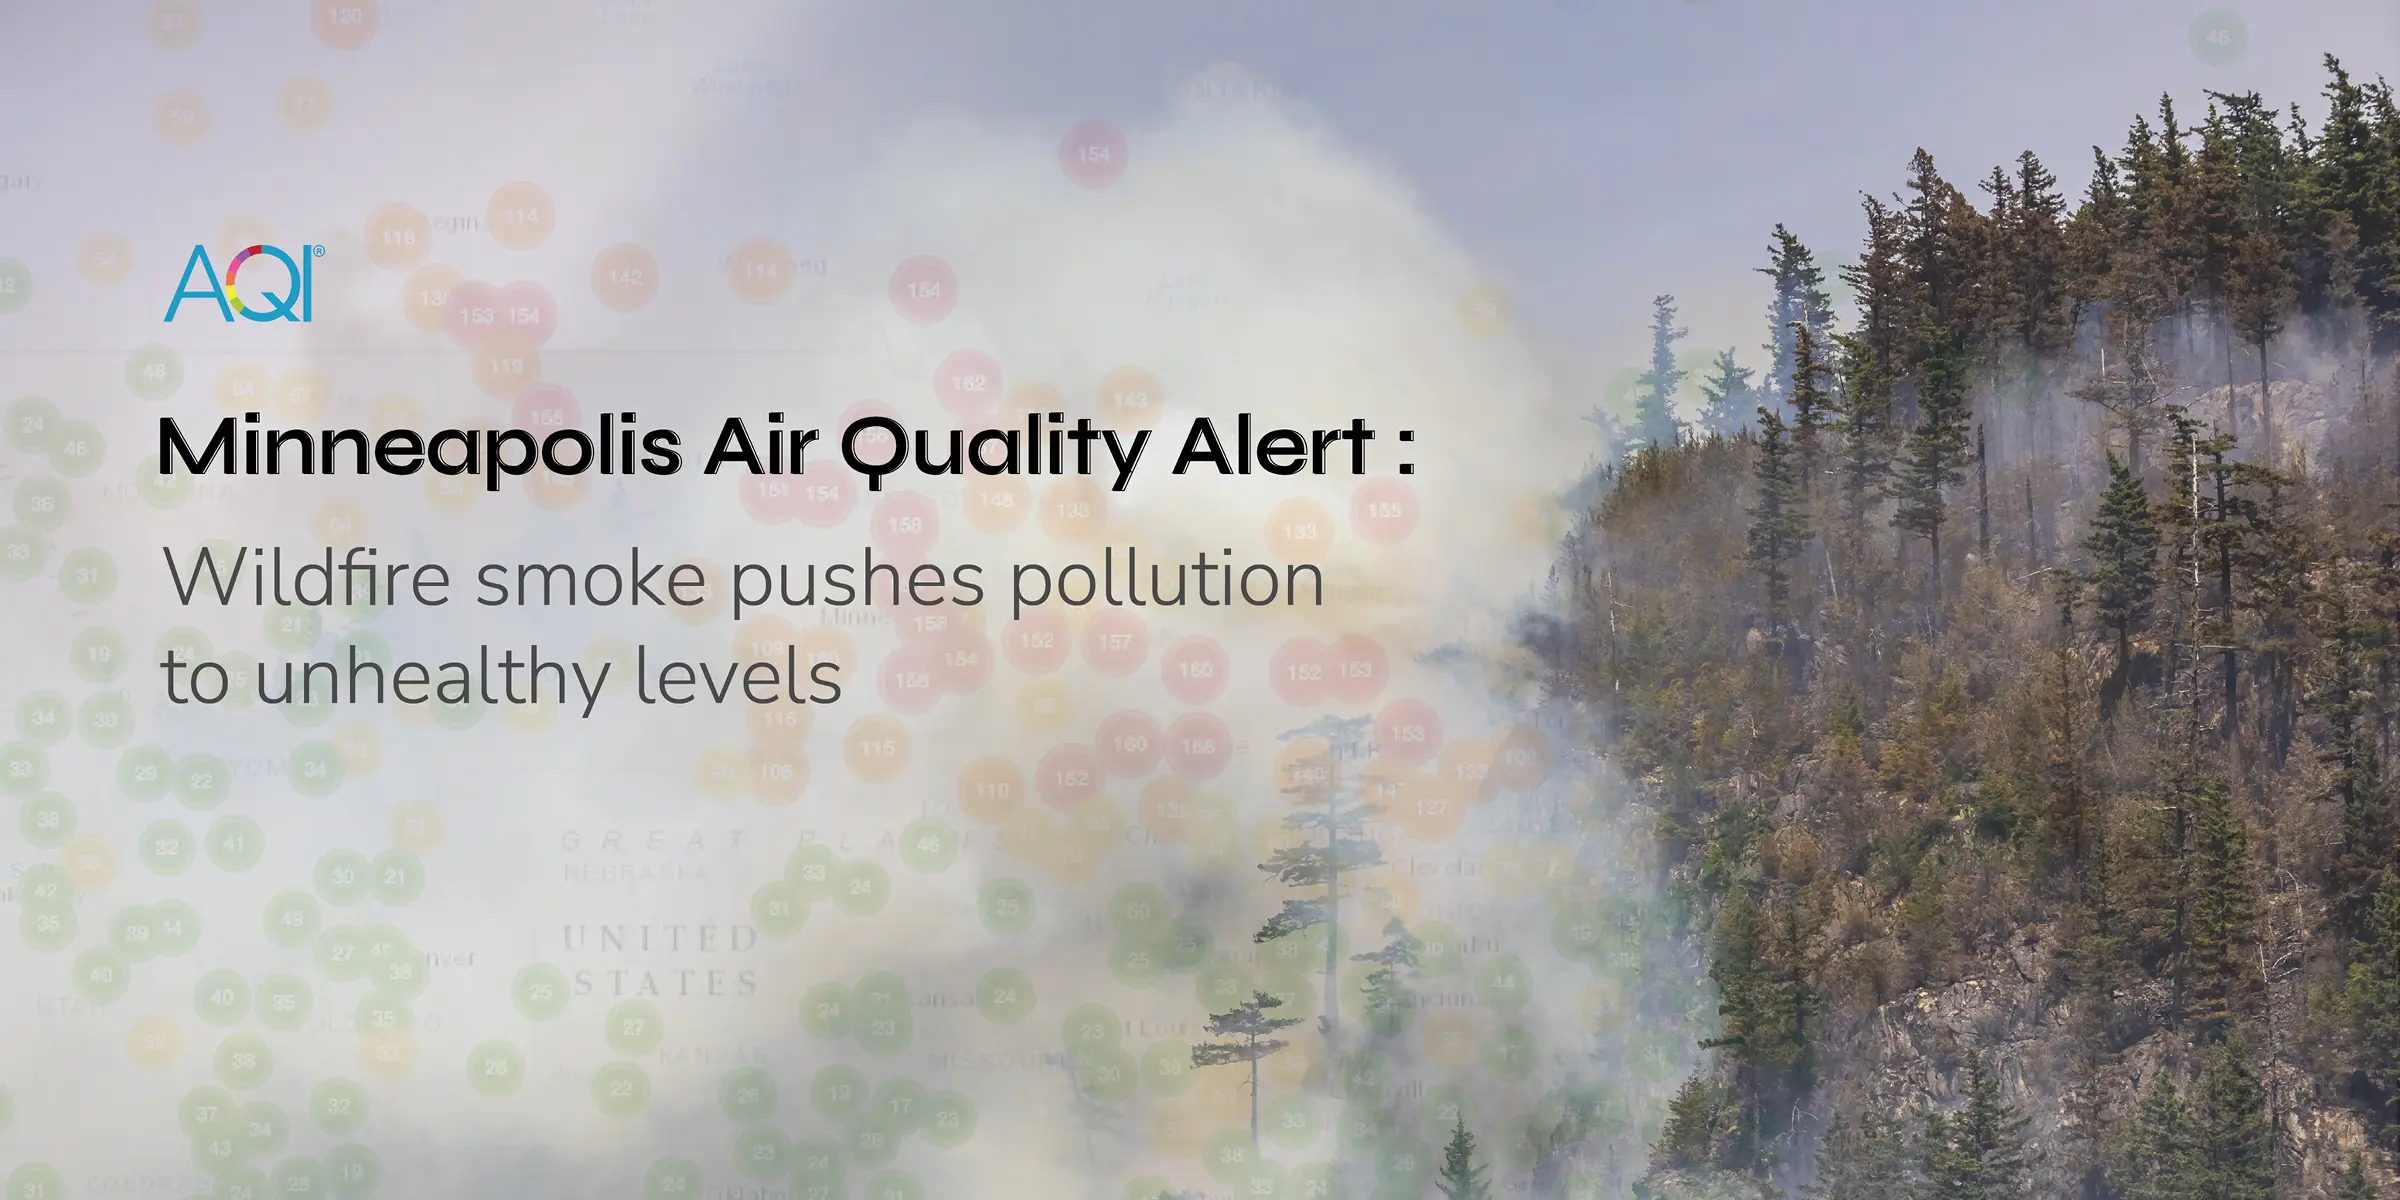
Europe heatwave and wildfires 2025: What is happening across Spain, Portugal and neighbouring countries?
AQI Graph
Historical Air Quality Data
United Kingdom
Download 2024 Annual Data
World Air Quality Report

United Kingdom's States
Real-time Air Pollution Level
United Kingdom's Metro Cities
Air Quality Index


Most Polluted Cities 2025
United Kingdom
Analyze the real-time most air polluted cities in the country.
Standard Value
1.
Wanstead, United Kingdom
2.
Dollis Hill, United Kingdom
3.
Ilford, United Kingdom
4.
Plumstead, United Kingdom
5.
West Drayton, United Kingdom
6.
Eltham, United Kingdom
7.
Stanmore, United Kingdom
8.
Kingston Upon Hull, United Kingdom
9.
Pontypridd, United Kingdom
10.
East Grinstead, United Kingdom
Last Updated: 26 Aug 2025, 11:37 AM
AQI City RankingsAir Quality Solutions For United Kingdom
Explore the solutions of air quality monitoring & clean air.
Here are some applications that you can go through to find out the solutions.


United Kingdom's AQI Data Analytics Solutions
Air quality data monitoring platforms

Your area’s real-time data with detailed parameters.
Personalized health advice as per current AQI.
Analytical data to identify trends and conditions.
Connect and control your air quality devices.
Air Quality FAQs
at United Kingdom
Frequently Asked Questions About Air Quality
What is the current AQI level in United Kingdom?
The current real-time AQI level in United Kingdom is 27 (Good) due to recent rainfall by 0.28mm/hr. This was last updated 8 minutes ago (Local Time).
When was the best AQI level in United Kingdom in the last 24 hours?
The best AQI level was 27 (Good) at 12:10 PM (Local Time) during the last 24 hours.
When was the worst AQI level in United Kingdom in the last 24 hours?
The worst AQI level was 34 (Good) at 8:10 AM (Local Time) during the last 24 hours.
What is the current trend of AQI levels in United Kingdom during last 24 hours?
The AQI levels in United Kingdom have been fluctuating throughout the last 24 hours. The levels have increased by highest 34 at 8:10 AM (Local Time), lowest 27 at 12:10 PM (Local Time).
What actions are recommended as per the current AQI level in United Kingdom?
The air quality is satisfactory, and air pollution poses little or no risk. No special precautions are needed; enjoy outdoor activities freely.
Recent AQI Blogs
Read the latest news
Here are some latest blogs that you can go through to find out more air pollution.